1 Network performance measurements Les Cottrell – SLAC Prepared for the ICFA-SCIC, CERN December...
29
1 Network performance measurements Les Cottrell – SLAC Prepared for the ICFA-SCIC, CERN December 8, 2001 Partially funded by DOE/MICS Field Work Proposal on Internet End-to-end Performance Monitoring (IEPM), also supported by IUPAP
-
Upload
darlene-perry -
Category
Documents
-
view
222 -
download
2
Transcript of 1 Network performance measurements Les Cottrell – SLAC Prepared for the ICFA-SCIC, CERN December...

1
Network performance measurements
Les Cottrell – SLACPrepared for the ICFA-SCIC, CERN December 8, 2001
Partially funded by DOE/MICS Field Work Proposal on Internet End-to-end Performance Monitoring (IEPM), also supported by IUPAP

2
PingER deployment• Measurements from
– 34 monitors in 14 countries• 6 DoE Labs, 4 DoE Uni
– Over 600 remote hosts• 65 DoE funded universities
– Over 72 countries – Over 3300 monitor-remote site pairs– Measurements go back to Jan-95– Reports on RTT, loss, reachability, jitter, reorders, duplicates …
• Countries monitored– Contain 78% of world population– 99% of online users of Internet
• Lightweight (100bps/host pair)– Very useful for inter-regional and poor links, need more intensive for high
performance & Grid sites
• Plan to continue project
3
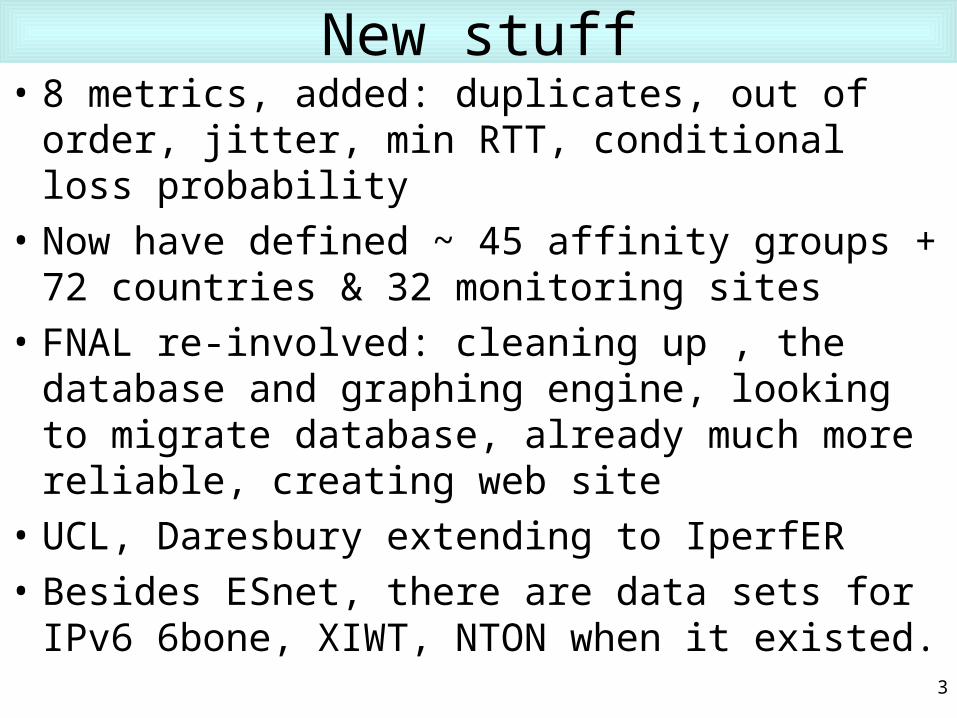
New stuff• 8 metrics, added: duplicates, out of order, jitter, min
RTT, conditional loss probability
• Now have defined ~ 45 affinity groups + 72 countries & 32 monitoring sites
• FNAL re-involved: cleaning up , the database and graphing engine, looking to migrate database, already much more reliable, creating web site
• UCL, Daresbury extending to IperfER
• Besides ESnet, there are data sets for IPv6 6bone, XIWT, NTON when it existed.

4
Throughput quality improvementsTCPBW < MSS/(RTT*sqrt(loss))
Macroscopic Behavior of the TCP Congestion Avoidance Algorithm, Matthis, Semke, Mahdavi, Ott, Computer Communication Review 27(3), July 1997
Note E. Europe keeping up
80% annual improvement ~ factor 10/4yr
China

5
Losses: Rest of world by region• <1% = good, 2.5%=acceptable, < 5%=poor, <12%=v. poor,
>12%=bad
• E. Europe still problems
• Middle East, S. & Central America also problem regions

6
Rest of world by TLD• Russia poor to bad China poor

7
We need to better understand• Closer to applications, e.g. FTP• Understand how to make throughput measurements:
– Duration & frequency (balance impact against granularity needed), – Windows and or vs parallel streams, – OS dependencies, cpu utilization, interface speeds, security (e.g.
ssh)– Impact on others, variability on different time-scales– Can we use QBSS, can/should application self limit?– How well does simulation work, how to improve?– How to relate to simpler measurements– How does file transfer work compared to iperf?– Is compression useful and when?– How useful is it for the application to get feedback from the
network?

8
How to measure network throughput• Selected about 2 dozen major collaborator sites in US, CA, JP,
FR, CH, IT, UK over last year– Of interest to SLAC (HENP, PPDG, Internet measurement centers)– Can get logon accounts
• Use iperf, bbcp (soon bbftp, gridftp) + traceroute etc.• Choose window size and # parallel streams
– Run for 10 seconds together with ping (loaded)– Stop iperf, run ping (unloaded) for 10 seconds– Change window or number of streams & repeat– Record # streams, window, throughput (Mbits/s), loaded & unloaded
ping responsesVerify window sizes are set properly by using tcpdump can’t believe what application tells you
• Compare bandwidth measurement tools plus with iperf, bbcp, bbftp, gridFTP – choose minimum set, automate

9Solaris Default window size
Typical resultsTodayHi-thru usually= big windows & multiple streams
Improves ~ linearlywith streams forsmall windows
8kB
16kB32kB
100kB
64kB
Broke 100MbpsTrans AtlanticBarrier

10
Windows vs Streams• Multi-streams often more effective than windows
– more agile in face of congestion
• Often easier to set up – Need root to configure kernel to set max window– Network components may not support big windows– Some OS’ treat max windows strangely
• May be able to take advantage of multiple paths
• But:– may be considered over-aggressive (RFC 2914) – can take more cpu cycles– how to know how many streams?

11
Iperf client CPU utilization• As expected increases with throughput (mainly kernel)• 0.7*MHz/Mbits/s
•For fixed throughput–Fewer streams take less cpu –E.g. 1-4 streams take 20% less cpu than 8-16 streams for same throughput (if can get it)

12
CPU vs window vs streams vs throughput
•MHz ~ 0.97 * Mbps•Bigger windows = less cpu for fixed throughput
Iperf % cpu vs throughput vs window SLAC to RIKEN Nov 29 '01
0
5
10
15
20
0 5 10 15 20Throughput Mbits/s
CP
U M
Hz
8K 16KB32KB 64KB128KB 256KB512KB 1024KB
Increasing window
Increasing streams
Hooks at end = saturation

13
PathologiesDiurnal variation often indicates saturationRouting change
Flat time series due to host NIC limit (100Mbps)
14
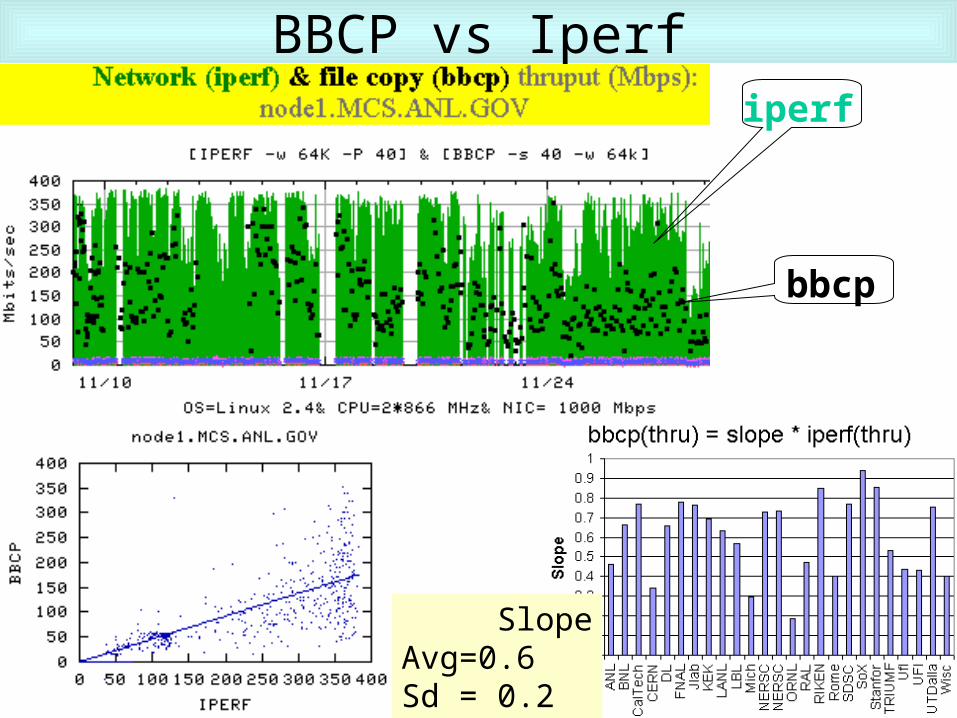
BBCP vs Iperf
SlopeAvg=0.6Sd = 0.2
bbcp
iperf

15
Bbcp memory vs disk (=>/tmp)Bbcp disk vs bbcp mem throughput
y = 0.8725x
R2 = 0.7934
0
20
40
60
80
100
120
140
0 20 40 60 80 100 120 140
BBCP mem to mem throughput Mbits/s
Bb
cp d
isk
to d
isk
thro
ug
hp
ut
Mb
its/
s
Caltech
ORNL
CERN
RAL
Wisconsin
Michigan
Daresbury
Rice
FNAL
JLab
KEK
LANL
LBL
All
Linear (All)

16
But …Bbcp disk vs bbcp mem throughput
y = 0.8725x
R2 = 0.7934
0
50
100
150
200
250
300
0 50 100 150 200 250 300 350 400
BBCP mem to mem throughput Mbits/s
Bb
cp d
isk
to d
isk
thro
ug
hp
ut
Mb
its/
sCaltech
ORNL
CERN
RAL
Wisconsin
Michigan
Daresbury
Rice
FNAL
JLab
KEK
LANL
LBL
All
Linear (All)
LANL has Maxtor IDE disks

17
CompressionBbcp file throughput from SLAC to CERN
by compression factor, Dec 5 '01
0
10
20
30
40
50
0 2 4 6 8 10Compression factor
Bb
cp
thro
ug
hp
ut
Mb
its/
s
0
2
4
6
8
10
Co
mp
ress
ion
rat
io
•60Mbyte Objectivity file, using zlib, 8 streams, 64KB window•Can improve throughput on this link with these hosts (Sun Ultra Sparcs with 360MHz cpus) by more than a factor of 2.•Want to characterize improvement as function(hosts, link speeds, …)

18
Impact on Others• Make ping measurements with & without iperf
loading– Loss loaded(unloaded)– RTT
• Looking at how to avoid impact: e.g. QBSS/LBE, application pacing, control loop on stdev(RTT) reducing streams, want to avoid scheduling
19
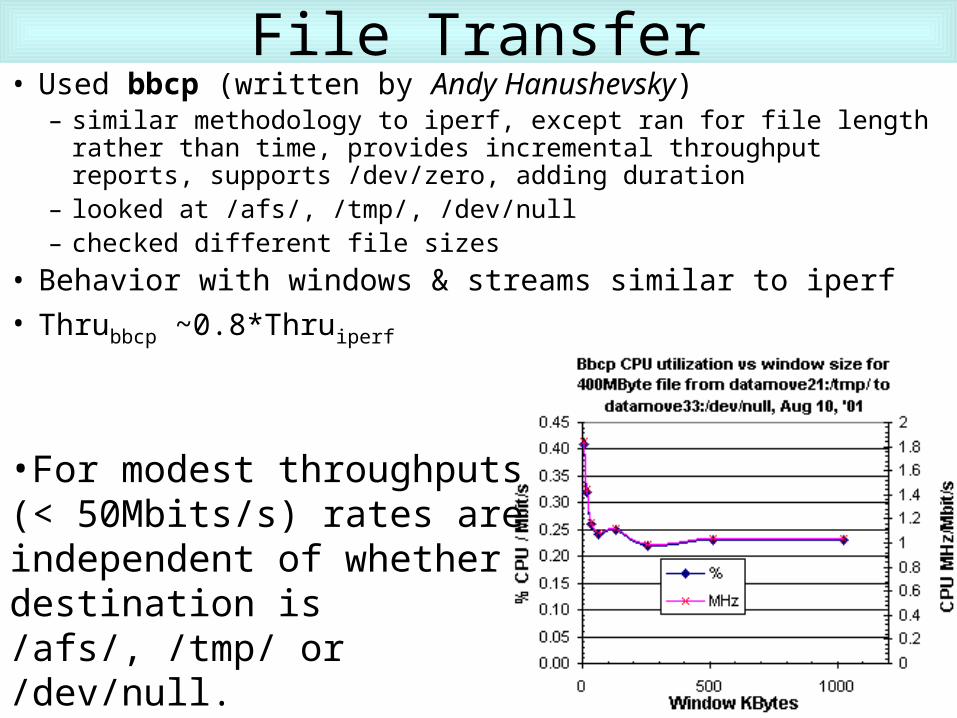
File Transfer• Used bbcp (written by Andy Hanushevsky)
– similar methodology to iperf, except ran for file length rather than time, provides incremental throughput reports, supports /dev/zero, adding duration
– looked at /afs/, /tmp/, /dev/null– checked different file sizes
• Behavior with windows & streams similar to iperf
• Thrubbcp ~0.8*Thruiperf
•For modest throughputs (< 50Mbits/s) rates are independent of whether destination is /afs/, /tmp/ or /dev/null. •Cpu utilization ~ 1MHz/Mbit/s is ~ 20% > than for iperf
20
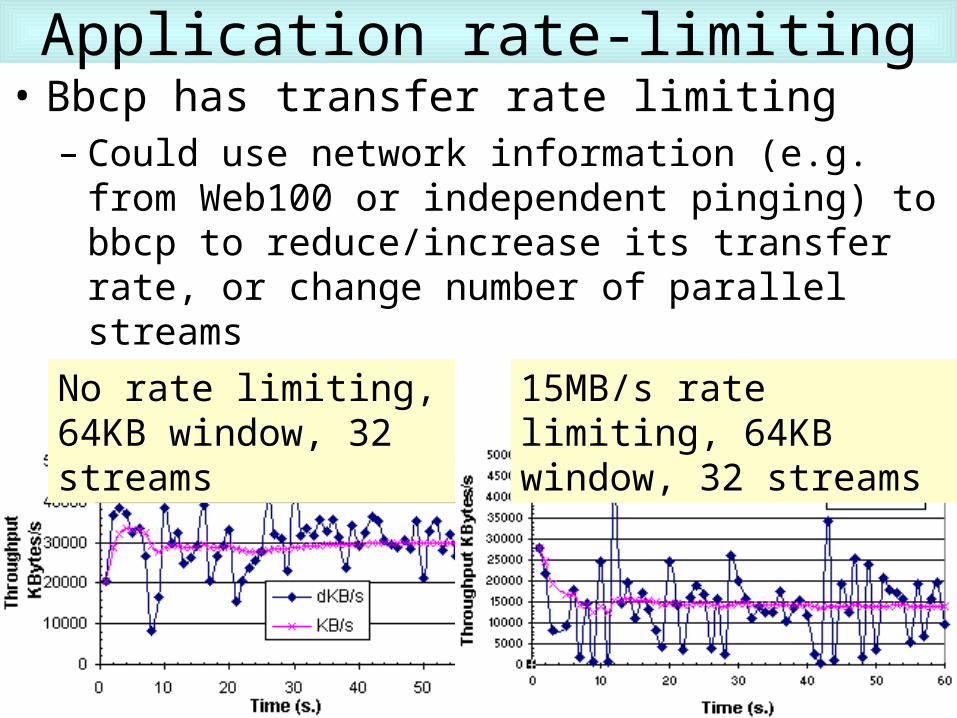
Application rate-limiting• Bbcp has transfer rate limiting
– Could use network information (e.g. from Web100 or independent pinging) to bbcp to reduce/increase its transfer rate, or change number of parallel streams
No rate limiting, 64KB window, 32 streams
15MB/s rate limiting, 64KB window, 32 streams

21
Typical QBSS test bed• Set up QBSS testbed
• Configure router interfaces– 3 traffic types:
• QBSS, BE, Priority
– Define policy, e.g.• QBSS > 1%, priority < 30%
– Apply policy to router interface queues
10Mbps
100Mbps
100Mbps
100Mbps
1Gbps
Cisco 7200s

22
Example of effects
•Also tried: 1 stream for all, and priority at 30%, 100 Mbps & 2 Gbps bottlenecks
•2Gbps challenge to saturate: did at SC2001, 3 Linux cpus with 5*1 Gbps NIC cards and 2 Gbps trunk from subnet to floor network, sending to 17 hosts in 5 countries
Kicks in fast (<~ 1 s)

23
Impact on response time (RTT)• Run ping with Iperf loading with various QoS
settings, iperf ~ 93Mbps– No iperf ping avg RTT ~ 300usec (regardless of QoS)– Iperf = QBSS, ping=BE or Priority: RTT~550usec
• 70% greater than unloaded
– Iperf=Ping QoS (exc. Priority) then RTT~5msec• > factor of 10 larger RTT than unloaded
– If both ping & iperf have QoS=Priority then ping RTT very variable since iperf limited to 30%
• RTT quick when iperf limited, long when iperf transmits

24
Possible HEP usage• Apply priority to lower volume interactive
voice/video-conferencing and real time control• Apply QBSS to high volume data replication• Leave the rest as Best Effort• Since 40-65% of bytes to/from SLAC come from a
single application, we have modified to enable setting of TOS bits
• Need to identify bottlenecks and implement QBSS there
• Bottlenecks tend to be at edges so hope to try with a few HEP sites

25
Acknowledgements for SC2001• Many people assisted in getting accounts, setting up servers,
providing advice, software etc.– Suresh Man Singh, Harvey Newman, Julian Bunn (Caltech), Andy
Hanushevsky, Paola Grosso, Gary Buhrmaster, Connie Logg (SLAC), Olivier Martin (CERN), Loric Totay, Jerome Bernier (IN2P3), Dantong Yu (BNL), Robin Tasker, Paul Kummer (DL), John Gordon (RL), Brian Tierney, Bob Jacobsen, (LBL), Stanislav Shalunov (Internet 2), Joe Izen (UT Dallas), Linda Winkler, Bill Allcock (ANL), Ruth Pordes, Frank Nagy (FNAL), Emanuele Leonardi (INFN), Chip Watson (JLab), Yukio Karita (KEK), Tom Dunigan (ORNL), John Gordon (RL), Andrew Daviel (TRIUMF), Paul Avery, Greg Goddard (UFL), Paul Barford, Miron Livny (UWisc), Shane Canon (NERSC), Andy Germain (NASA), Andrew Daviel (TRIUMF), Richard baraniuk, Rolf Reidi (Rice).

26
SC2001 Bandwidth Challenge/demo• Send data from SLAC/FNAL booth computers (emulate a
tier 0 or 1 HENP site) to over 20 other sites with good connections in about 6 countries– Throughputs from SLAC range from 3Mbps to > 300Mbps
• 2 Dell/Linux cpus + 2 GE NICs each, 1.4Gbps/cpu, plus 1 Dell with 1 GE NIC– Can get 980Mbits/s/cpu with jumbo frames
• Saturate 2Gbps connection to floor network• Got 1.6Mbits/s from booth to floor network• Apply QBSS to some sites, priority to a few and rest Best
Effort– See how QBSS works at high speeds
• Competing bulk throughput streams• Interactive low throughput streams, look at RTT with ping
27
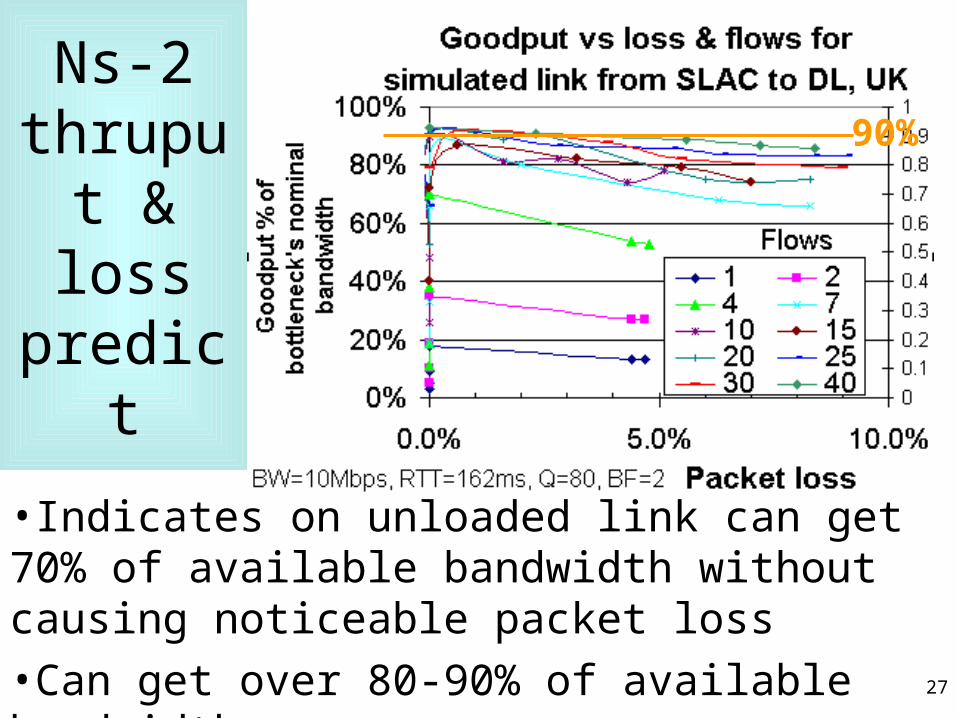
Ns-2 thruput & loss predict
•Indicates on unloaded link can get 70% of available bandwidth without causing noticeable packet loss
•Can get over 80-90% of available bandwidth
•Can overdrive: no extra throughput BUT extra loss
90%

28
WAN thruput conclusions• High FTP performance across WAN links is possible
–Can do 100s of Mbits/s–Even with 20-30Mbps bottleneck can do > 100Gbytes/day–Can easily saturate a fast Ethernet interface over WAN–Need GE NICs, > OC3 WANs to improve performance–Need high speed cpus, disks, buses–Careful attention to copies, buffering etc.
• Performance is improving• OS must support big windows selectable by application• Need multiple parallel streams in some cases
• Improvements of 5 to 60 in thruput by using multiple streams & larger windows
• Impacts others users, QBSS looks hopeful

29
More Information• IEPM/PingER home site:
– www-iepm.slac.stanford.edu/• Bulk throughput site:
– www-iepm.slac.stanford.edu/monitoring/bulk/• SC2001 & high throughput measurements
– www-iepm.slac.stanford.edu/monitoring/bulk/sc2001/• Transfer tools:
– http://dast.nlanr.net/Projects/Iperf/release.html– http://doc.in2p3.fr/bbftp/– www.slac.stanford.edu/~abh/bbcp/– http://hepwww.rl.ac.uk/Adye/talks/010402-ftp/html/sld015.htm
• TCP Tuning:– www.ncne.nlanr.net/training/presentations/tcp-tutorial.ppt– www-didc.lbl.gov/tcp-wan.html
• QBSS measurements– www-iepm.slac.stanford.edu/monitoring/qbss/measure.html