1. Name, Title and Contact Way of Company’s …. Name, Title and Contact Way of Company’s...
49
Transcript of 1. Name, Title and Contact Way of Company’s …. Name, Title and Contact Way of Company’s...

1. Name, Title and Contact Way of Company’s Spokesperson:
Principal Howard Chan CFO 886-2-2696-3131 [email protected]
Thomas Shin Head of Division 886-2-2696-3131 [email protected] Deputy Steven Wang Director 886-2-2509-2368 [email protected]
2. Address and Telephone Number of Company’s Headquarter, Branches and Factor
Office Address Tel Acer Inc. Registered Address
7F, No.137, Sec.2, Chien Kuo N. Road, Taipei, Taiwan, R.O.C.
886-2-2509-2368
Acer Inc. (Hsichih Office)
8F, 88, Sec.1, Hsin Tai Wu Road, Hsichih, Taipei Hsien, Taiwan, R.O.C.
886-2-2696-1234
Acer Inc. (Hsinchu Branch)
3-4F, 139 Min Tsu Road, Hsinchu, Taiwan, R.O.C.
886-3-533-9141
Acer Inc. (Taichung Branch)
3F, No.371, Sec.1, Wen-Hsin Road, Taichung, Taiwan, R.O.C.
886-4-2250-3355
Acer Inc. (Kaohsiung Branch)
4F-2, 38, Shin Guang Road, Kaohsiung, Taiwan, R.O.C.
886-7-338-8386
3. The Address and Contact Way of Acer Shareholders Services Office
Address :7F, No.137, Sec.2, Chien Kuo N. Road, Taipei, Taiwan, R.O.C. Tel :886-2-2509-2368 e-mail : [email protected]
4. The Address and Contact way of Auditing CPA in the Most Recent Year Name : Winston Yu and Albert Lou at KPMT Address : 68F, TAIPEI 101 TOWER, No.7, Rec 5, Xinyi Road, Taipei, 11049
Taiwan, R.O.C. Tel : 886-2-8101-6666 e-mail : www.kpmg.com.tw
5. The market location for GDRs and the Web Page, via which you may inquire the
relevant information, is: www.Londonstockexchange.com
6. Acer Website: www.acer.com

INDEX 1. Business Report to Shareholders
1.1 2006 Operating Report ................................................................................................ 3 1.2 2007 Business Plan...................................................................................................... 3
2.Company In General 2.1 Brief Account of the Company.................................................................................... 5
3. The Corporate Governance Reports 3.1 The Organization of the Company ................................................................................ 9 3.2 Information of Board of Directors, Supervisors and Key Managers .......................... 11 3.3 The Enforcement of Corporate Governance/ Discrcpancy between the Corporate
Govermance Principles Implemented by the Company and the Principles, and the Reasons for the Discrepancy ....................................................................................... 15
3.4 Internal Control System Execution Statement ............................................................ 18
4. Capital and Shares 4.1 Sources of the Capital………………………………………………………………..19
4.2 The Secured Corporate Bonds in Taiwan···································································23 4.3 Special Shares ............................................................................................................. 23 4.4 GDR Issuance.............................................................................................................. 23 4.5 Employee Stock Options ............................................................................................. 23
4.6 Mergers, Acquisitions, and Issuance of New Shares Due to Acquisition of Shares of Other Companies ·······················································································23
5. Business Description 5.1 Business Contents ....................................................................................................... 24 5.2 Market and Continuous Growth.................................................................................. 27
5.3 Employee Statistics for Most Recent Two Years and up to 2007.03.31 ·····················31 5.4 Environmental Protection Measures ........................................................................... 31
6. Financial Standing 6.1 Most Recent 5-Year Concise Financial Information ................................................... 33 6.2 Most Recent 5-Year Financial Analysis ...................................................................... 35 6.3 Audit Report of Supervisor ......................................................................................... 37 6.4 Financial Statements Consolidated With Subsidiaries Audited by CPA of the
Recent Year ................................................................................................................ 38 6.5 Disclosure the Impact on the Company’s Financial Status if the Company or
Affiliates Have Financial Difficulties in Recent Year and Cut Off by the Published Date of the Annual Report ........................................................................ 85
6.6 The Achievement of the Financial Prediction during the Most Recent Two Years..... 85

7. Risk Management 7.1 Recent Yearly Investment Policy and Main Reasons of Gain or Loss and Plan
of Improvement for the Next Year .............................................................................. 87 7.2 Items to be Noticed for Risk Management & Evaluation ........................................... 88

-1-
1. Business Report to Shareholders Acer was faced with intense competition from the top PC players in 2006, yet in spite of this, Acer Inc. consolidated revenues reached NT$ NT$369.09B (US$11.32B), up 16% from the previous year and reached 92.3% of the annual target; while our profit after tax (PAT) of NT$10.22B (US$313.47M) and earning per share (EPS) of NT$4.45 both hit targets. In addition, operating income of NT$7.81B (US$239.66B) exceeded on the previous year and hit 72.5% of target. Although the PC industry’s intense price competition directly influenced Acer’s revenue and operating income, we still achieved significantly higher growth rates than the industry’s major players. Acer endured a tough period and has emerged winning, proving once again that our business model is adaptable to volatile market changes. Hence, we are confident in securing the No. 3 global PC ranking during the course of 2007. In 2006, the Acer brand business achieved commendable growth around the world. For global PC unit shipment, Acer retained the No. 4 position for Total PCs, rose to become the No. 3 notebook, and grew significantly for desktop PCs to rank at No. 4; all with highest growth rates among the top five vendors. For LCD monitors, Acer also maintained the No. 4 position. Regionally, in EMEA (Europe, Middle East and Africa) Acer ranked No. 3 for Total PCs and stood firmly as the No. 1 notebook brand. In Asia Pacific, Acer notebooks obtained No. 1 ranking across five countries. In the target growth markets, our growths in the U.S. for notebook, desktop and Total PCs were the highest among the top ten vendors; and in China we climbed to the top five for notebooks. Over the recent years, Acer has established an effective business model; this sustainable and evolutionary channel business model has laid the foundation for our growth and profitability forward. In fact, the PC industry’s channel model has gradually become mainstream practice to share equal presence with the direct model. We expect the channel model will continue to expand, with Acer staying committed to our channel partners. Acer has set itself clear goals for 2007: aim for better balance of revenue contribution from our regional operations; establish distinct product differentiation to satisfy commercial and consumer customer needs; build closer ties with key component suppliers; lower operating expenditure percentage while company grows; and develop the LCD TV and new handheld PC devices. Acer shall persist in researching and developing Empowering Technology that
-2-
enables our customers to truly benefit from technology. Year 2006 was the thirtieth anniversary of the company founding and represented a major accomplishment. In 2007, we are confident in setting another milestone by becoming a world top-three PC brand. On behalf of all Acer employees, I wish to thank all our shareholders for your unrelenting support and guidance. Together, Acer shall continue to advance in the global PC market.
J.T. Wang
Chairman and CEO
-3-
1.1 2006 Operating Report
1.1.1 Operating results:
The 2006 consolidated revenue reached NT$ 369.09B, with operating income of NT$
7.81B and profit after tax of NT$ 10.22B. The earning per share was NT$ 4.45 per
share.
1.1.2 Hit Rate:
The hit rate of the 2006 revenue was 92.3%, while the hit rate of the operating income
was 72.5% and the profit after tax exceeded the target by 2.2%.
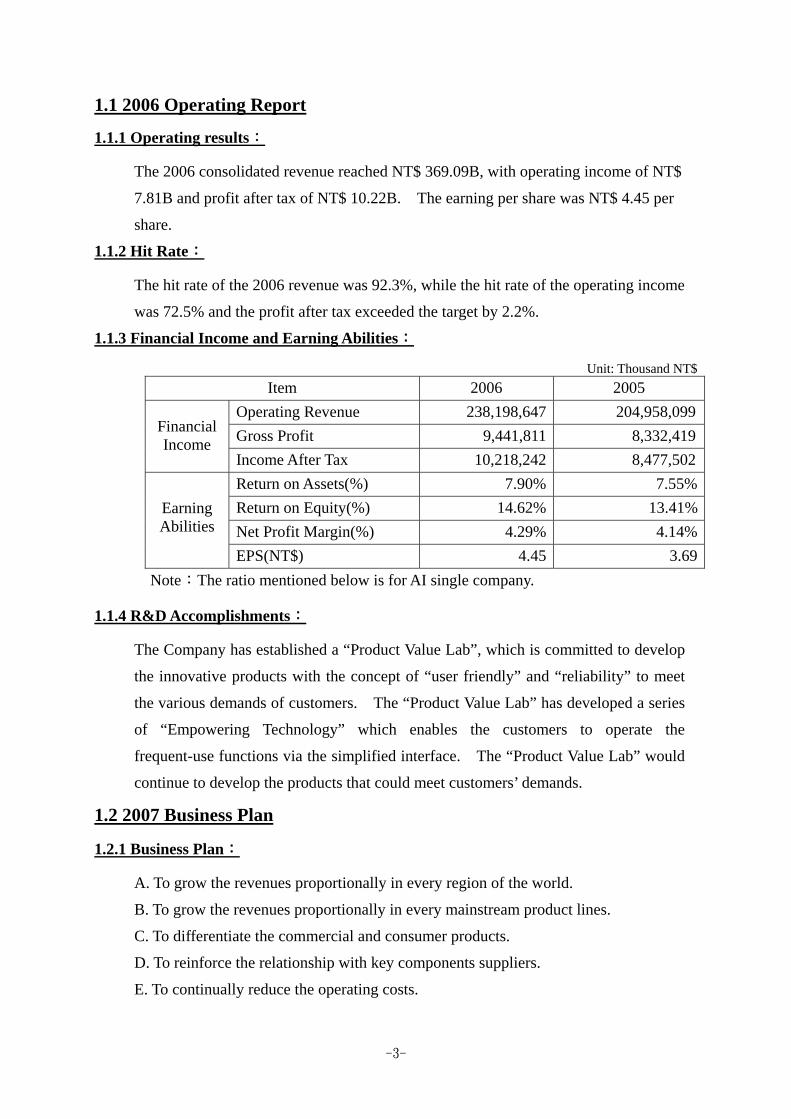
1.1.3 Financial Income and Earning Abilities:
Unit: Thousand NT$ Item 2006 2005
Operating Revenue 238,198,647 204,958,099Gross Profit 9,441,811 8,332,419Financial
Income Income After Tax 10,218,242 8,477,502Return on Assets(%) 7.90% 7.55%Return on Equity(%) 14.62% 13.41%Net Profit Margin(%) 4.29% 4.14%
Earning Abilities
EPS(NT$) 4.45 3.69 Note:The ratio mentioned below is for AI single company.
1.1.4 R&D Accomplishments:
The Company has established a “Product Value Lab”, which is committed to develop
the innovative products with the concept of “user friendly” and “reliability” to meet
the various demands of customers. The “Product Value Lab” has developed a series
of “Empowering Technology” which enables the customers to operate the
frequent-use functions via the simplified interface. The “Product Value Lab” would
continue to develop the products that could meet customers’ demands.
1.2 2007 Business Plan
1.2.1 Business Plan:
A. To grow the revenues proportionally in every region of the world.
B. To grow the revenues proportionally in every mainstream product lines.
C. To differentiate the commercial and consumer products.
D. To reinforce the relationship with key components suppliers.
E. To continually reduce the operating costs.
-4-
1.2.2 Performance Targets:
A. To grow toward to become the No. 3 PC global player.
B. To expand the key markets such as US, China etc.
C. To augment the contributions from segments of desktop and LCD TV.
1.2.3 Marketing Strategy:
A. To collaborate with the first-tier suppliers and distributors.
B. To fully utilize the resources of partners.
C. To share the growth with partners and enjoy the win-win benefits.
1.2.4 Strategy:
The Company would make every endeavor to pursue the strategy of growth.
A. To maintain the channel business model and continually to improve the efficiency.
B. To contribute in satablizing the industry order of global PC market.
C. To continually focus on the core business – branding business
D. To bear the corporate social responsibility.
1.2.5 The impact to the Company due to industry competitiveness, governmental
regulations and overall macro market:
A. The declining trend of the average selling price of personal computer is unavoidable.
B. The overall worldwide PC market is expected to grow modestly in 2007.
-5-
2. Company In General
2.1 Brief Account of the Company 2.1.1 Founded: August 1st, 1976 1976 – 1986: Commercialized microprocessor technology 1987 – 1995: Created a brand name and went global 1996 – 2000: Fresh technology for everyone, everywhere 2001 – beyond: Transformed from manufacturing to services 1976
• Acer was founded under the name Multitech, focusing on trade and product design 1978
• Acer established the Microprocessor Training Centre, training 3,000 engineers for Taiwan's information industry
1979
• Acer designed Taiwan's first mass-produced computer for export 1981
• Acer manufacturing operations were established in the Hsinchu Science-based Industrial Park, Taiwan
• MicroProfessor-I debuted as Acer's first branded product 1982
• MicroProfessor-II was unveiled as Taiwan's first 8-bit home computer 1983
• Acer was the first company to promote 16-bit PC products in Taiwan 1984
• Acer Peripherals, Inc. (now BenQ Corp.) and Multiventure Investments, Inc. were established
1985
• AcerLand, Taiwan's first and largest franchised computer retail chain was founded 1986
• Acer beat IBM with 32-bit PCs
-6-
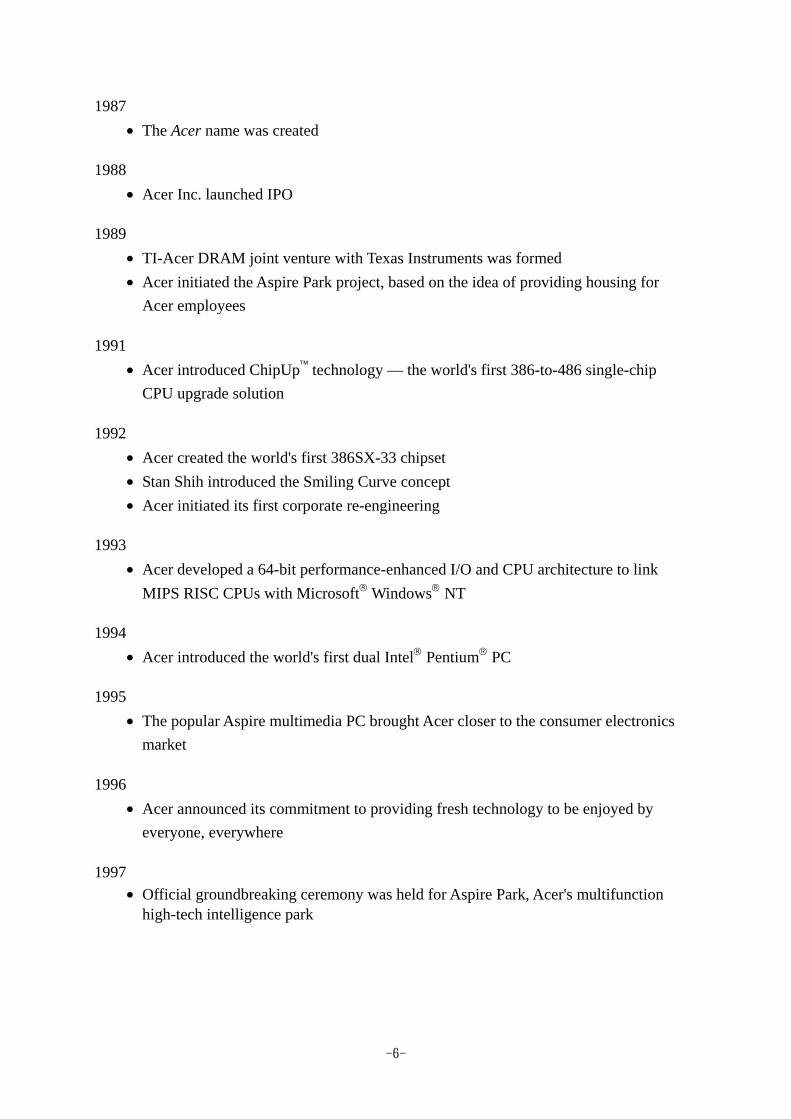
1987 • The Acer name was created
1988
• Acer Inc. launched IPO 1989
• TI-Acer DRAM joint venture with Texas Instruments was formed • Acer initiated the Aspire Park project, based on the idea of providing housing for
Acer employees 1991
• Acer introduced ChipUp™ technology — the world's first 386-to-486 single-chip CPU upgrade solution
1992
• Acer created the world's first 386SX-33 chipset • Stan Shih introduced the Smiling Curve concept • Acer initiated its first corporate re-engineering
1993
• Acer developed a 64-bit performance-enhanced I/O and CPU architecture to link MIPS RISC CPUs with Microsoft® Windows® NT
1994
• Acer introduced the world's first dual Intel® Pentium® PC 1995
• The popular Aspire multimedia PC brought Acer closer to the consumer electronics market
1996
• Acer announced its commitment to providing fresh technology to be enjoyed by everyone, everywhere
1997
• Official groundbreaking ceremony was held for Aspire Park, Acer's multifunction high-tech intelligence park
-7-
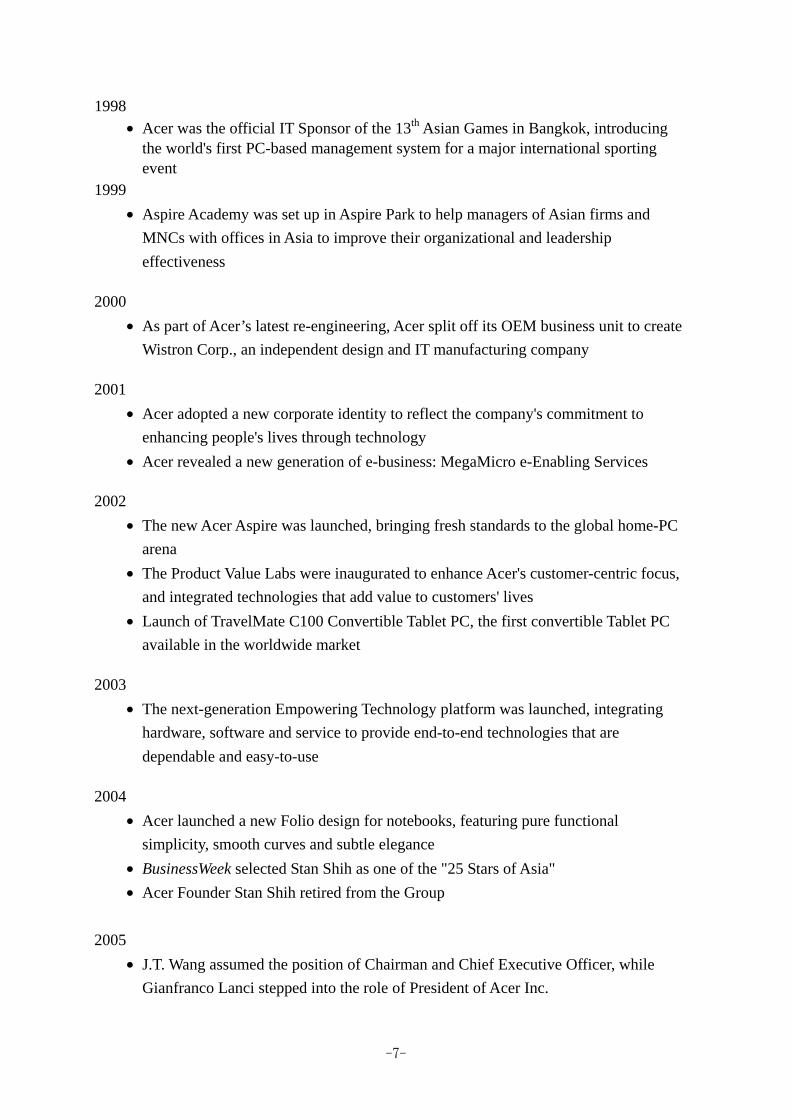
1998 • Acer was the official IT Sponsor of the 13th Asian Games in Bangkok, introducing
the world's first PC-based management system for a major international sporting event
1999 • Aspire Academy was set up in Aspire Park to help managers of Asian firms and
MNCs with offices in Asia to improve their organizational and leadership effectiveness
2000
• As part of Acer’s latest re-engineering, Acer split off its OEM business unit to create Wistron Corp., an independent design and IT manufacturing company
2001
• Acer adopted a new corporate identity to reflect the company's commitment to enhancing people's lives through technology
• Acer revealed a new generation of e-business: MegaMicro e-Enabling Services 2002
• The new Acer Aspire was launched, bringing fresh standards to the global home-PC arena
• The Product Value Labs were inaugurated to enhance Acer's customer-centric focus, and integrated technologies that add value to customers' lives
• Launch of TravelMate C100 Convertible Tablet PC, the first convertible Tablet PC available in the worldwide market
2003
• The next-generation Empowering Technology platform was launched, integrating hardware, software and service to provide end-to-end technologies that are dependable and easy-to-use
2004
• Acer launched a new Folio design for notebooks, featuring pure functional simplicity, smooth curves and subtle elegance
• BusinessWeek selected Stan Shih as one of the "25 Stars of Asia" • Acer Founder Stan Shih retired from the Group
2005 • J.T. Wang assumed the position of Chairman and Chief Executive Officer, while
Gianfranco Lanci stepped into the role of President of Acer Inc.
-8-
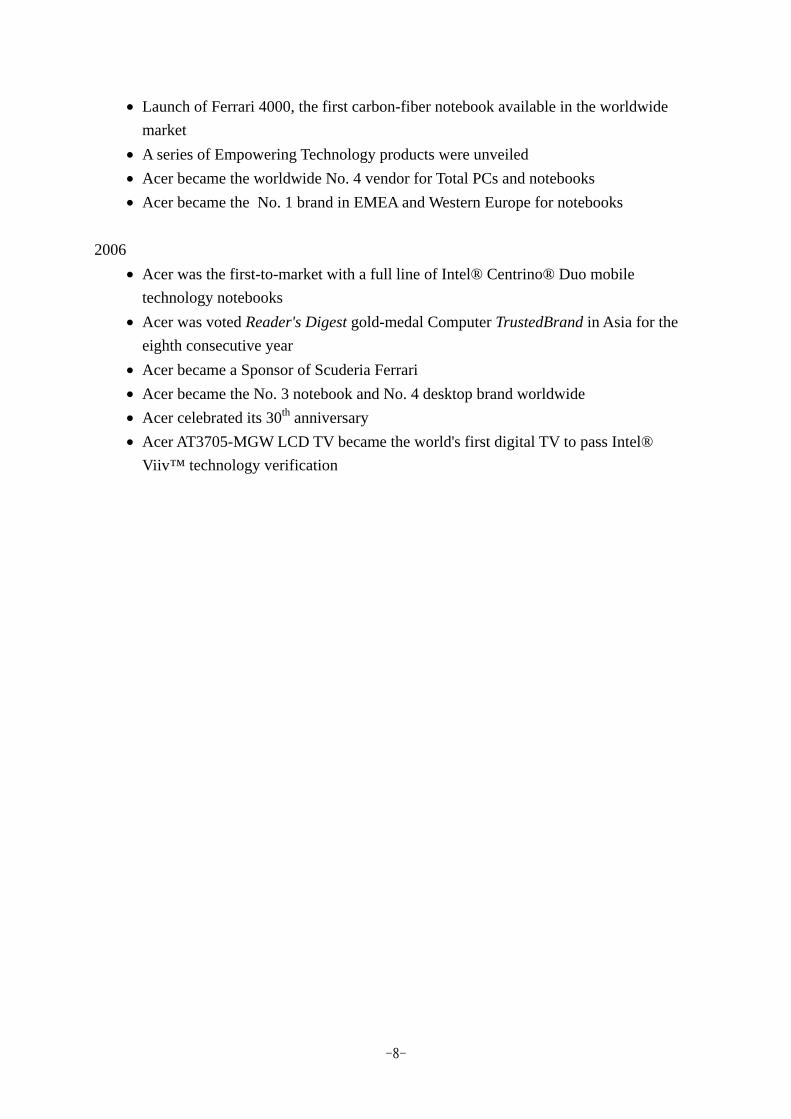
• Launch of Ferrari 4000, the first carbon-fiber notebook available in the worldwide market
• A series of Empowering Technology products were unveiled • Acer became the worldwide No. 4 vendor for Total PCs and notebooks • Acer became the No. 1 brand in EMEA and Western Europe for notebooks
2006
• Acer was the first-to-market with a full line of Intel® Centrino® Duo mobile technology notebooks
• Acer was voted Reader's Digest gold-medal Computer TrustedBrand in Asia for the eighth consecutive year
• Acer became a Sponsor of Scuderia Ferrari • Acer became the No. 3 notebook and No. 4 desktop brand worldwide • Acer celebrated its 30th anniversary • Acer AT3705-MGW LCD TV became the world's first digital TV to pass Intel®
Viiv™ technology verification

-9-
3. The Corporate Governance Reports 3.1 The Organization of the Company
3.1.1 Organization Chart and Department Function (1) Acer Organization Chart
Corp. President
Chairman & CEO
LegalHuman Resources Branding Information
TechnologyGeneral Affairs
Acer Organization Chart
Finance
e-EnablingServices Business
Europe, Middle East & Africa Operations
Asian Pacific Operations
Taiwan Operations
Pan AmericaOperations
Chief Financial Officer
IT ProductsBusiness
Channel Business
China Operations
Value Labs
Board of Directors
Shareholders’Meeting
Supervisor
Corporate Strategy Office
General Auditor
-10-
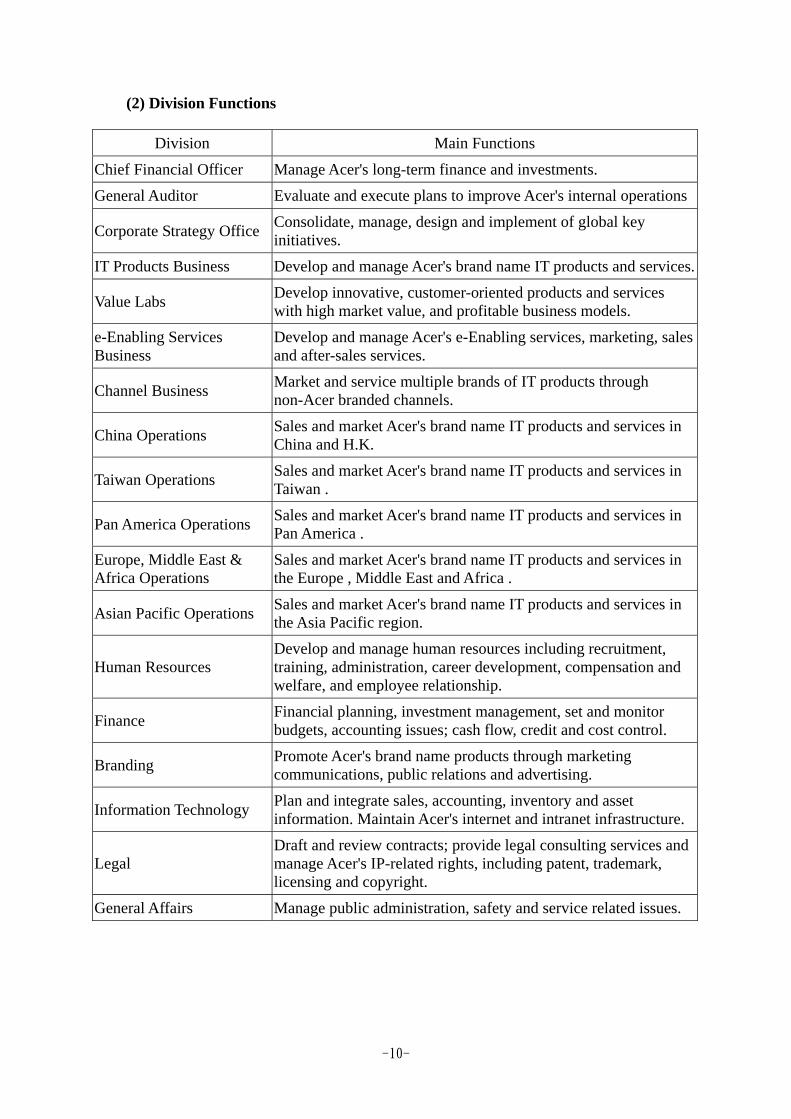
(2) Division Functions
Division Main Functions
Chief Financial Officer Manage Acer's long-term finance and investments. General Auditor Evaluate and execute plans to improve Acer's internal operations
Corporate Strategy Office Consolidate, manage, design and implement of global key initiatives.
IT Products Business Develop and manage Acer's brand name IT products and services.
Value Labs Develop innovative, customer-oriented products and services with high market value, and profitable business models.
e-Enabling Services Business
Develop and manage Acer's e-Enabling services, marketing, sales and after-sales services.
Channel Business Market and service multiple brands of IT products through non-Acer branded channels.
China Operations Sales and market Acer's brand name IT products and services in China and H.K.
Taiwan Operations Sales and market Acer's brand name IT products and services in Taiwan .
Pan America Operations Sales and market Acer's brand name IT products and services in Pan America .
Europe, Middle East & Africa Operations
Sales and market Acer's brand name IT products and services in the Europe , Middle East and Africa .
Asian Pacific Operations Sales and market Acer's brand name IT products and services in the Asia Pacific region.
Human Resources Develop and manage human resources including recruitment, training, administration, career development, compensation and welfare, and employee relationship.
Finance Financial planning, investment management, set and monitor budgets, accounting issues; cash flow, credit and cost control.
Branding Promote Acer's brand name products through marketing communications, public relations and advertising.
Information Technology Plan and integrate sales, accounting, inventory and asset information. Maintain Acer's internet and intranet infrastructure.
Legal Draft and review contracts; provide legal consulting services and manage Acer's IP-related rights, including patent, trademark, licensing and copyright.
General Affairs Manage public administration, safety and service related issues.

-11-
3.2 Information of Board of Directors, Supervisors and Key Managers (1)Board of Directors and Supervisors (Mar. 31, 2007)
Shares Held When Elected
Shares Held by Current Shareholding
Shares Held by Spouse & Minors
Whose Spouse or Kinship within 2 Degrees holds a position as the Key Managers, Directors or Supervisors Title Name
Date of
Election
Term (yrs)
Number Percentage Number Percentage Number Percentage
Education Main Curriculum Vitae
Title Name Relation- ship
Chairman J.T. Wang 06/14/2005 3 5,212,666 0.25 9,175,932 0.29 198,521 - Bachelor
Chairman of HiTRUST.COM Inc. Chairman of Lottery Technology Services Corp.Director of E-life Mall Corp.Director of TWP Corporation Chairman of Acer Cyber Center Services Ltd. Director of Digital Computer System Co., Ltd.Director of Minly Corp. Director of Weblink International Inc. Chairman of Acer Digital Service Co.,
- - -
Director Stan Shih 06/14/2005 3 43,794,001 2.09 47,350,073 2.03 9,000,698 0.39 Master
Director of Dragon Investment Co., Ltd. Director of BenQ Corp. Director of Wistron Corp. Director of TSMC Co, LTD.Director of Acer SoftCapital Inc. Director of Acer Worldwide Inc.
Supervisor Carolyn Yeh Wife
Director Gianfranco Lanci 06/14/2005 3 - - 153,720 - - - Bachelor - - - - Director Jim Wong 06/14/2005 3 1,712,318 0.08 2,682,957 0.11 - - Master - - - - Director Pier Carlo Falotti 06/14/2005 3 - - - - - - Bachelor - - - -
Director
Philip Peng (The representative of Smart Capital Corp.)
06/14/2005 3 10,000 - 10,812 - - - Master
Supervisor of BenQ Corp Supervisor of Wistron Corp.Supervisor of Apacer Technology Inc. Director of Id SoftCapital Inc. Supervisor of Dragon Investment Co., Ltd.
- - -

-12-
Shares Held When Elected
Shares Held by Current Shareholding
Shares Held by Spouse & Minors
Whose Spouse or Kinship within 2 Degrees holds a position as the Key Managers, Directors or Supervisors Title Name
Date of
Election
Term (yrs)
Number Percentage Number Percentage Number Percentage
Education Main Curriculum Vitae
Title Name Relation- ship
Director
Yen-Liang Yin(The representative of Hung Rouan Investment Corp.)
06/14/2005 3 60,204,788 2.88 65,093,415 2.79 - - PhD Chairman of Anshin card Services - - -
Supervisor George Huang 06/14/2005 3 7,560,437 0.36 6,011,943 0.26 2,420,882 0.10 Bachelor
Director of Apacer Technology Inc. Director of Lottery Technology Services Corp.Chairman of EB-Easy Director of SYNQ Technology Inc. Chairman of CTS Digi-Tech Co.,Ltd Vice-Chairman of Taiwan Fixed Network Co., Ltd. Supervisor of TFN Investment Co.,Ltd Vice-Chairman of Taiwan Hong Yuan Investment Co.,Ltd
- - -
Supervisor Carolyn Yeh 06/14/2005 3 8,324,731 0.41 9,000,698 0.39 47,350,073 2.03 Bachelor
Chairman of Id SoftCapital Inc. Supervisor of Acer Capital Corp.
Director Stan Shih Hasband
Major Institutional Shareholders (Mar. 31, 2007)
Name Name of Major Shareholders
Hung Rouan Investment Corp. Carolyn Yeh, Shih Hsuen Rong, Stans Fundation, Shih Hsuen Huei, Shih Hsuen Lin, Shih Fang Cheng, Yeh Ting Yu, Shih Hsuen Long.
Smart Capital Corp. Philip Peng, Jill Ho.

-13-
(2)Key Managers (Mar. 31, 2007)
Shares Held DirectlyShares Held by Spouse &
Minor
Other President or VP who is
the Spouse or Kinship Within 2
Degrees
Title
Name
Date of
Assuming
Office Number Percentage Number Percentage
Degree Main Curriculum Vitae
Title Name Relationship
President Gianfranco
Lanci 01/01/2005 153,720 - - - Bachelor - - - -
Vice President T.Y Lay 11/01/2001 2,331,948 0.10 15,569 - Bachelor - - - -
Vice President Scott Lin 11/01/2001 705,884 0.03 7,291 - Bachelor
Chairman of Minly Corp.
Director of Digital Computer System Co,
LTD.
- - -
Vice President Ben Wan 05/16/2002 175,173 - - - Master Director of Acer Cyber Center Services Inc.
Chairman of TWP Corp. - - -
Vice President Jim Wong 11/01/2001 2,682,957 0.11 - - Master - - - -
Vice PresidentJames
Chiang 01/01/2002 1,730,065 0.07 21,301 - Bachelor
Chairman of Weblink International Inc.
Director of TWP Corp.
Director of Lottery Technology Services
Corp.
Chairman of Sertek Inc.
Chairman of Digital Computer System Co.,
Ltd.
Director of Minly Corp.
- - -
Vice President Steve Lin 11/01/2001 2,118,584 0.09 - - Bachelor - - - -
Vice President Peter Shieh 11/01/2001 760,679 0.03 75,261 - Bachelor - - - -
Vice PresidentWinston
Fong 09/01/2002 - - - - Master - - - -
Vice PresidentAngelina
Hwang 09/01/2001 282,257 0.01 8,631 - Bachelor - - - -
Vice President Jackson Lin 16/02/2004 468,005 0.02 2,185 - Bachelor - - - -

-14-
Shares Held DirectlyShares Held by Spouse &
Minor
Other President or VP who is
the Spouse or Kinship Within 2
Degrees
Title
Name
Date of
Assuming
Office Number Percentage Number Percentage
Degree Main Curriculum Vitae
Title Name Relationship
Vice PresidentDennis
Chiang 11/04/2002 - - - - Master - - - -
Vice President
V.P
CFO
Howard
Chan 01/19/2000 656,398 0.03 20,604 - Master
Director of Acer Digital Service Co.,
Director of Cross Centry Investment
Limited.
Director of Multiventure Investment Inc.
- - -
Vice PresidentCalvin
Chang 11/01/2001 141,332 - - - Bachelor - - - -
Vice President Jafa Lin 07/01/1996 254,290 0.01 - - Bachelor - - - -
Head of
Corporate
Finance
Grace Lung 05/01/2004 51,250 - - - Bachelor
Supervisor of Acer Property Development
Inc.
Supervisor of Acer Digital Service Co.,
Supervisor of Multiventure Investment Inc.
Supervisor of EB EASY (TWN) Corp.
- - -
Note. Winston Fong and Dennis Chiang had resigned.
-15-
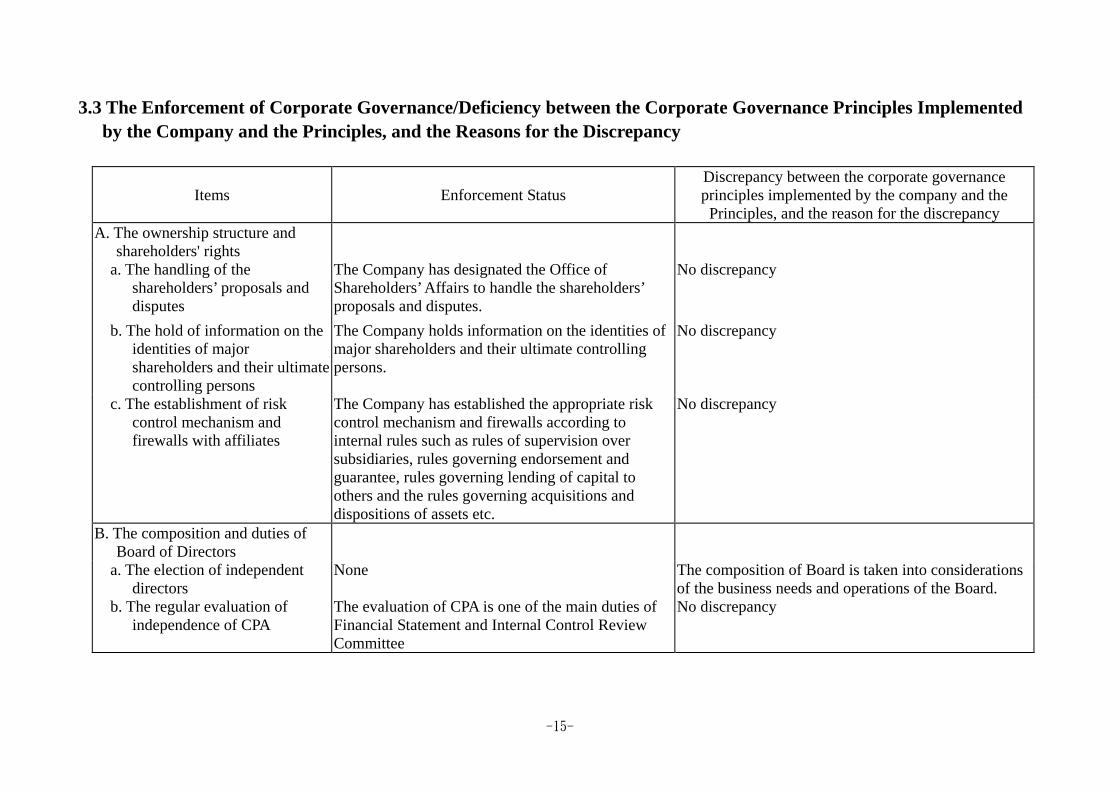
3.3 The Enforcement of Corporate Governance/Deficiency between the Corporate Governance Principles Implemented by the Company and the Principles, and the Reasons for the Discrepancy
Items Enforcement Status Discrepancy between the corporate governance principles implemented by the company and the
Principles, and the reason for the discrepancy A. The ownership structure and
shareholders' rights
a. The handling of the shareholders’ proposals and disputes
The Company has designated the Office of Shareholders’ Affairs to handle the shareholders’ proposals and disputes.
No discrepancy
b. The hold of information on the identities of major shareholders and their ultimate controlling persons
The Company holds information on the identities of major shareholders and their ultimate controlling persons.
No discrepancy
c. The establishment of risk control mechanism and firewalls with affiliates
The Company has established the appropriate risk control mechanism and firewalls according to internal rules such as rules of supervision over subsidiaries, rules governing endorsement and guarantee, rules governing lending of capital to others and the rules governing acquisitions and dispositions of assets etc.
No discrepancy
B. The composition and duties of Board of Directors
a. The election of independent directors
None The composition of Board is taken into considerations of the business needs and operations of the Board.
b. The regular evaluation of independence of CPA
The evaluation of CPA is one of the main duties of Financial Statement and Internal Control Review Committee
No discrepancy
-16-
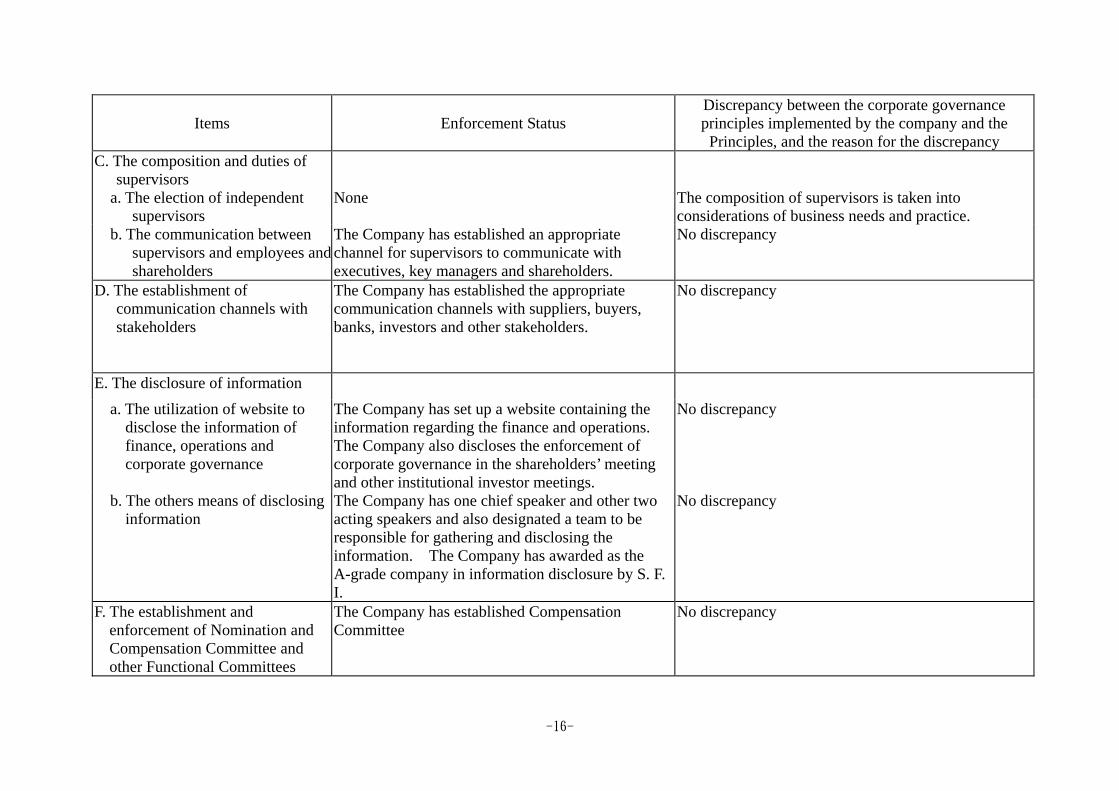
Items Enforcement Status Discrepancy between the corporate governance principles implemented by the company and the
Principles, and the reason for the discrepancy C. The composition and duties of
supervisors
a. The election of independent supervisors
None The composition of supervisors is taken into considerations of business needs and practice.
b. The communication between supervisors and employees andshareholders
The Company has established an appropriate channel for supervisors to communicate with executives, key managers and shareholders.
No discrepancy
D. The establishment of communication channels with stakeholders
The Company has established the appropriate communication channels with suppliers, buyers, banks, investors and other stakeholders.
No discrepancy
E. The disclosure of information a. The utilization of website to
disclose the information of finance, operations and corporate governance
The Company has set up a website containing the information regarding the finance and operations. The Company also discloses the enforcement of corporate governance in the shareholders’ meeting and other institutional investor meetings.
No discrepancy
b. The others means of disclosing information
The Company has one chief speaker and other two acting speakers and also designated a team to be responsible for gathering and disclosing the information. The Company has awarded as the A-grade company in information disclosure by S. F. I.
No discrepancy
F. The establishment and enforcement of Nomination and Compensation Committee and other Functional Committees
The Company has established Compensation Committee
No discrepancy

-17-
Items Enforcement Status Discrepancy between the corporate governance principles implemented by the company and the
Principles, and the reason for the discrepancy G. If the Company has implemented the corporate governance principles according to TSE Corporate Governance Best-Practice Principles, please
identify the discrepancy between your principles and their implementation: Not applicable H. The systems, action plans and implementation of the Company’s social responsibility(e.g. human rights, employees’ rights, environmental
protection, community supports and involvements, social responsibility, the relationship with supplies, and interested parties’ rights): The Company has actively participated community activities or charitable such as:
1. sponsoring the sport and literature/arts events, 2. sponsoring Council of Agriculture for Production Resume Scheme in order to assist with using IT products in the remote districts. 3. organizing Acer Volunteer to take good care of the disadvantaged children.
The BVQI has awarded the Company with the ISO 14001 registration, further, Acer’s Eco organization was adjusted to be responsible for overseeing the Company worldwide Eco strategy, and monitoring the results of the Eco management system. The Company has also set up an exclusive e-mail box ([email protected]), environmental web, and published Corporate Environmental Report.
The Company has set up an exclusive web site for new labor pension system in order to offer employees related laws, regulations, and assistance.
I. Other important information that may facilitate to better understand the status of corporate governance: In additional to the training courses required by authority, the Company also arranged related training courses for members of the board to
participate.. The Company clearly sets forth in the rules for the proceedings of board meetings that a director shall voluntarily abstain from voting on a
proposal involved with his/her own interests. The chairman of the Company does not act as the President, and both of them are not spouses or relatives within one degree of kinship. The Company has purchased liability insurance for directors and officers.
-18-
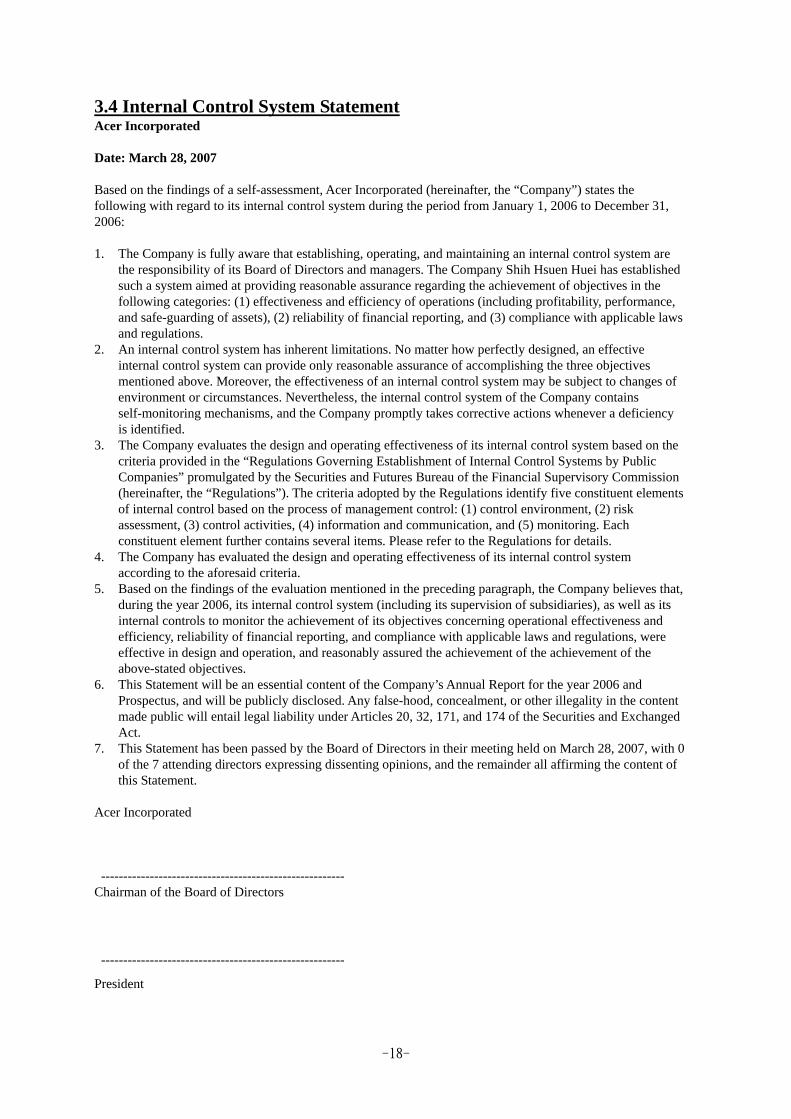
3.4 Internal Control System Statement Acer Incorporated Date: March 28, 2007 Based on the findings of a self-assessment, Acer Incorporated (hereinafter, the “Company”) states the following with regard to its internal control system during the period from January 1, 2006 to December 31, 2006: 1. The Company is fully aware that establishing, operating, and maintaining an internal control system are
the responsibility of its Board of Directors and managers. The Company Shih Hsuen Huei has established such a system aimed at providing reasonable assurance regarding the achievement of objectives in the following categories: (1) effectiveness and efficiency of operations (including profitability, performance, and safe-guarding of assets), (2) reliability of financial reporting, and (3) compliance with applicable laws and regulations.
2. An internal control system has inherent limitations. No matter how perfectly designed, an effective internal control system can provide only reasonable assurance of accomplishing the three objectives mentioned above. Moreover, the effectiveness of an internal control system may be subject to changes of environment or circumstances. Nevertheless, the internal control system of the Company contains self-monitoring mechanisms, and the Company promptly takes corrective actions whenever a deficiency is identified.
3. The Company evaluates the design and operating effectiveness of its internal control system based on the criteria provided in the “Regulations Governing Establishment of Internal Control Systems by Public Companies” promulgated by the Securities and Futures Bureau of the Financial Supervisory Commission (hereinafter, the “Regulations”). The criteria adopted by the Regulations identify five constituent elements of internal control based on the process of management control: (1) control environment, (2) risk assessment, (3) control activities, (4) information and communication, and (5) monitoring. Each constituent element further contains several items. Please refer to the Regulations for details.
4. The Company has evaluated the design and operating effectiveness of its internal control system according to the aforesaid criteria.
5. Based on the findings of the evaluation mentioned in the preceding paragraph, the Company believes that, during the year 2006, its internal control system (including its supervision of subsidiaries), as well as its internal controls to monitor the achievement of its objectives concerning operational effectiveness and efficiency, reliability of financial reporting, and compliance with applicable laws and regulations, were effective in design and operation, and reasonably assured the achievement of the achievement of the above-stated objectives.
6. This Statement will be an essential content of the Company’s Annual Report for the year 2006 and Prospectus, and will be publicly disclosed. Any false-hood, concealment, or other illegality in the content made public will entail legal liability under Articles 20, 32, 171, and 174 of the Securities and Exchanged Act.
7. This Statement has been passed by the Board of Directors in their meeting held on March 28, 2007, with 0 of the 7 attending directors expressing dissenting opinions, and the remainder all affirming the content of this Statement.
Acer Incorporated ------------------------------------------------------- Chairman of the Board of Directors
-------------------------------------------------------
President
-19-
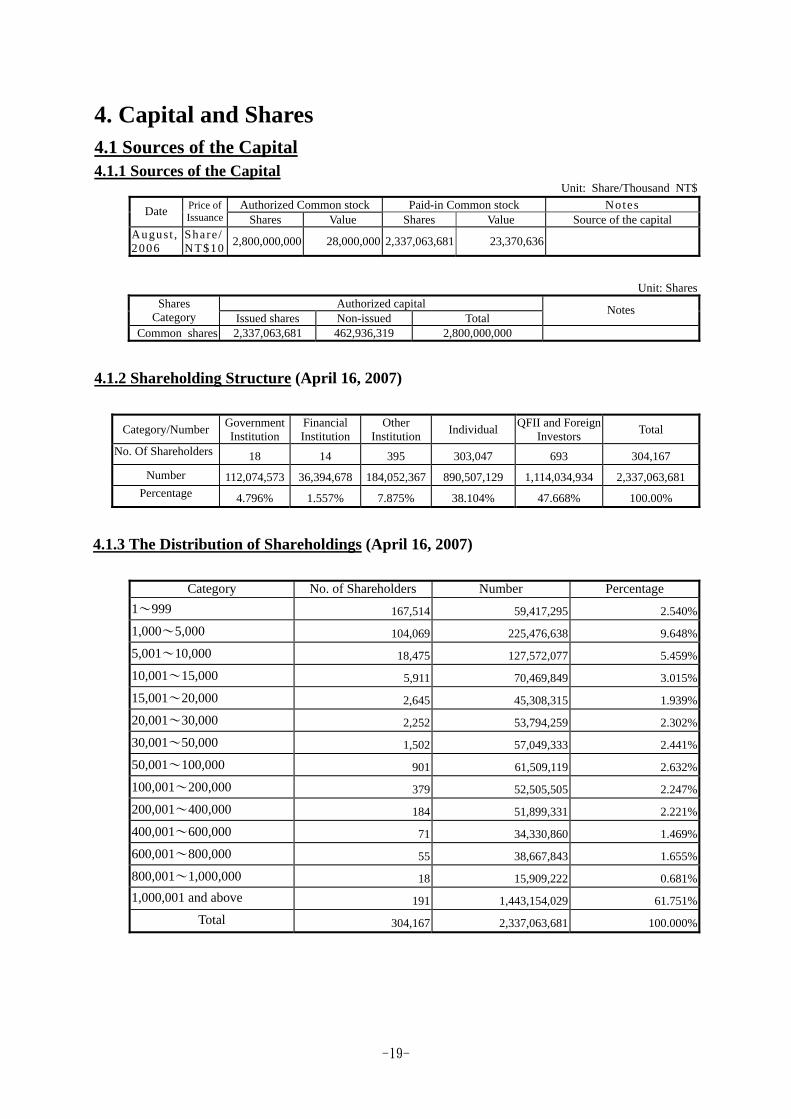
4. Capital and Shares 4.1 Sources of the Capital 4.1.1 Sources of the Capital
Unit: Share/Thousand NT$ Authorized Common stock Paid-in Common stock Notes Date Price of
Issuance Shares Value Shares Value Source of the capital August , 2006
Share /NT$10 2,800,000,000 28,000,000 2,337,063,681 23,370,636
Unit: Shares
Authorized capital Shares Category Issued shares Non-issued Total
Notes
Common shares 2,337,063,681 462,936,319 2,800,000,000
4.1.2 Shareholding Structure (April 16, 2007)
Category/Number Government Institution
Financial Institution
Other Institution Individual QFII and Foreign
Investors Total
No. Of Shareholders 18 14 395 303,047 693 304,167 Number 112,074,573 36,394,678 184,052,367 890,507,129 1,114,034,934 2,337,063,681
Percentage 4.796% 1.557% 7.875% 38.104% 47.668% 100.00%
4.1.3 The Distribution of Shareholdings (April 16, 2007)
Category No. of Shareholders Number Percentage 1~999 167,514 59,417,295 2.540%
1,000~5,000 104,069 225,476,638 9.648%
5,001~10,000 18,475 127,572,077 5.459%
10,001~15,000 5,911 70,469,849 3.015%
15,001~20,000 2,645 45,308,315 1.939%
20,001~30,000 2,252 53,794,259 2.302%
30,001~50,000 1,502 57,049,333 2.441%
50,001~100,000 901 61,509,119 2.632%
100,001~200,000 379 52,505,505 2.247%
200,001~400,000 184 51,899,331 2.221%
400,001~600,000 71 34,330,860 1.469%
600,001~800,000 55 38,667,843 1.655%
800,001~1,000,000 18 15,909,222 0.681%1,000,001 and above 191 1,443,154,029 61.751%
Total 304,167 2,337,063,681 100.000%

-20-
4.1.4 The List of Major Shareholders
SharesName Number Percentage
JPMorgan Chase Bank N.A. Taipei Branch in custody for EuroPacific Growth Fund 151,845,420 6.50%
JPMorgan Chase Bank N.A. Taipei Branch in custody for Capital World Growth and Income Fund Inc.
85,494,000 3.66%
JPMorgan Chase Bank N.A. Taipei Branch in custody for The Income Fund of America, Inc. 74,250,000 3.18%
Hong Rong Investment Corp. 65,093,415 2.79%Stan Shih 47,350,073 2.03%Acer Incorporated Global Depositary Receipt 46,770,054 2.00%Management Board of Public Service Pension Fund 44,160,005 1.89%
National Financial Stabilization Fund 43,705,833 1.87%GIC-GOS 26,113,860 1.12%SinoPac Bank Trust Department Account 24,500,000 1.05%
4.1.5 Market Price Per Share, Net Value, Earning& Dividend For Latest Two Years
Period
Item 2005 2006 Until Mar. 31st,
2007
Highest 82.37 84.5 68.6
Lowest 41.60 41.3 60.5 Market Price Per
Share Average 58.82 60.64 62.82 Before Distribution 25.17 32.24 33.82 Net Value Per
Share After Distribution 24.25 Un-appropriated Un-appropriated
2,294,957 2,296,317 Weighted Average Share Numbers
thousand shares thousand shares 2,296,317
thousand shares Current 3.83 4.45 2.47
Earning Per Share
Earning Per Share Adjusted 3.69 Un-appropriated Un-appropriated
Cash Dividend (NT$) 3 3.85 Retained Earning (%) 0.2 0.15 Stock
Dividend Capital Surplus (%) - - Un-appropriated Dividend Per
Share Accumulated unpaid dividends - - - P/E Ratio 15.94 13.63 - P/D Ratio 20.35 15.75 -
Return on Investment Analysis Cash Dividend Yield 4.91% 6.35% -
-21-
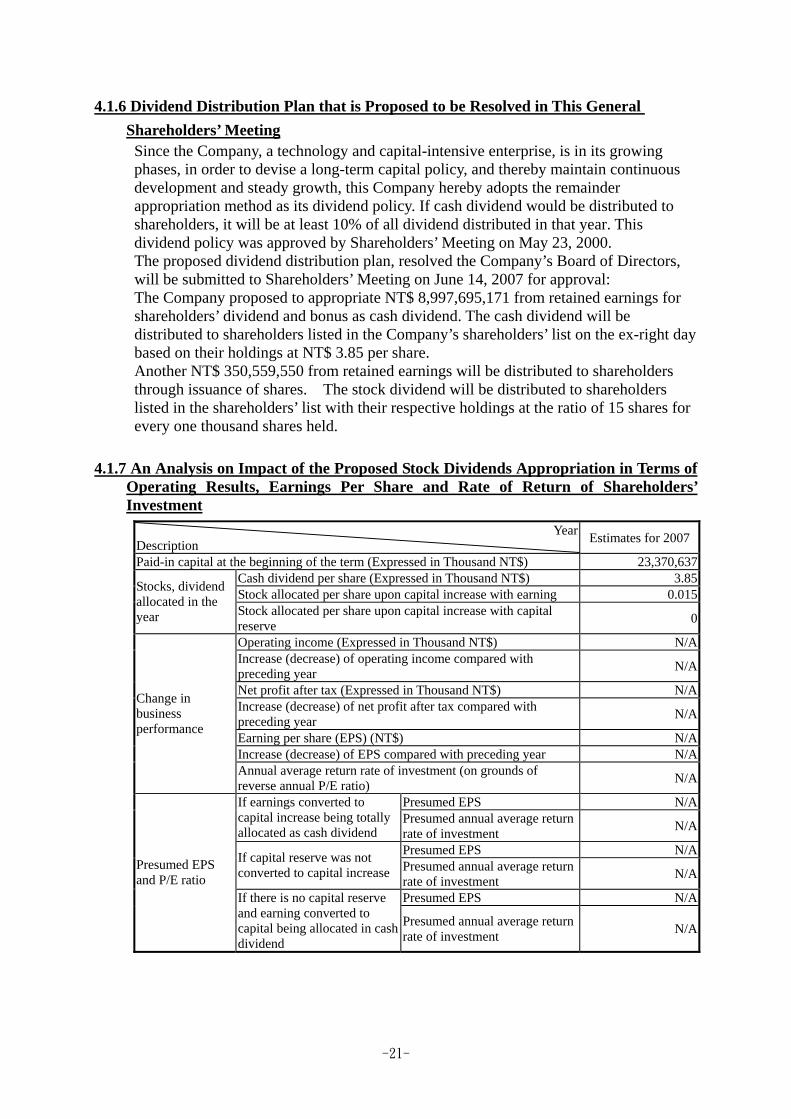
4.1.6 Dividend Distribution Plan that is Proposed to be Resolved in This General Shareholders’ Meeting
Since the Company, a technology and capital-intensive enterprise, is in its growing phases, in order to devise a long-term capital policy, and thereby maintain continuous development and steady growth, this Company hereby adopts the remainder appropriation method as its dividend policy. If cash dividend would be distributed to shareholders, it will be at least 10% of all dividend distributed in that year. This dividend policy was approved by Shareholders’ Meeting on May 23, 2000. The proposed dividend distribution plan, resolved the Company’s Board of Directors, will be submitted to Shareholders’ Meeting on June 14, 2007 for approval: The Company proposed to appropriate NT$ 8,997,695,171 from retained earnings for shareholders’ dividend and bonus as cash dividend. The cash dividend will be distributed to shareholders listed in the Company’s shareholders’ list on the ex-right day based on their holdings at NT$ 3.85 per share. Another NT$ 350,559,550 from retained earnings will be distributed to shareholders through issuance of shares. The stock dividend will be distributed to shareholders listed in the shareholders’ list with their respective holdings at the ratio of 15 shares for every one thousand shares held.
4.1.7 An Analysis on Impact of the Proposed Stock Dividends Appropriation in Terms of Operating Results, Earnings Per Share and Rate of Return of Shareholders’ Investment
Year Description Estimates for 2007
Paid-in capital at the beginning of the term (Expressed in Thousand NT$) 23,370,637Cash dividend per share (Expressed in Thousand NT$) 3.85Stock allocated per share upon capital increase with earning 0.015Stocks, dividend
allocated in the year Stock allocated per share upon capital increase with capital
reserve 0
Operating income (Expressed in Thousand NT$) N/AIncrease (decrease) of operating income compared with preceding year N/A
Net profit after tax (Expressed in Thousand NT$) N/AIncrease (decrease) of net profit after tax compared with preceding year N/A
Earning per share (EPS) (NT$) N/AIncrease (decrease) of EPS compared with preceding year N/A
Change in business performance
Annual average return rate of investment (on grounds of reverse annual P/E ratio) N/A
Presumed EPS N/AIf earnings converted to capital increase being totally allocated as cash dividend
Presumed annual average return rate of investment N/A
Presumed EPS N/AIf capital reserve was not converted to capital increase Presumed annual average return
rate of investment N/A
Presumed EPS N/A
Presumed EPS and P/E ratio
If there is no capital reserve and earning converted to capital being allocated in cash dividend
Presumed annual average return rate of investment N/A
-22-
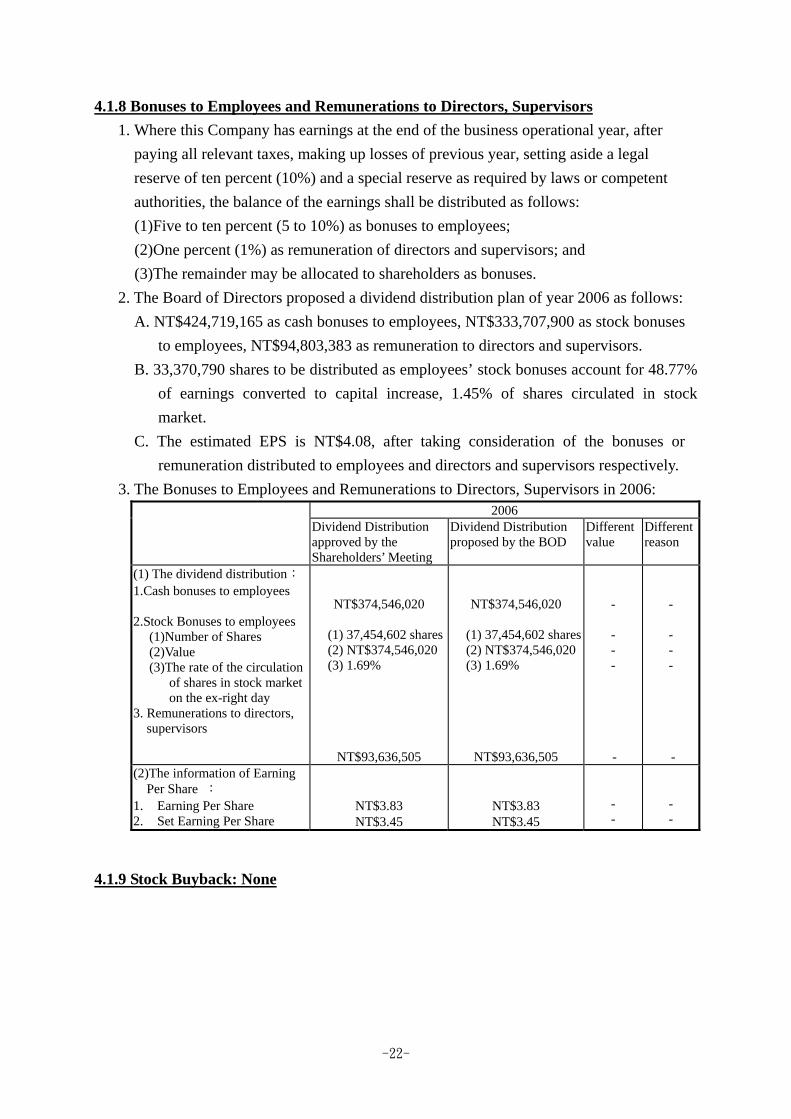
4.1.8 Bonuses to Employees and Remunerations to Directors, Supervisors 1. Where this Company has earnings at the end of the business operational year, after
paying all relevant taxes, making up losses of previous year, setting aside a legal reserve of ten percent (10%) and a special reserve as required by laws or competent authorities, the balance of the earnings shall be distributed as follows: (1)Five to ten percent (5 to 10%) as bonuses to employees; (2)One percent (1%) as remuneration of directors and supervisors; and (3)The remainder may be allocated to shareholders as bonuses.
2. The Board of Directors proposed a dividend distribution plan of year 2006 as follows: A. NT$424,719,165 as cash bonuses to employees, NT$333,707,900 as stock bonuses
to employees, NT$94,803,383 as remuneration to directors and supervisors. B. 33,370,790 shares to be distributed as employees’ stock bonuses account for 48.77%
of earnings converted to capital increase, 1.45% of shares circulated in stock market.
C. The estimated EPS is NT$4.08, after taking consideration of the bonuses or remuneration distributed to employees and directors and supervisors respectively.
3. The Bonuses to Employees and Remunerations to Directors, Supervisors in 2006: 2006
Dividend Distribution approved by the Shareholders’ Meeting
Dividend Distribution proposed by the BOD
Different value
Different reason
(1) The dividend distribution: 1.Cash bonuses to employees 2.Stock Bonuses to employees
(1)Number of Shares (2)Value (3)The rate of the circulation
of shares in stock market on the ex-right day
3. Remunerations to directors, supervisors
NT$374,546,020
(1) 37,454,602 shares (2) NT$374,546,020(3) 1.69%
NT$93,636,505
NT$374,546,020
(1) 37,454,602 shares (2) NT$374,546,020 (3) 1.69%
NT$93,636,505
- - - - -
- - - - -
(2)The information of Earning Per Share :
1. Earning Per Share 2. Set Earning Per Share
NT$3.83 NT$3.45
NT$3.83 NT$3.45
- -
- -
4.1.9 Stock Buyback: None
-23-
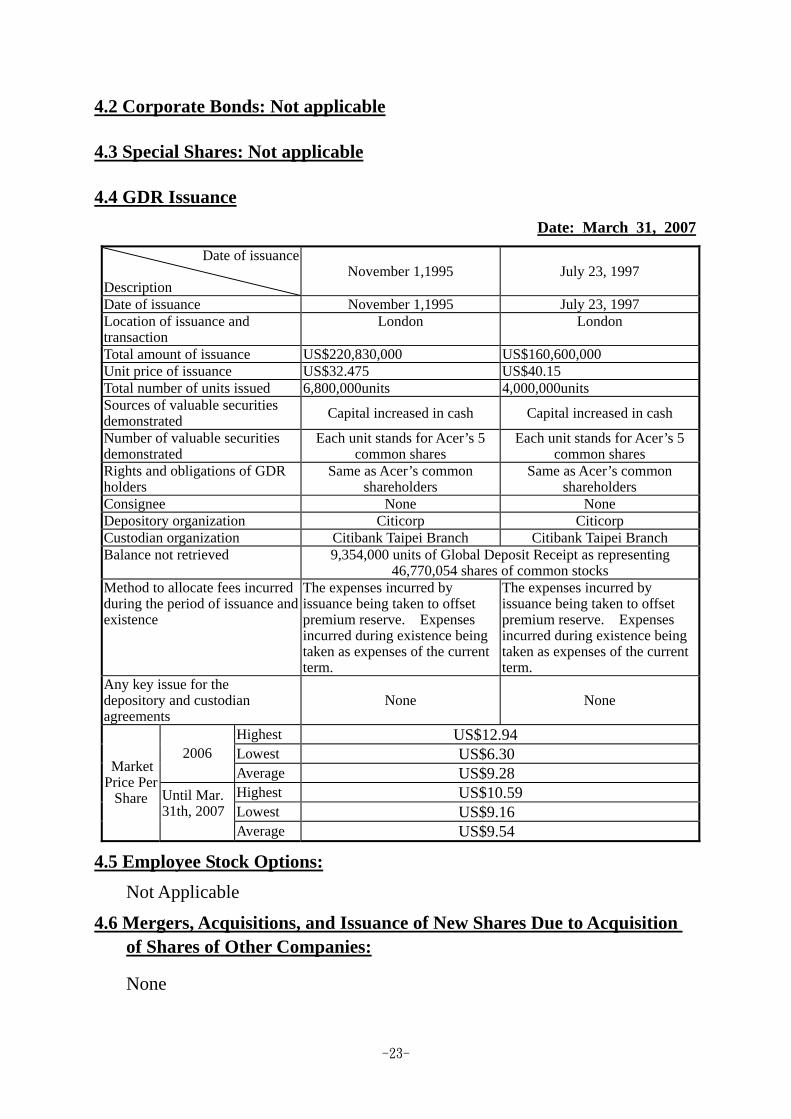
4.2 Corporate Bonds: Not applicable 4.3 Special Shares: Not applicable 4.4 GDR Issuance
Date: March 31, 2007
Date of issuance Description
November 1,1995 July 23, 1997
Date of issuance November 1,1995 July 23, 1997 Location of issuance and transaction
London London
Total amount of issuance US$220,830,000 US$160,600,000 Unit price of issuance US$32.475 US$40.15 Total number of units issued 6,800,000units 4,000,000units Sources of valuable securities demonstrated Capital increased in cash Capital increased in cash
Number of valuable securities demonstrated
Each unit stands for Acer’s 5 common shares
Each unit stands for Acer’s 5 common shares
Rights and obligations of GDR holders
Same as Acer’s common shareholders
Same as Acer’s common shareholders
Consignee None None Depository organization Citicorp Citicorp Custodian organization Citibank Taipei Branch Citibank Taipei Branch Balance not retrieved 9,354,000 units of Global Deposit Receipt as representing
46,770,054 shares of common stocks Method to allocate fees incurred during the period of issuance and existence
The expenses incurred by issuance being taken to offset premium reserve. Expenses incurred during existence being taken as expenses of the current term.
The expenses incurred by issuance being taken to offset premium reserve. Expenses incurred during existence being taken as expenses of the current term.
Any key issue for the depository and custodian agreements
None None
Highest US$12.94 Lowest US$6.30
2006
Average US$9.28 Highest US$10.59 Lowest US$9.16
Market Price Per
Share Until Mar. 31th, 2007 Average US$9.54
4.5 Employee Stock Options: Not Applicable
4.6 Mergers, Acquisitions, and Issuance of New Shares Due to Acquisition of Shares of Other Companies:
None
-24-
5. Business Description
5.1 Business Contents 5.1.1 Business Scope
(1) Business Scope 1. To engage in general import and export trade (except for other government-permitted business) 2. To distribute, enter bids for, make offers for merchandise of domestic and overseas manufacturers (except
for futures) 3. To research and develop, design, assemble, process, manufacture, inspect, test, sell, lease or rent, provide
maintenance services, integrate, and technical support, or to commission others to assemble, process, or manufacture, mechanical products, electrical appliances and products, instruments, electronic products, electronic communication equipment and office machinery, etc.
4. To manage distribution centers, bonded warehouses, and other storage facilities. 5. To conduct international trade. 6. To install computer equipment. 7. To engage in leasing and renting industry. 8. To engage in the wholesale purchase and sale of electric appliances. 9. To engage in the wholesale purchase and sale of office machinery and equipment. 10. To engage in the wholesale purchase and sale of telecommunications equipment. 11. To engage in the wholesale purchase and sale of electronic materials. 12. To engage in the retail of electric appliances. 13. To engage in the retail of office machinery and equipment. 14. To engage in the retail of telecommunications equipment. 15. To engage in the retail of electronic materials. 16. To design products. 17. To provide information management services. 18. To provide electronic information services. 19. Computer System Plan, Develop and sell Business. 20. Sever Plan, Develop and sell Business. 21. Data storage equipment Plan, Develop and sell Business. 22. CRT/LCD Monitor Plan, Develop and sell Business. 23. Peripherals、DVD、Projector Plan, Develop and sell Business. 24. Electronic IT Product supply services. 25. IA & personal multimedia Plan, Develop and sell Business 26. LCD TV Plan, Develop and sell Business. 27. Digital Home Application Plan, Develop and sell Business. 28. Except for other government-permitted business, may engage in business not prohibited or stipulated by
laws or regulations.
-25-
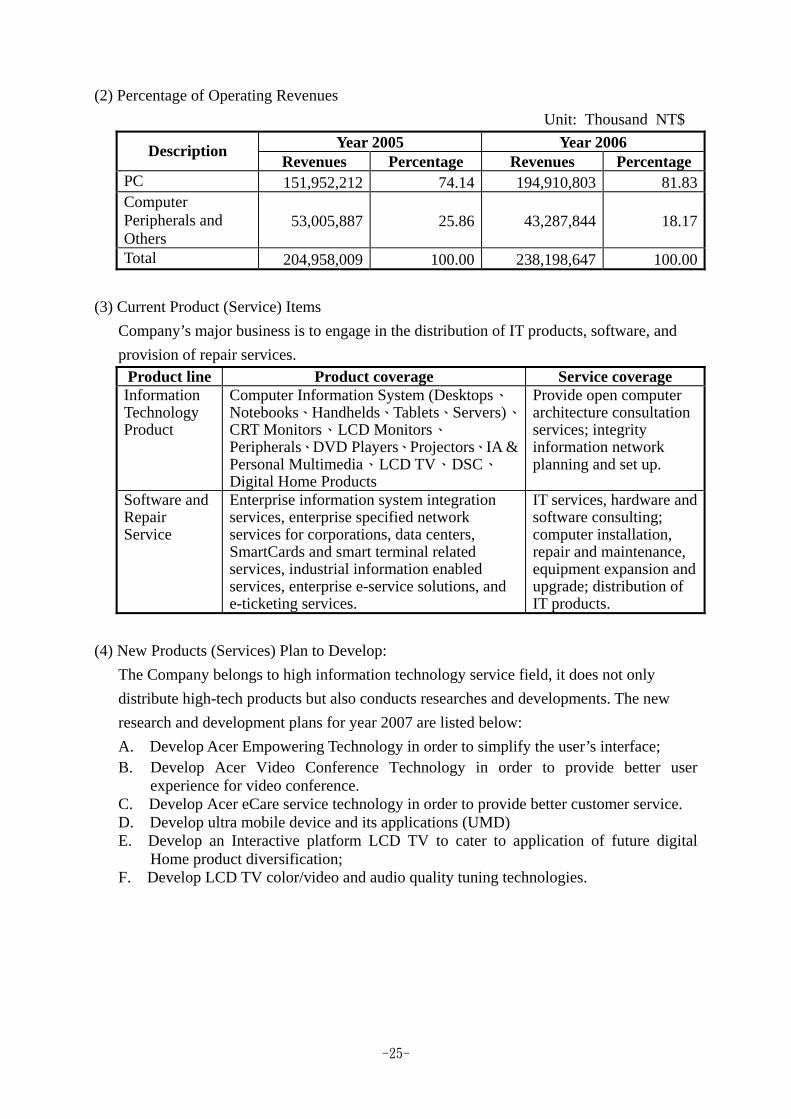
(2) Percentage of Operating Revenues Unit: Thousand NT$
Year 2005 Year 2006 Description Revenues Percentage Revenues Percentage
PC 151,952,212 74.14 194,910,803 81.83Computer Peripherals and Others
53,005,887 25.86 43,287,844 18.17
Total 204,958,009 100.00 238,198,647 100.00 (3) Current Product (Service) Items
Company’s major business is to engage in the distribution of IT products, software, and provision of repair services.
Product line Product coverage Service coverage Information Technology Product
Computer Information System (Desktops、Notebooks、Handhelds、Tablets、Servers)、CRT Monitors、LCD Monitors、Peripherals、DVD Players、Projectors、IA & Personal Multimedia、LCD TV、DSC、Digital Home Products
Provide open computer architecture consultation services; integrity information network planning and set up.
Software and Repair Service
Enterprise information system integration services, enterprise specified network services for corporations, data centers, SmartCards and smart terminal related services, industrial information enabled services, enterprise e-service solutions, and e-ticketing services.
IT services, hardware and software consulting; computer installation, repair and maintenance, equipment expansion and upgrade; distribution of IT products.
(4) New Products (Services) Plan to Develop:
The Company belongs to high information technology service field, it does not only distribute high-tech products but also conducts researches and developments. The new research and development plans for year 2007 are listed below: A. Develop Acer Empowering Technology in order to simplify the user’s interface; B. Develop Acer Video Conference Technology in order to provide better user
experience for video conference. C. Develop Acer eCare service technology in order to provide better customer service. D. Develop ultra mobile device and its applications (UMD) E. Develop an Interactive platform LCD TV to cater to application of future digital
Home product diversification; F. Develop LCD TV color/video and audio quality tuning technologies.
-26-
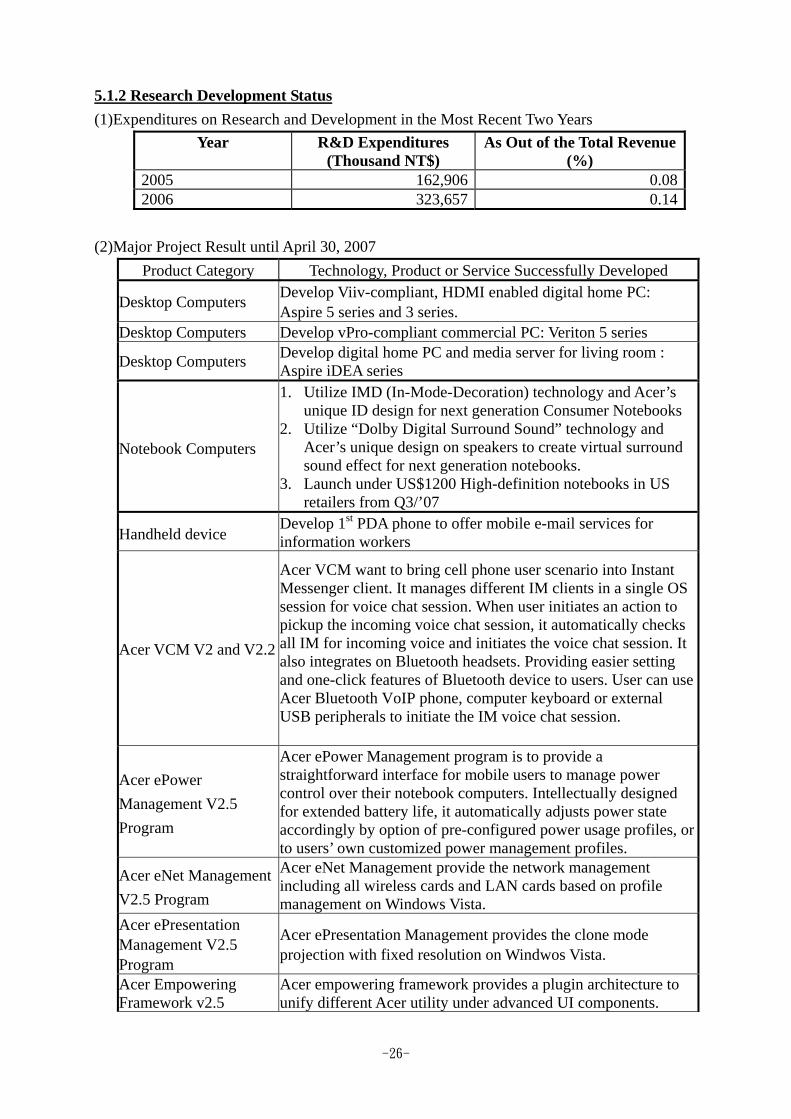
5.1.2 Research Development Status (1)Expenditures on Research and Development in the Most Recent Two Years
Year R&D Expenditures (Thousand NT$)
As Out of the Total Revenue (%)
2005 162,906 0.082006 323,657 0.14
(2)Major Project Result until April 30, 2007
Product Category Technology, Product or Service Successfully Developed
Desktop Computers Develop Viiv-compliant, HDMI enabled digital home PC: Aspire 5 series and 3 series.
Desktop Computers Develop vPro-compliant commercial PC: Veriton 5 series
Desktop Computers Develop digital home PC and media server for living room : Aspire iDEA series
Notebook Computers
1. Utilize IMD (In-Mode-Decoration) technology and Acer’s unique ID design for next generation Consumer Notebooks
2. Utilize “Dolby Digital Surround Sound” technology and Acer’s unique design on speakers to create virtual surround sound effect for next generation notebooks.
3. Launch under US$1200 High-definition notebooks in US retailers from Q3/’07
Handheld device Develop 1st PDA phone to offer mobile e-mail services for information workers
Acer VCM V2 and V2.2
Acer VCM want to bring cell phone user scenario into Instant Messenger client. It manages different IM clients in a single OS session for voice chat session. When user initiates an action to pickup the incoming voice chat session, it automatically checks all IM for incoming voice and initiates the voice chat session. It also integrates on Bluetooth headsets. Providing easier setting and one-click features of Bluetooth device to users. User can use Acer Bluetooth VoIP phone, computer keyboard or external USB peripherals to initiate the IM voice chat session.
Acer ePower Management V2.5 Program
Acer ePower Management program is to provide a straightforward interface for mobile users to manage power control over their notebook computers. Intellectually designed for extended battery life, it automatically adjusts power state accordingly by option of pre-configured power usage profiles, or to users’ own customized power management profiles.
Acer eNet Management V2.5 Program
Acer eNet Management provide the network management including all wireless cards and LAN cards based on profile management on Windows Vista.
Acer ePresentation Management V2.5 Program
Acer ePresentation Management provides the clone mode projection with fixed resolution on Windwos Vista.
Acer Empowering Framework v2.5
Acer empowering framework provides a plugin architecture to unify different Acer utility under advanced UI components.
-27-
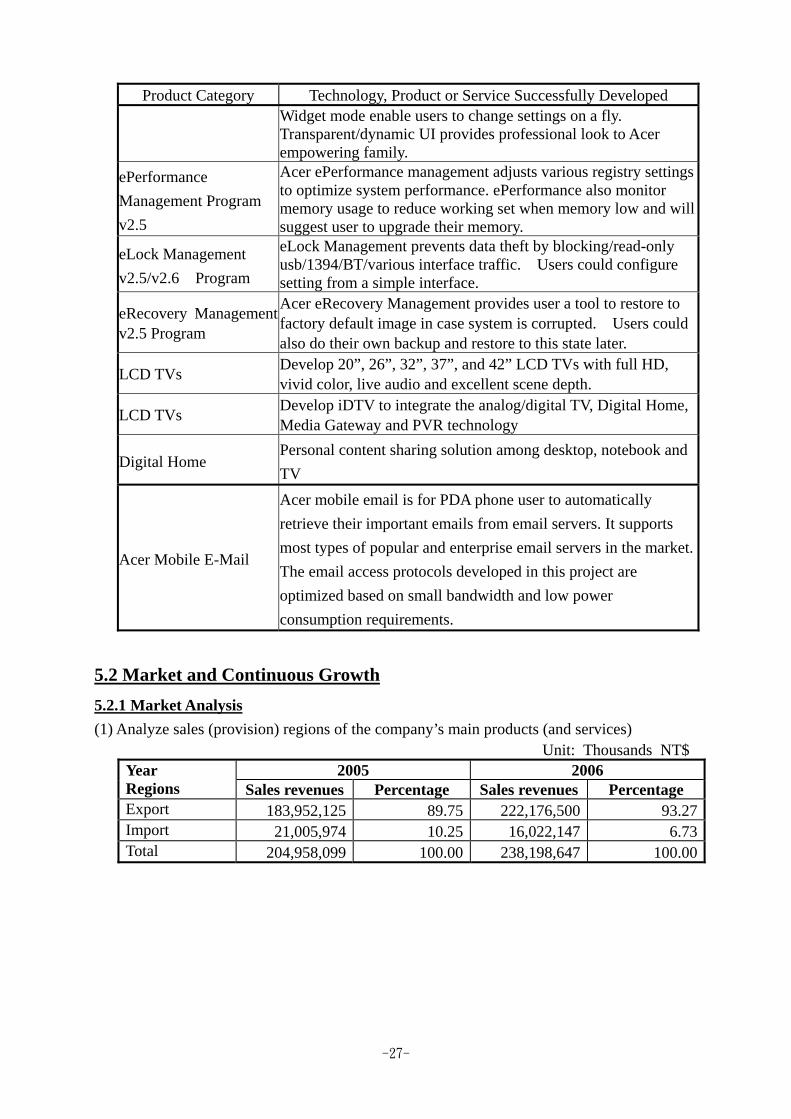
Product Category Technology, Product or Service Successfully Developed Widget mode enable users to change settings on a fly. Transparent/dynamic UI provides professional look to Acer empowering family.
ePerformance Management Program v2.5
Acer ePerformance management adjusts various registry settings to optimize system performance. ePerformance also monitor memory usage to reduce working set when memory low and will suggest user to upgrade their memory.
eLock Management v2.5/v2.6 Program
eLock Management prevents data theft by blocking/read-only usb/1394/BT/various interface traffic. Users could configure setting from a simple interface.
eRecovery Management v2.5 Program
Acer eRecovery Management provides user a tool to restore to factory default image in case system is corrupted. Users could also do their own backup and restore to this state later.
LCD TVs Develop 20”, 26”, 32”, 37”, and 42” LCD TVs with full HD, vivid color, live audio and excellent scene depth.
LCD TVs Develop iDTV to integrate the analog/digital TV, Digital Home, Media Gateway and PVR technology
Digital Home Personal content sharing solution among desktop, notebook and TV
Acer Mobile E-Mail
Acer mobile email is for PDA phone user to automatically retrieve their important emails from email servers. It supports most types of popular and enterprise email servers in the market. The email access protocols developed in this project are optimized based on small bandwidth and low power consumption requirements.
5.2 Market and Continuous Growth 5.2.1 Market Analysis (1) Analyze sales (provision) regions of the company’s main products (and services)
Unit: Thousands NT$ 2005 2006 Year
Regions Sales revenues Percentage Sales revenues Percentage Export 183,952,125 89.75 222,176,500 93.27Import 21,005,974 10.25 16,022,147 6.73Total 204,958,099 100.00 238,198,647 100.00
-28-
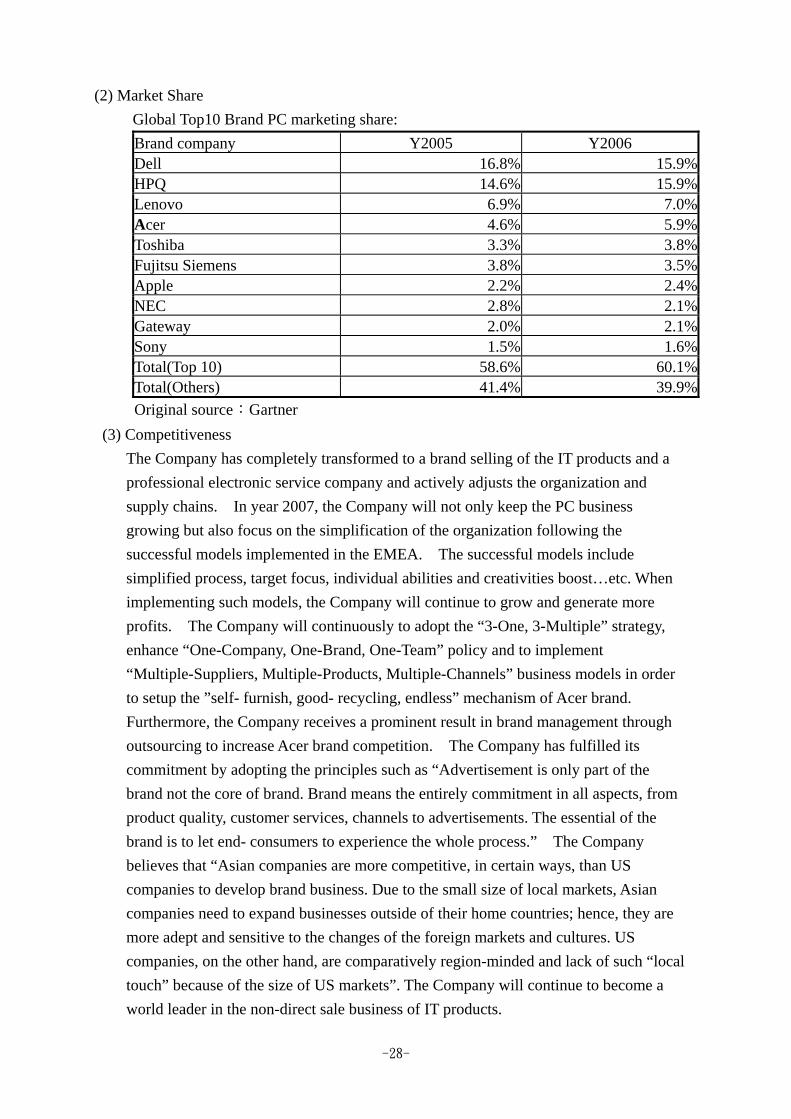
(2) Market Share Global Top10 Brand PC marketing share: Brand company Y2005 Y2006 Dell 16.8% 15.9%HPQ 14.6% 15.9%Lenovo 6.9% 7.0%Acer 4.6% 5.9%Toshiba 3.3% 3.8%Fujitsu Siemens 3.8% 3.5%Apple 2.2% 2.4%NEC 2.8% 2.1%Gateway 2.0% 2.1%Sony 1.5% 1.6%Total(Top 10) 58.6% 60.1%Total(Others) 41.4% 39.9%Original source:Gartner
(3) Competitiveness The Company has completely transformed to a brand selling of the IT products and a professional electronic service company and actively adjusts the organization and supply chains. In year 2007, the Company will not only keep the PC business growing but also focus on the simplification of the organization following the successful models implemented in the EMEA. The successful models include simplified process, target focus, individual abilities and creativities boost…etc. When implementing such models, the Company will continue to grow and generate more profits. The Company will continuously to adopt the “3-One, 3-Multiple” strategy, enhance “One-Company, One-Brand, One-Team” policy and to implement “Multiple-Suppliers, Multiple-Products, Multiple-Channels” business models in order to setup the ”self- furnish, good- recycling, endless” mechanism of Acer brand. Furthermore, the Company receives a prominent result in brand management through outsourcing to increase Acer brand competition. The Company has fulfilled its commitment by adopting the principles such as “Advertisement is only part of the brand not the core of brand. Brand means the entirely commitment in all aspects, from product quality, customer services, channels to advertisements. The essential of the brand is to let end- consumers to experience the whole process.” The Company believes that “Asian companies are more competitive, in certain ways, than US companies to develop brand business. Due to the small size of local markets, Asian companies need to expand businesses outside of their home countries; hence, they are more adept and sensitive to the changes of the foreign markets and cultures. US companies, on the other hand, are comparatively region-minded and lack of such “local touch” because of the size of US markets”. The Company will continue to become a world leader in the non-direct sale business of IT products.
-29-
(4) Long Term Advantages, Disadvantages and Solutions of Company A. Advantages
a. Continuously adopt the “3-One, 3-Multiple” strategy, enhance “One-company, One-brand, One-Team” policy and “Multiple-Suppliers, Multiple-Products, Multiple-Channels” business models, with the global competitive experiences, possess empowering technology, speed, quality controls and have flexible supply chain management, risk management, win-win strategy, and implement corporate governance.
b. Fully leverage Chinese culture advantages, implement the workable “New Channel Business Model” in Chinese market, also enhance the efficiency of inventory and expense management, brand advertisement, and offer the competitive prices of digital life services.
c. The worldwide PC market expects a 10.7% growth. d. Fully leverage Taiwan advantages in research, design and innovation to ensure
the abundance of raw material resources and the competitiveness of product cost. e. Invest IT management and security. Due to the improvement of world economy
and investment environments, enterprises will invest more and more on IT related areas.
f. Continuously invest the projects conducted by Product Value Lab. Product Value Lab has gained a prominent achievement in “Empowering Technology” and other products and services innovation.
g. The more popularity and low cost of broadband and wireless helps the long distance IT service. Company will make use of this opportunity to achieve the IT service business.
h. The introduction of LCD TV will generate another growth of IA business industry.
B. Disadvantages and Solutions of Company According to the More Rule, consumers have no desires to purchase new PC products because the speed of phasing out is too fast to catch up with. Solution: The keys to sell H/W are to provide consumers S/W and total solution. To
enhance “Empowering Technology” created by Product Value Lab and provide “easy” and “reliable” products, and integrate H/W, S/W and services will be able to meet consumers’ need (one-stop service) and insert the new elements to PC and IT industry.
-30-
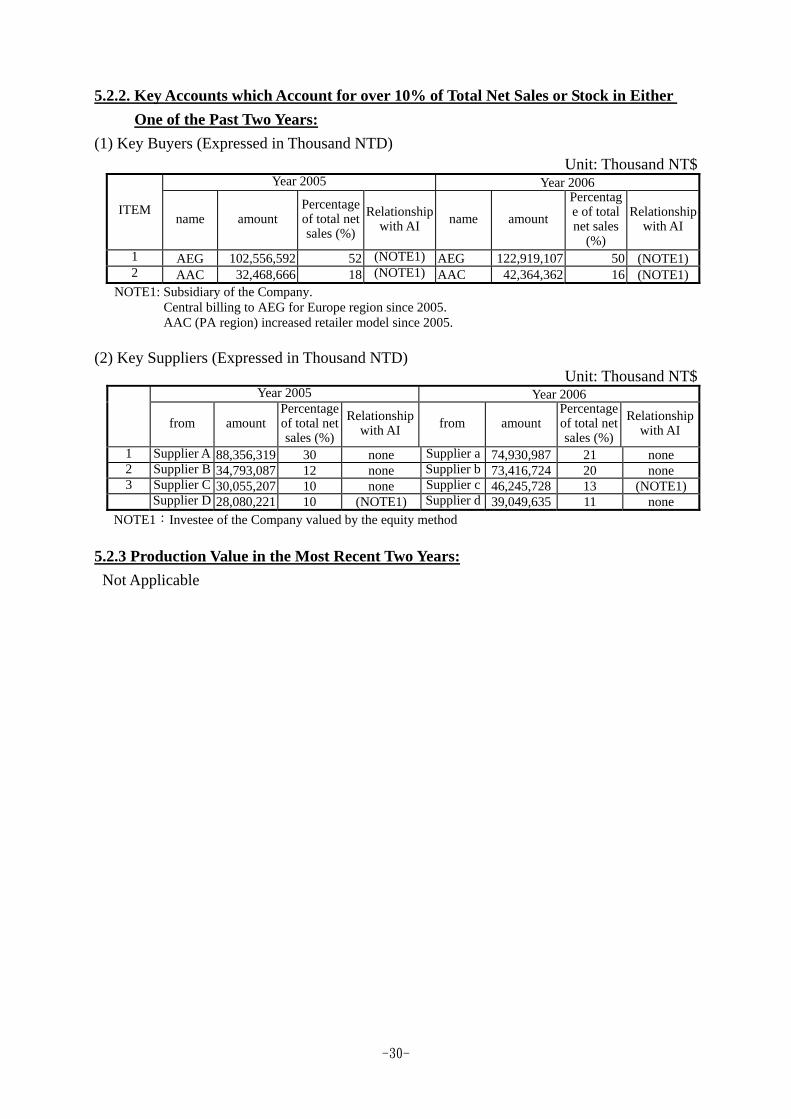
5.2.2. Key Accounts which Account for over 10% of Total Net Sales or Stock in Either One of the Past Two Years:
(1) Key Buyers (Expressed in Thousand NTD) Unit: Thousand NT$
Year 2005 Year 2006
ITEM name amount
Percentage of total net sales (%)
Relationship with AI name amount
Percentage of total net sales
(%)
Relationship with AI
1 AEG 102,556,592 52 (NOTE1) AEG 122,919,107 50 (NOTE1)2 AAC 32,468,666 18 (NOTE1) AAC 42,364,362 16 (NOTE1)
NOTE1: Subsidiary of the Company. Central billing to AEG for Europe region since 2005.
AAC (PA region) increased retailer model since 2005.
(2) Key Suppliers (Expressed in Thousand NTD) Unit: Thousand NT$
Year 2005 Year 2006
from amount Percentage of total net sales (%)
Relationship with AI from amount
Percentage of total net sales (%)
Relationship with AI
1 Supplier A 88,356,319 30 none Supplier a 74,930,987 21 none 2 Supplier B 34,793,087 12 none Supplier b 73,416,724 20 none 3 Supplier C 30,055,207 10 none Supplier c 46,245,728 13 (NOTE1) Supplier D 28,080,221 10 (NOTE1) Supplier d 39,049,635 11 none
NOTE1:Investee of the Company valued by the equity method
5.2.3 Production Value in the Most Recent Two Years: Not Applicable
-31-
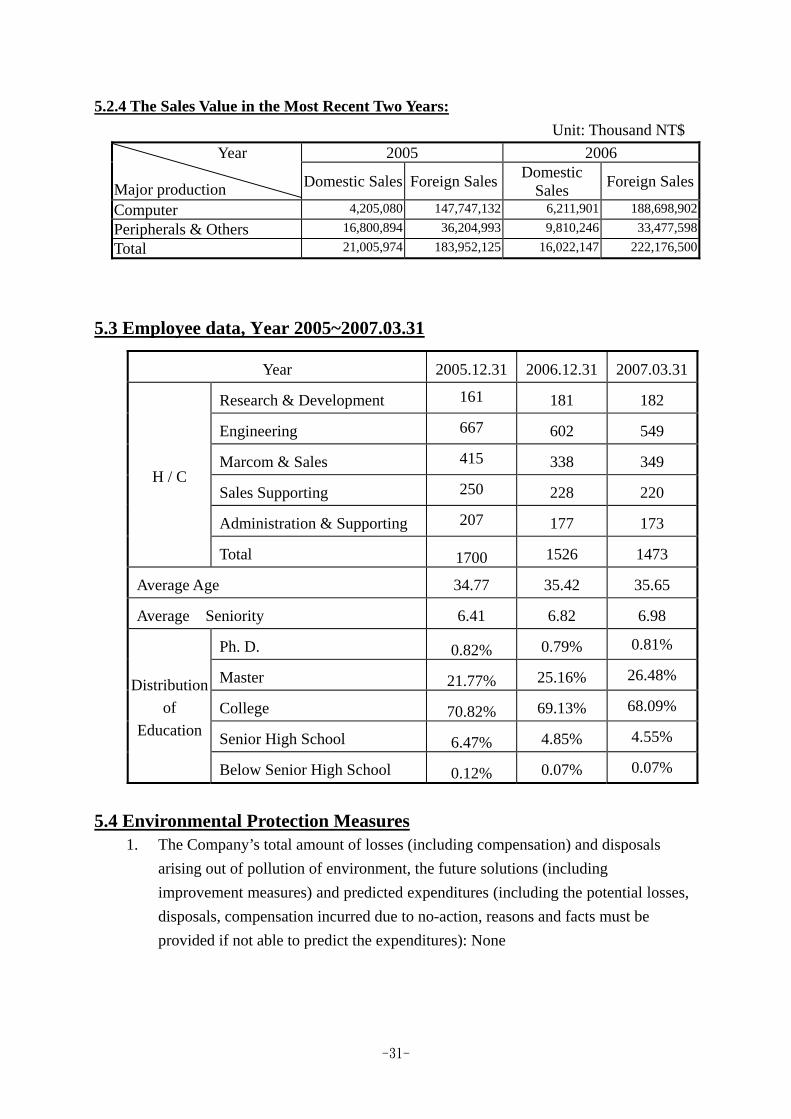
5.2.4 The Sales Value in the Most Recent Two Years: Unit: Thousand NT$
2005 2006 Year Major production Domestic Sales Foreign Sales Domestic
Sales Foreign Sales
Computer 4,205,080 147,747,132 6,211,901 188,698,902Peripherals & Others 16,800,894 36,204,993 9,810,246 33,477,598Total 21,005,974 183,952,125 16,022,147 222,176,500
5.3 Employee data, Year 2005~2007.03.31
Year 2005.12.31 2006.12.31 2007.03.31
Research & Development 161 181 182
Engineering 667 602 549
Marcom & Sales 415 338 349
Sales Supporting 250 228 220
Administration & Supporting 207 177 173
H / C
Total 1700 1526 1473
Average Age 34.77 35.42 35.65
Average Seniority 6.41 6.82 6.98
Ph. D. 0.82% 0.79% 0.81%
Master 21.77% 25.16% 26.48%
College 70.82% 69.13% 68.09%
Senior High School 6.47% 4.85% 4.55%
Distribution of
Education
Below Senior High School 0.12% 0.07% 0.07%
5.4 Environmental Protection Measures
1. The Company’s total amount of losses (including compensation) and disposals arising out of pollution of environment, the future solutions (including improvement measures) and predicted expenditures (including the potential losses, disposals, compensation incurred due to no-action, reasons and facts must be provided if not able to predict the expenditures): None
-32-
2. IT Products Business Group of the Company had received ISO 9001:2000
certified by BVQI in November of 2002 and received ISO 14001:1996 certified by BVQI in February of 2003. We follow the new product development procedures and adopt green design to increase our competitiveness. The Company had carried out the task of three-year renewing the certification of ISO9001:2000 and ISO14001:2004 from January 2005, and received ISO14001:2004 certification at the end of November, 2005.
3. In order to reduce the hazardous substances and meet the requirements set forth in the RoHS Directive of the EU, we released the green product requirements to supplier in November of 2004 and timely audit and educate the suppliers afterwards. The Company has requested suppliers to improve the products quality in order to have all products to meet the requirements set forth in RoHS Directive on July 1st, 2006.
4. In order to reduce the impact to the environment and provide a recycling system for end-of-life products, the Company had started to implement a global recycling program, and executed recycling program in compliance with local competent laws and regulations.
5. In order to receive updated worldwide environmental protection information, the Company and IER have continued coordinating closely and planning an environmental strategy for promoting the Company’s management system. The plans include environmental communication, environmental trainings and writing a sustainable environmental report.
-33-
6. Financial Standing
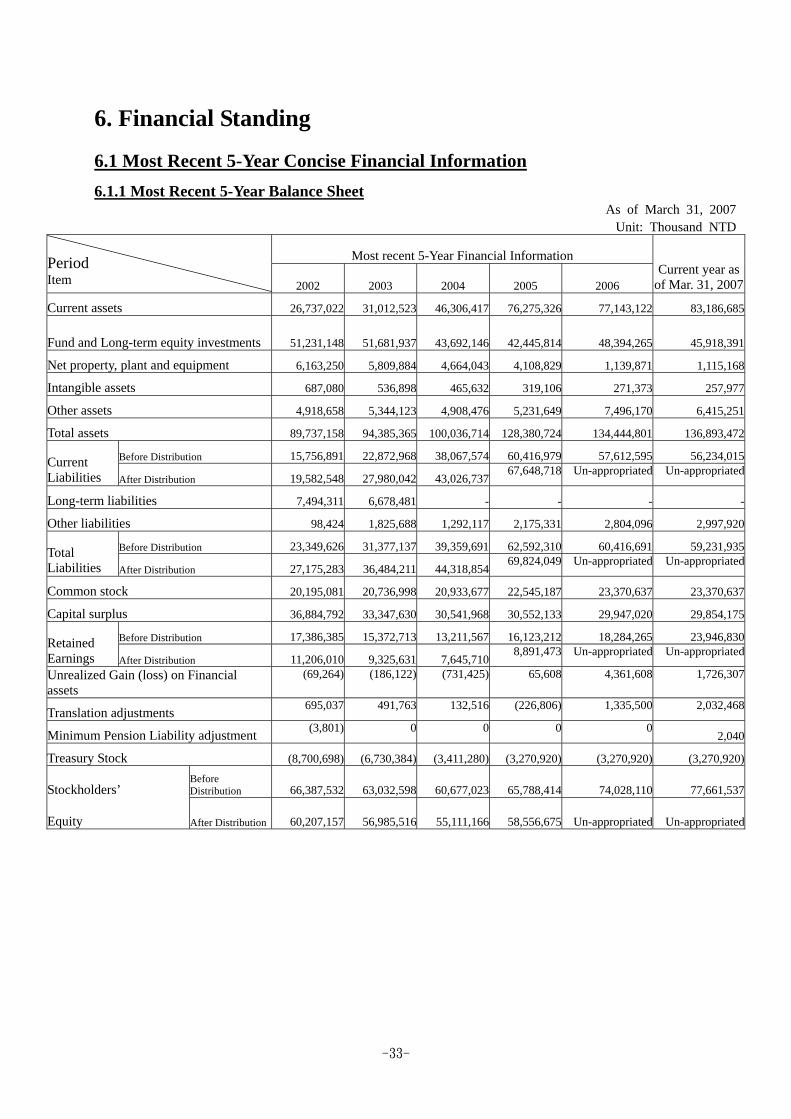
6.1 Most Recent 5-Year Concise Financial Information 6.1.1 Most Recent 5-Year Balance Sheet
As of March 31, 2007 Unit: Thousand NTD
Most recent 5-Year Financial Information Period Item 2002 2003 2004 2005 2006
Current year as of Mar. 31, 2007
Current assets 26,737,022 31,012,523 46,306,417 76,275,326 77,143,122 83,186,685
Fund and Long-term equity investments 51,231,148 51,681,937 43,692,146 42,445,814 48,394,265 45,918,391
Net property, plant and equipment 6,163,250 5,809,884 4,664,043 4,108,829 1,139,871 1,115,168
Intangible assets 687,080 536,898 465,632 319,106 271,373 257,977
Other assets 4,918,658 5,344,123 4,908,476 5,231,649 7,496,170 6,415,251
Total assets 89,737,158 94,385,365 100,036,714 128,380,724 134,444,801 136,893,472
Before Distribution 15,756,891 22,872,968 38,067,574 60,416,979 57,612,595 56,234,015 Current Liabilities After Distribution 19,582,548 27,980,042 43,026,737
67,648,718 Un-appropriated Un-appropriated
Long-term liabilities 7,494,311 6,678,481 - - - -
Other liabilities 98,424 1,825,688 1,292,117 2,175,331 2,804,096 2,997,920
Before Distribution 23,349,626 31,377,137 39,359,691 62,592,310 60,416,691 59,231,935 Total Liabilities After Distribution 27,175,283 36,484,211 44,318,854
69,824,049 Un-appropriated Un-appropriated
Common stock 20,195,081 20,736,998 20,933,677 22,545,187 23,370,637 23,370,637
Capital surplus 36,884,792 33,347,630 30,541,968 30,552,133 29,947,020 29,854,175
Before Distribution 17,386,385 15,372,713 13,211,567 16,123,212 18,284,265 23,946,830 Retained Earnings After Distribution 11,206,010 9,325,631 7,645,710
8,891,473 Un-appropriated Un-appropriated
Unrealized Gain (loss) on Financial assets
(69,264) (186,122) (731,425) 65,608 4,361,608 1,726,307
Translation adjustments 695,037 491,763 132,516 (226,806) 1,335,500 2,032,468
Minimum Pension Liability adjustment (3,801) 0 0 0 0 2,040
Treasury Stock (8,700,698) (6,730,384) (3,411,280) (3,270,920) (3,270,920) (3,270,920)
Stockholders’ Before Distribution 66,387,532 63,032,598 60,677,023 65,788,414 74,028,110 77,661,537
Equity After Distribution 60,207,157 56,985,516 55,111,166 58,556,675 Un-appropriated Un-appropriated
-34-
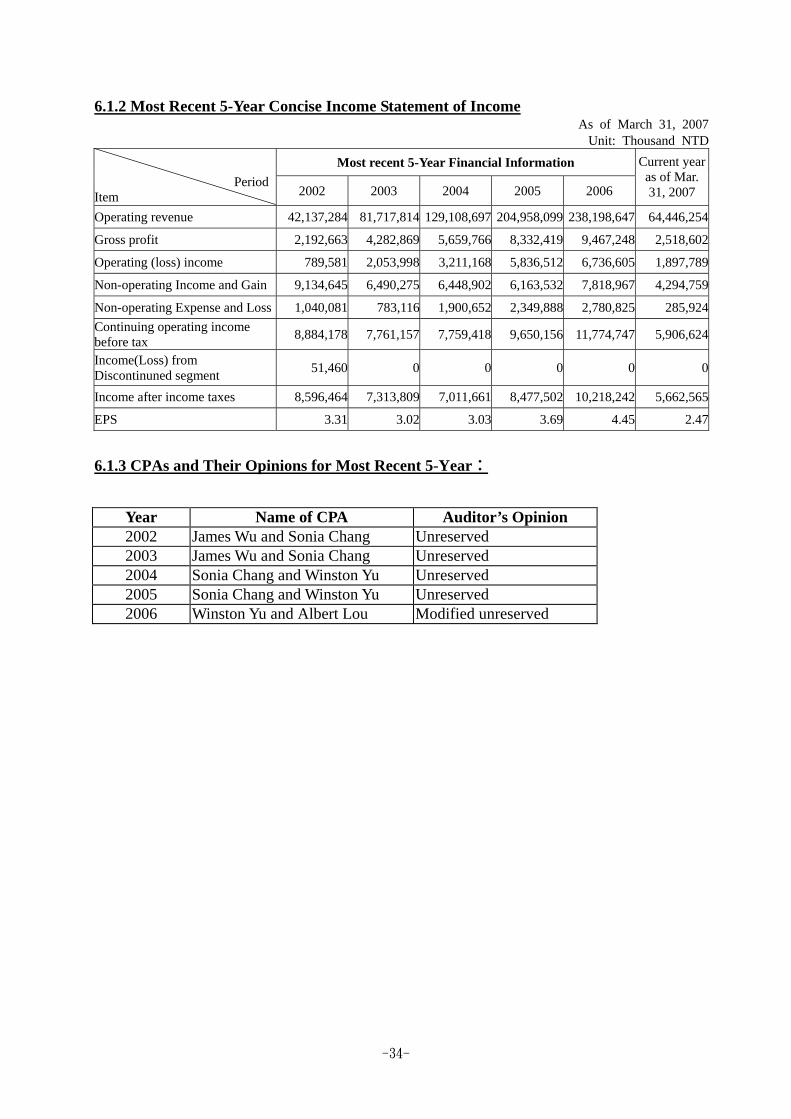
6.1.2 Most Recent 5-Year Concise Income Statement of Income As of March 31, 2007
Unit: Thousand NTD
Most recent 5-Year Financial Information Period Item 2002 2003 2004 2005 2006
Current year as of Mar. 31, 2007
Operating revenue 42,137,284 81,717,814 129,108,697 204,958,099 238,198,647 64,446,254
Gross profit 2,192,663 4,282,869 5,659,766 8,332,419 9,467,248 2,518,602
Operating (loss) income 789,581 2,053,998 3,211,168 5,836,512 6,736,605 1,897,789
Non-operating Income and Gain 9,134,645 6,490,275 6,448,902 6,163,532 7,818,967 4,294,759
Non-operating Expense and Loss 1,040,081 783,116 1,900,652 2,349,888 2,780,825 285,924Continuing operating income before tax 8,884,178 7,761,157 7,759,418 9,650,156 11,774,747 5,906,624
Income(Loss) from Discontinuned segment 51,460 0 0 0 0 0
Income after income taxes 8,596,464 7,313,809 7,011,661 8,477,502 10,218,242 5,662,565
EPS 3.31 3.02 3.03 3.69 4.45 2.47
6.1.3 CPAs and Their Opinions for Most Recent 5-Year:
Year Name of CPA Auditor’s Opinion 2002 James Wu and Sonia Chang Unreserved 2003 James Wu and Sonia Chang Unreserved 2004 Sonia Chang and Winston Yu Unreserved 2005 Sonia Chang and Winston Yu Unreserved 2006 Winston Yu and Albert Lou Modified unreserved
-35-
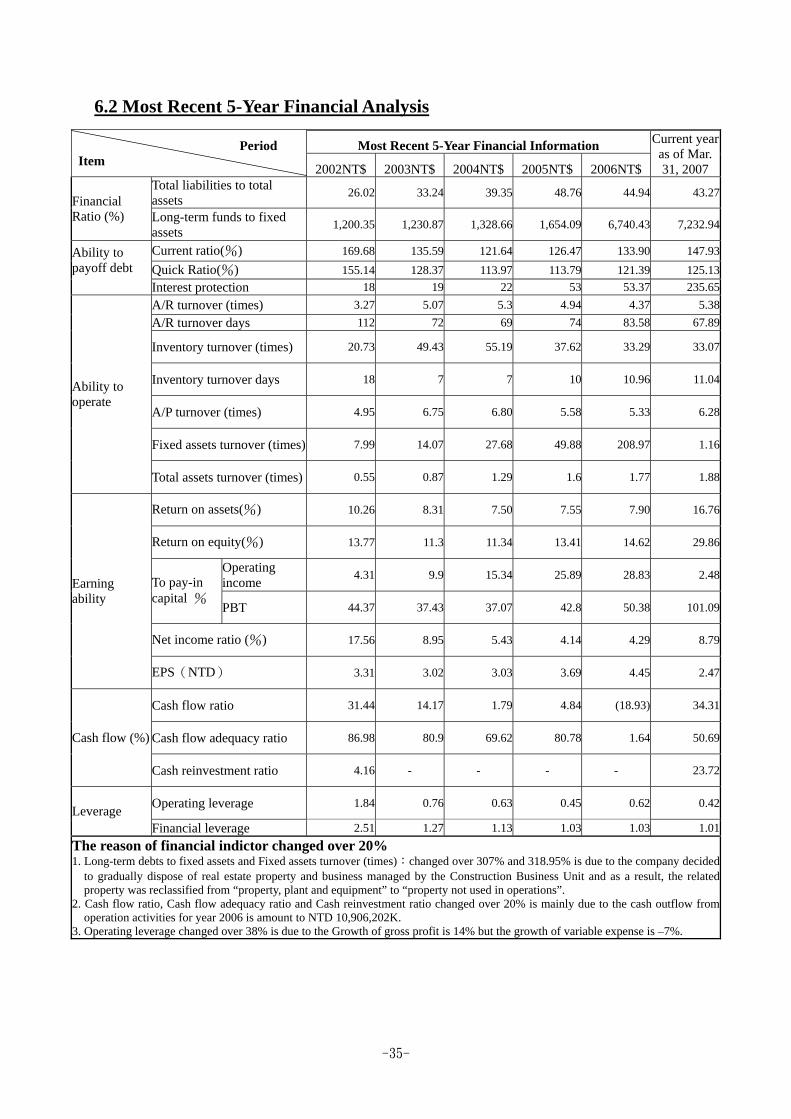
6.2 Most Recent 5-Year Financial Analysis
Most Recent 5-Year Financial Information Period Item 2002NT$ 2003NT$ 2004NT$ 2005NT$ 2006NT$
Current year as of Mar. 31, 2007
Total liabilities to total assets 26.02 33.24 39.35 48.76 44.94 43.27
Financial Ratio (%) Long-term funds to fixed
assets 1,200.35 1,230.87 1,328.66 1,654.09 6,740.43 7,232.94
Current ratio(%) 169.68 135.59 121.64 126.47 133.90 147.93 Quick Ratio(%) 155.14 128.37 113.97 113.79 121.39 125.13
Ability to payoff debt Interest protection 18 19 22 53 53.37 235.65
A/R turnover (times) 3.27 5.07 5.3 4.94 4.37 5.38 A/R turnover days 112 72 69 74 83.58 67.89
Inventory turnover (times) 20.73 49.43 55.19 37.62 33.29 33.07
Inventory turnover days 18 7 7 10 10.96 11.04
A/P turnover (times) 4.95 6.75 6.80 5.58 5.33 6.28
Fixed assets turnover (times) 7.99 14.07 27.68 49.88 208.97 1.16
Ability to operate
Total assets turnover (times) 0.55 0.87 1.29 1.6 1.77 1.88
Return on assets(%) 10.26 8.31 7.50 7.55 7.90 16.76
Return on equity(%) 13.77 11.3 11.34 13.41 14.62 29.86
Operating income 4.31 9.9 15.34 25.89 28.83 2.48 To pay-in
capital % PBT 44.37 37.43 37.07 42.8 50.38 101.09
Net income ratio (%) 17.56 8.95 5.43 4.14 4.29 8.79
Earning ability
EPS(NTD) 3.31 3.02 3.03 3.69 4.45 2.47
Cash flow ratio 31.44 14.17 1.79 4.84 (18.93) 34.31
Cash flow adequacy ratio 86.98 80.9 69.62 80.78 1.64 50.69Cash flow (%)
Cash reinvestment ratio 4.16 - - - - 23.72
Operating leverage 1.84 0.76 0.63 0.45 0.62 0.42 Leverage Financial leverage 2.51 1.27 1.13 1.03 1.03 1.01
The reason of financial indictor changed over 20% 1. Long-term debts to fixed assets and Fixed assets turnover (times):changed over 307% and 318.95% is due to the company decided
to gradually dispose of real estate property and business managed by the Construction Business Unit and as a result, the related property was reclassified from “property, plant and equipment” to “property not used in operations”.
2. Cash flow ratio, Cash flow adequacy ratio and Cash reinvestment ratio changed over 20% is mainly due to the cash outflow from operation activities for year 2006 is amount to NTD 10,906,202K.
3. Operating leverage changed over 38% is due to the Growth of gross profit is 14% but the growth of variable expense is –7%.

-36-
1. Financial Ratio (1) Total liabilities to Total assets=Total liabilities /Total assets (2) Long-term funds to fixed assets=(Net equity+Long term debts)/Net fixed assets
2. Ability to Pay off Debt (1) Current ratio=Current Assets/Current liability (2) Quick ratio=(Current assets-Inventory-Prepaid expenses)/Current liability (3) Interest protection=Net income before income tax and interest expense/Interest
expense 3. Ability to Operate
(1) Account receivable (including account receivable and notes receivable from operation) turnover=Net sales/the Average of account receivable (including account receivable and notes receivable from operation) balance
(2) A/R turnover day=365/account receivable turnover (3) Inventory turnover=Cost of goods sold/the average of inventory (4) Account payable (including account payable and notes payable from
operation)turnover=Cost of goods sold/the average of account payable(including account payable and notes payable from operation)balance
(5) Inventory turnover day=365/Inventory turnover (6) Fixed assets turnover=Net sales/Net Fixed Assets (7) Total assets turnover=Net sales/Total assets
4. Earning Ability (1) Return on assets=〔PAT+Interest expense×(1-tax rate)〕/the average of total
assets (2) Return on equity=PAT/the average of net equity (3) Net income ratio=PAT/Net sales (4) EPS =(PAT- Dividend from prefer stock)/weighted average outstanding
shares 5. Cash Flow
(1) Cash flow ratio=Cash flow from operating activities/Current liability (2) Cash flow adequacy ratio=Most recent 5-year Cash flow from operating activities
/Most recent 5-year (Capital expenditure+the increase of inventory+cash dividend)
(3) Cash reinvestment ratio=(Cash flow from operating activities-cash dividend) / (Gross fixed assets+long-term investment+other assets+working capital)
6. Leverage (1) Operating leverage=(Nest revenue-variable cost of goods sold and operating
expense)/operating income (2) Financial leverage=Operating income/(Operating income-interest expenses)
-37-
6.3 Audit Report of Supervisor
To: The 2007 General Shareholders Meeting The Board of Directors of the Company has prepared the 2006 financial report, including balance sheet, statement of income, statements of changes in stockholders’ equity, and statement of cash flows, and Winston Yu and Albert Lou at KPMG has been retained by the Board of Directors of the Company to issue an audit report. The undersigned supervisors have reviewed the audit report and the aforesaid documents, which made by The Board of Directors in compliance with Article 228 of the Company Law, and did not find any incompliance. In accordance with Article 219 of the Company Law, it is hereby submitted for your review and perusal.
Supervisor: George Huang
Supervisor: Carolyn Yeh
Dated: April 26, 2007
-85-
6.5 Disclosure the impact in the company’s financial status if the company
or affiliates have financial difficulties in recent year and cut off by the published date of the annual report:
Not Applicable
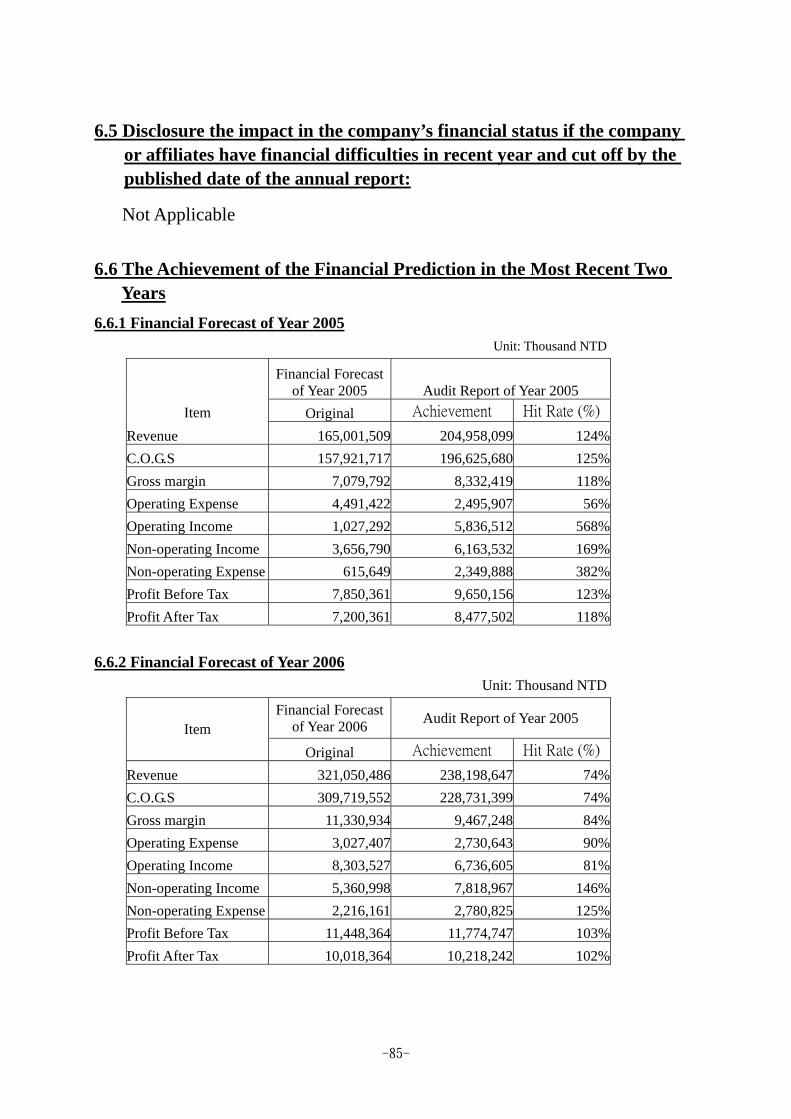
6.6 The Achievement of the Financial Prediction in the Most Recent Two Years
6.6.1 Financial Forecast of Year 2005 Unit: Thousand NTD
Financial Forecast of Year 2005 Audit Report of Year 2005
Item Original Achievement Hit Rate (%)
Revenue 165,001,509 204,958,099 124% C.O.G.S 157,921,717 196,625,680 125% Gross margin 7,079,792 8,332,419 118% Operating Expense 4,491,422 2,495,907 56% Operating Income 1,027,292 5,836,512 568% Non-operating Income 3,656,790 6,163,532 169% Non-operating Expense 615,649 2,349,888 382% Profit Before Tax 7,850,361 9,650,156 123% Profit After Tax 7,200,361 8,477,502 118%
6.6.2 Financial Forecast of Year 2006
Unit: Thousand NTD
Financial Forecast of Year 2006 Audit Report of Year 2005
Item Original Achievement Hit Rate (%)
Revenue 321,050,486 238,198,647 74% C.O.G.S 309,719,552 228,731,399 74% Gross margin 11,330,934 9,467,248 84% Operating Expense 3,027,407 2,730,643 90% Operating Income 8,303,527 6,736,605 81% Non-operating Income 5,360,998 7,818,967 146% Non-operating Expense 2,216,161 2,780,825 125% Profit Before Tax 11,448,364 11,774,747 103% Profit After Tax 10,018,364 10,218,242 102%
-86-
(1) Achievement Status Revenue of year 2006 amounted to 238,198,647k, which were 74% of the financial forecast. And Gross margin, operating income and profit before tax of year 2006 amounted to 9,467,248K, 6,736,605K and 11,774,747K respectively which were 84%, 81% and 103% of the whole year financial forecast respectively. The achievement status was good.
-87-
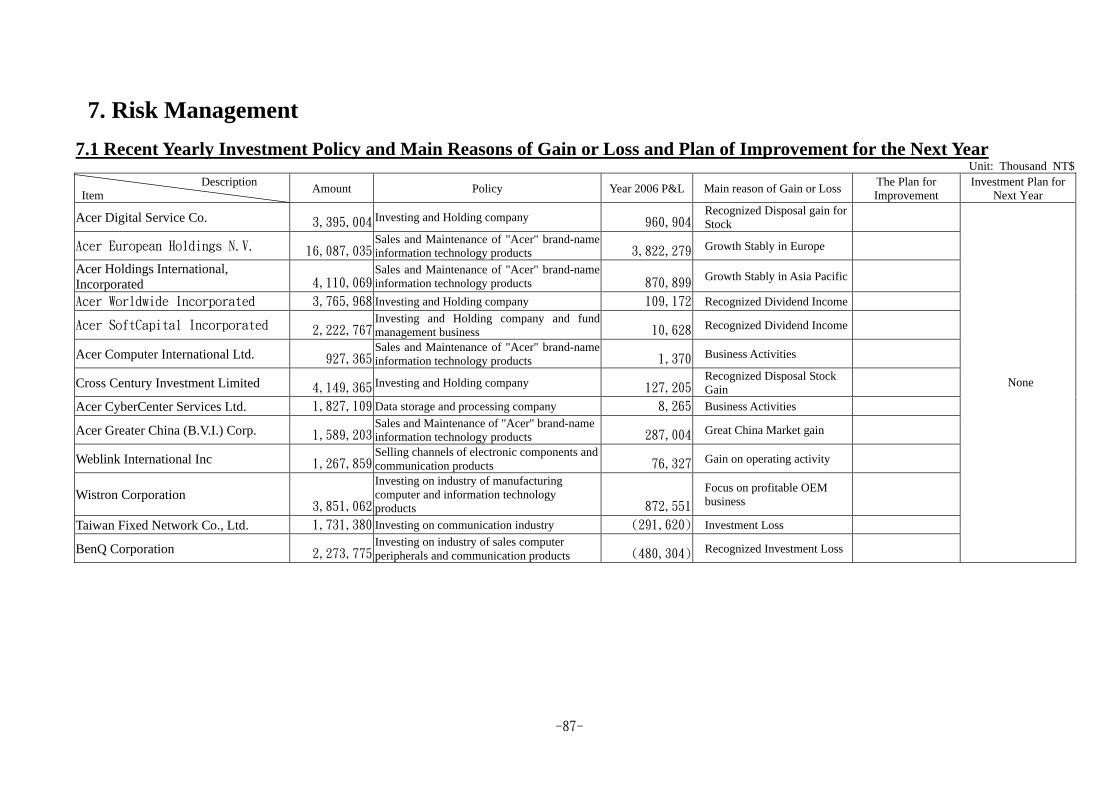
7. Risk Management 7.1 Recent Yearly Investment Policy and Main Reasons of Gain or Loss and Plan of Improvement for the Next Year
Unit: Thousand NT$ Description Item Amount Policy Year 2006 P&L Main reason of Gain or Loss The Plan for
Improvement Investment Plan for
Next Year
Acer Digital Service Co. 3,395,004 Investing and Holding company 960,904Recognized Disposal gain for Stock
Acer European Holdings N.V. 16,087,035Sales and Maintenance of "Acer" brand-name information technology products 3,822,279 Growth Stably in Europe
Acer Holdings International, Incorporated 4,110,069
Sales and Maintenance of "Acer" brand-name information technology products 870,899 Growth Stably in Asia Pacific
Acer Worldwide Incorporated 3,765,968 Investing and Holding company 109,172 Recognized Dividend Income
Acer SoftCapital Incorporated 2,222,767Investing and Holding company and fund management business 10,628 Recognized Dividend Income
Acer Computer International Ltd. 927,365Sales and Maintenance of "Acer" brand-name information technology products 1,370 Business Activities
Cross Century Investment Limited 4,149,365 Investing and Holding company 127,205Recognized Disposal Stock Gain
Acer CyberCenter Services Ltd. 1,827,109 Data storage and processing company 8,265 Business Activities
Acer Greater China (B.V.I.) Corp. 1,589,203Sales and Maintenance of "Acer" brand-name information technology products 287,004 Great China Market gain
Weblink International Inc 1,267,859Selling channels of electronic components and communication products 76,327 Gain on operating activity
Wistron Corporation 3,851,062
Investing on industry of manufacturing computer and information technology products 872,551
Focus on profitable OEM business
Taiwan Fixed Network Co., Ltd. 1,731,380 Investing on communication industry (291,620) Investment Loss
BenQ Corporation 2,273,775Investing on industry of sales computer peripherals and communication products (480,304) Recognized Investment Loss
None
-88-
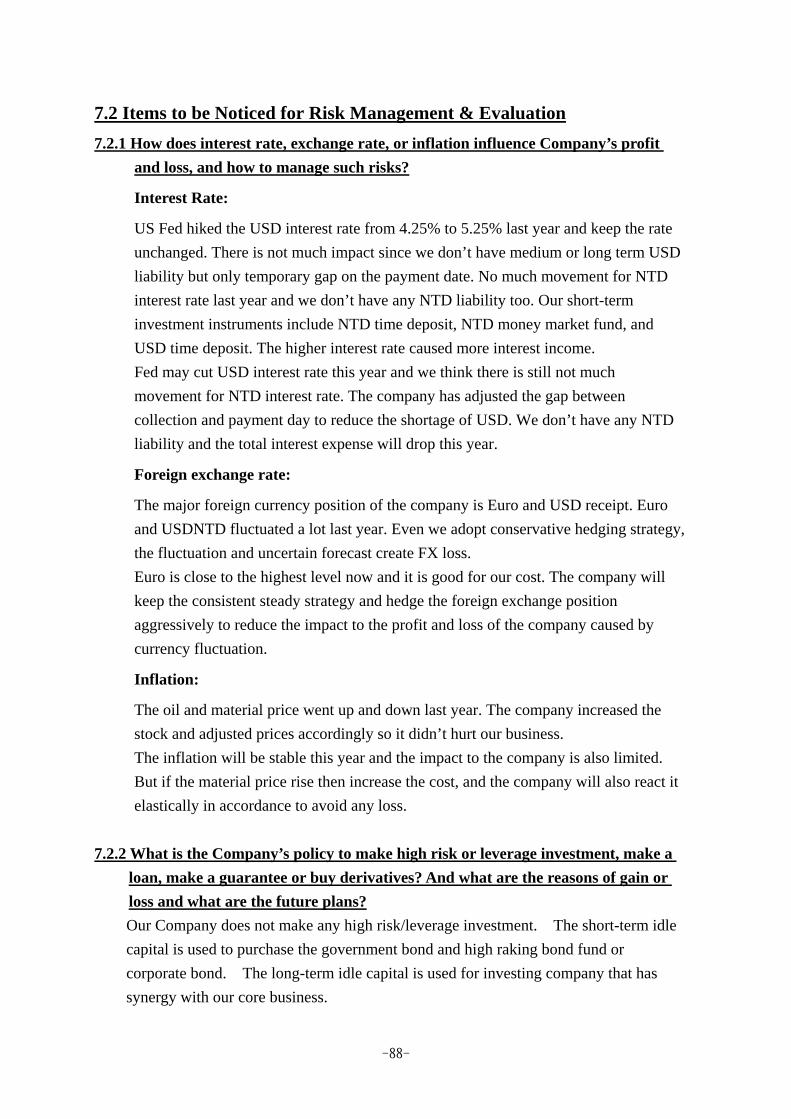
7.2 Items to be Noticed for Risk Management & Evaluation 7.2.1 How does interest rate, exchange rate, or inflation influence Company’s profit
and loss, and how to manage such risks?
Interest Rate:
US Fed hiked the USD interest rate from 4.25% to 5.25% last year and keep the rate unchanged. There is not much impact since we don’t have medium or long term USD liability but only temporary gap on the payment date. No much movement for NTD interest rate last year and we don’t have any NTD liability too. Our short-term investment instruments include NTD time deposit, NTD money market fund, and USD time deposit. The higher interest rate caused more interest income. Fed may cut USD interest rate this year and we think there is still not much movement for NTD interest rate. The company has adjusted the gap between collection and payment day to reduce the shortage of USD. We don’t have any NTD liability and the total interest expense will drop this year.
Foreign exchange rate:
The major foreign currency position of the company is Euro and USD receipt. Euro and USDNTD fluctuated a lot last year. Even we adopt conservative hedging strategy, the fluctuation and uncertain forecast create FX loss. Euro is close to the highest level now and it is good for our cost. The company will keep the consistent steady strategy and hedge the foreign exchange position aggressively to reduce the impact to the profit and loss of the company caused by currency fluctuation.
Inflation:
The oil and material price went up and down last year. The company increased the stock and adjusted prices accordingly so it didn’t hurt our business. The inflation will be stable this year and the impact to the company is also limited. But if the material price rise then increase the cost, and the company will also react it elastically in accordance to avoid any loss.
7.2.2 What is the Company’s policy to make high risk or leverage investment, make a
loan, make a guarantee or buy derivatives? And what are the reasons of gain or loss and what are the future plans? Our Company does not make any high risk/leverage investment. The short-term idle capital is used to purchase the government bond and high raking bond fund or corporate bond. The long-term idle capital is used for investing company that has synergy with our core business.
-89-
Aside from the 100% owned subsidiary, our Company preferably does not loan and provide corporate guarantee to others. The Company complies all the internal procedures whenever it is necessary to make loan or grant corporate guarantee to other third parties. Until Dec. 31, 2006, our Company had granted corporate guarantees of NT $7,467 million and the usage was NT $2,844 million. LTSC is the mainly firm that the Company grants guarantee for the entity that is not 100% owned. Until the Dec. 31, 2006, the usage of corporate guarantee granting LTSC was NT $308 million. The Company ideally does not engage any derivatives trading except for hedging. The Company complies all the internal procedures whenever it is necessary to engage such trading.
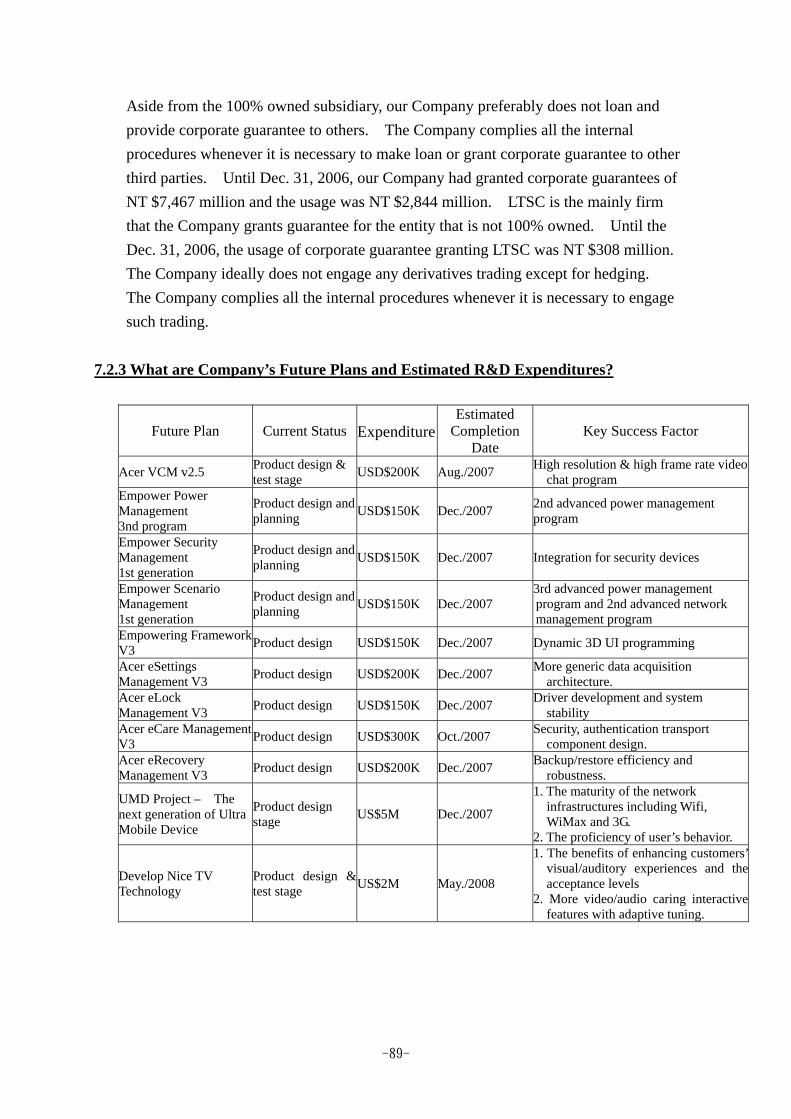
7.2.3 What are Company’s Future Plans and Estimated R&D Expenditures?
Future Plan Current Status ExpenditureEstimated
Completion Date
Key Success Factor
Acer VCM v2.5 Product design & test stage USD$200K Aug./2007 High resolution & high frame rate video
chat program Empower Power Management 3nd program
Product design and planning USD$150K Dec./2007 2nd advanced power management
program
Empower Security Management 1st generation
Product design and planning USD$150K Dec./2007 Integration for security devices
Empower Scenario Management 1st generation
Product design and planning USD$150K Dec./2007
3rd advanced power management program and 2nd advanced network management program
Empowering Framework V3 Product design USD$150K Dec./2007 Dynamic 3D UI programming
Acer eSettings Management V3 Product design USD$200K Dec./2007 More generic data acquisition
architecture. Acer eLock Management V3 Product design USD$150K Dec./2007 Driver development and system
stability Acer eCare Management V3 Product design USD$300K Oct./2007 Security, authentication transport
component design. Acer eRecovery Management V3 Product design USD$200K Dec./2007 Backup/restore efficiency and
robustness.
UMD Project – The next generation of Ultra Mobile Device
Product design stage US$5M Dec./2007
1. The maturity of the network infrastructures including Wifi, WiMax and 3G.
2. The proficiency of user’s behavior.
Develop Nice TV Technology
Product design & test stage US$2M May./2008
1. The benefits of enhancing customers’ visual/auditory experiences and the acceptance levels
2. More video/audio caring interactive features with adaptive tuning.
-90-
7.2.4 Will the changes of domestic and international policies or legislation have an impact on the Company’s finance or business, and how will the Company react to such changes?
Investment in Mainland China: The business opportunities exist in mainland Chinese market with high risk. The Company follows the government’s policy whenever it considers investing in China in order to reduce the risk and protect shareholders’ interests. To be in line with the Company’s strategy, its investment in China is mainly for working capital.
Corporate Governance: The financial scandals happened past few years have had serious impact to the financial markets and investors as well. The Company has accordingly followed the government’s requirements to facilitate the corporate governance in order to protect the shareholders’ interests.
7.2.5 What are the financial impact and action plan of technology innovation and
industry development? The Company is a branding company with a main mission to empower technology for people. The products are developed to be in line with the mainstream technology and high added value concept. The Company has outsourced the manufacturing to other suppliers to focus on branding/marketing, and its competitiveness is also improving due to the increasing size of economic scale. The Company also cooperates with first tier distributors to boost sales and profits.
7.2.6 How corporate image change affects the Company’s risk management
mechanism? What are the Company’s action plans? The Company had split off its manufacturing division at the end of year 2000 in order to focus on the design and marketing of IT products and services. The potential crises within manufacturing and marketing companies are very different, and the Company’s crisis management now focuses on our global supply-chain and logistics. By outsourcing our manufacturing sector to multiple vendors and suppliers, the Company gained greater flexibility in inventory control and lowered risks compared to a single-vendor policy. With the ever-changing global economy, it is essential to be prepared for risks and challenges at all times. The Company’s risk management team has a clear sense of crisis management and has taken the precautions when necessary. We have set up a crisis mechanism that will minimize potential damages when running into crises and ensure the Company’s sustainable management.

-91-
7.2.7 What are the predicted benefits and potential risks to the Company during the mergers?
Not applicable.
7.2.8 What are the predicted benefits and potential risk to the Company when it expands its factories and offices?
Not applicable.
7.2.9 What are the potential risks to the Company during buy and sales?
NONE
7.2.10 How shares transfer made by directors, supervisors or shareholders with 10% or more shareholdings affect the Company?
Not applicable.
7.2.11 What are the impact and potential risks when the Company changes management team?
Not applicable.
7.2.12 The major litigious, non-litigious or administrative disputes that: (1) involve Acer and/or any Acer director, any Acer supervisor, the general manager, any person with actual responsibility for the firm, any major shareholder holding a stake of greater than 10 percent, and/or any company or companies controlled by Acer; and (2) have been concluded by means of a final and unappealable judgment, or are still under litigation. Where such a dispute could materially affect shareholders' equity or the prices of the company's securities, the facts of the dispute, amount of money at stake in the dispute, the date of litigation commencement, the main parties to the dispute, and the status of the dispute as of the date of printing of this annual report shall be disclosed as follows: 1. Hewlett-Packard Development Company filed patent infringement lawsiuts against
Acer Inc. and its US subsidiary, Acer America Corporation, with pending before the United States District Court for the Eastern District of Texas and United States
-92-
International Trade Commission. An US law firm has been retained to conductconsult with and represent Acer on the matters. At this moment, it is not realistic to reasonably estimate the relative financial impact toward Acer; however, there is no immediately material adverse effect toward Acer’s business operations.
2. In annual 2006 and as of the date of printing of this annual report, any Acer director, supervisor, the general manager, any person with actual responsibility for the firm, any major shareholder holding a stake of greater than 10 percent were not involved in any material litigious, non-litigious or administrative disputes.
3. In annual 2006 and as of the date of printing of this annual report, any company or companies controlled by Acer were not involved in any material litigious, non-litigious or administrative disputes.
7.2.13 Other Risks:
NONE
Note: The English version of this document had been prepare for the convenience of the
readers, and in the event of any discrepancy between the Chinese and Enblish versions hereof, the Chinese version shall govern.