1 Multilevel modeling of educational longitudinal data with crossed random effects Minjeong Jeon...
20
1 Multilevel modeling Multilevel modeling of educational longitudinal data of educational longitudinal data with crossed random effects with crossed random effects Minjeong Jeon Sophia Rabe-Hesketh University of California, Berkeley 2008 Fall North American Stata Users Group meeting Nov. 13. 2008
-
Upload
celina-ryle -
Category
Documents
-
view
223 -
download
1
Transcript of 1 Multilevel modeling of educational longitudinal data with crossed random effects Minjeong Jeon...

1
Multilevel modeling Multilevel modeling
of educational longitudinal data of educational longitudinal data
with crossed random effects with crossed random effects
Minjeong JeonSophia Rabe-Hesketh
University of California, Berkeley
2008 Fall North American Stata Users Group meeting
Nov. 13. 2008

Motivation: How to model this Motivation: How to model this data?data?
2
Middle School
Hish
School
Student
time1 time3time2 time4
Longitudinal cross-classified Longitudinal cross-classified data data
Longitudinal data -Repeated observations within students
Promotion to high school-First two years in middle school-Last two years in high school

Diagram: Diagram: Longitudinal cross-classified Longitudinal cross-classified data data
3
T1,..T4: Time(wave), Stu: students
MS: middle school , HS: high school
MS HS
Stu
Time
Rasbash et al. (2005; 2008)
MS HS
Stu
T1 T2 T3 T4
MS HS
Stu
T1 T2 T3 T4
Jeon &Rabe-Hesketh
<1>
<2>
<3>

Purpose of the studyPurpose of the study
Propose three modeling strategies Propose three modeling strategies Estimate crossed random effects crossed random effects of
middle school (MS) and high school (HS) By xtmixedxtmixed in Stata
★★Key point !Key point ! Impacts of MS and HS random effects MS and HS random effects
change over time change over time
4

DataData
Source: Source: The Korea Youth Panel Survey (KYPS) (http://www.nypi.re.kr/panel/index.asp)
Prospective panel survey: (2003-2006 year)
Middle school 2nd(8th graders), Age(m) =13
Sample design: Stratified multi-year cluster
sampling
5

More about the dataMore about the data
6
Summary statisticsSummary statistics: Number of schools & students

Data: Crossed structureData: Crossed structure
7
Cross-classification between MS Cross-classification between MS and HSand HSMS idMS id
HS idHS id

More about the crossed More about the crossed structure structure
8
Number of high schools within middle school Number of high schools within middle school
Number of MS
per HS:1~5
Number of HS
per MS:2~17

School area informationSchool area information
9
Maximum number of MS per area = 21
Maximum number of HS per area = 175
15 Areas that students do not “cross” when moving 15 Areas that students do not “cross” when moving from MS to HS from MS to HS

Study variablesStudy variables
10
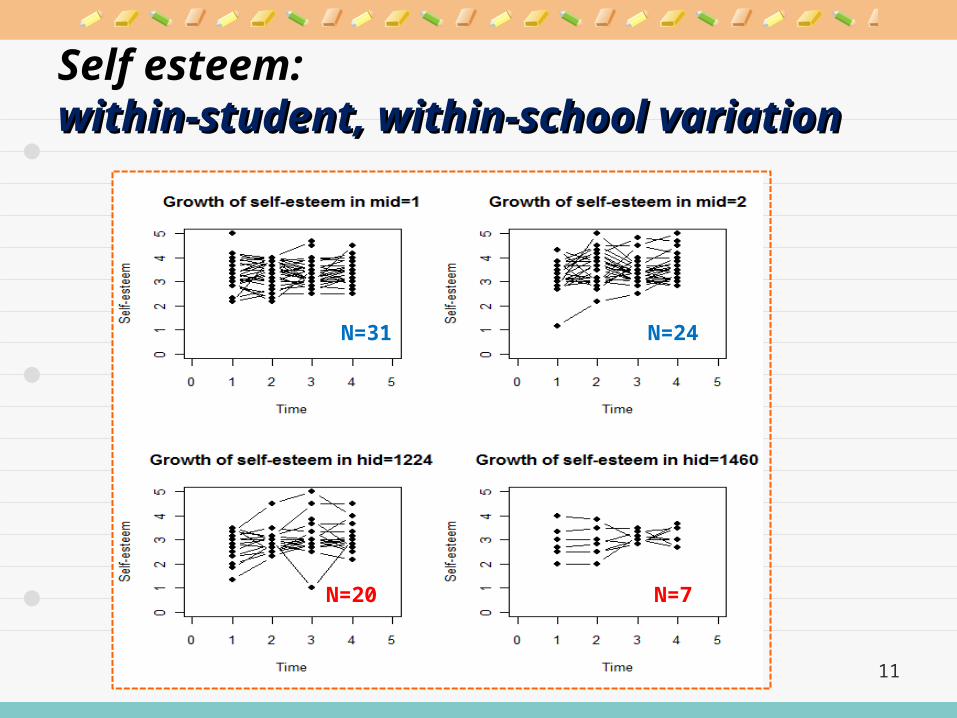
Self esteem: within-student, within-school within-student, within-school variation variation
11
N=31 N=24
N=20 N=7

12
Model specification: Model1Model specification: Model1
MS HS
Stu
T1 T2 T3 T4
Trick 1Trick 1

Model specification: Model1Model specification: Model1
13
Trick 2Trick 2

Using a trick? Using a trick?
14
Exactly same results!
(from model1)

Modeling strategiesModeling strategies
15

Stata commandsStata commands
16

Results: Random effectsResults: Random effects
17
Random intercept Random intercept model model

FixedFixed effectseffects
18
Increase over time
Decrease in the increase
(From model 1)

DiscussionDiscussion
Use a trick Use a trick for computational computational efficiency efficiency
Need an easy way to handle to handle random slopes in cross-classified random slopes in cross-classified modelmodel
Future work:
Find weights empirically Find weights empirically 19

20
Thank you very much!Thank you very much!
ContactContactMinjeong Jeon ([email protected])
Sophia Rabe-Hesketh([email protected])
Graduate School of Education
University of California, Berkeley