
1 molecular shape, architecture and size of p2x4 receptors ...
21
1 MOLECULAR SHAPE, ARCHITECTURE AND SIZE OF P2X 4 RECEPTORS DETERMINED USING FLUORESCENCE RESONANCE ENERGY TRANSFER AND ELECTRON MICROSCOPY Mark T Young *¶ , James A Fisher † , Samuel J Fountain ‡ , Robert C Ford * , R Alan North ‡ and Baljit S Khakh †§¶¶ From * Manchester Interdisciplinary Biocentre, University of Manchester, 131 Princess Street, Manchester, M1 7DN, UK, † MRC Laboratory of Molecular Biology, Hills Road, Cambridge, CB2 0QH, UK, ‡ Faculty of Life Sciences, University of Manchester, Oxford Road, Manchester, M13 9PT, UK and § Departments of Physiology and Neurobiology, David Geffen School of Medicine, University of California Los Angeles, CA 90095, USA. Running head: Molecular shape, architecture and size of P2X 4 receptors Address correspondence to: Baljit S. Khakh Departments of Physiology and Neurobiology David Geffen School of Medicine, University of California Los Angeles, CA 90095, USA. [email protected] P2X receptors are ATP-gated non-selective cation channels with important physiological roles. However, their structures are poorly understood. Here we analyzed the architecture of P2X receptors using fluorescence resonance energy transfer (FRET) microscopy and direct structure determination using electron microscopy. FRET efficiency measurements indicated that the distance between the C- terminal tails of P2X 4 receptors was 5.6 nm. Single particle analysis of purified P2X 4 receptors was used to determine the three- dimensional structure at a resolution of 21 Å; the orientation of the particle with respect to the membrane was assigned by labeling the intracellular C-termini with 1.8 nm gold particles, and the carbohydrate-rich ecto- domain with lectin. We found that human P2X 4 is a globular torpedo-like molecule with an approximate volume of 270 nm 3 , with a compact, propeller-shaped ecto-domain. In this structure the distance between the centers of the gold particles was 6.1 nm, which closely matches FRET data. Thus our data provide the first views of the architecture, shape and size of single P2X receptors, furthering our understanding of this important family of ligand-gated ion channels. P2X receptors, of which seven subtypes are found in mammals, display a diverse tissue distribution and play key roles in a variety of physiological processes such as neurotransmission, sensory transduction, inflammation and cardiovascular regulation (1-3). They are mostly found on the plasma membrane, but in some species such as Dictyostelium may also fulfil physiological functions within intracellular membranes (4). They comprise the third major superfamily of ligand-gated ion channels; however, in contrast to other cationic channel superfamilies (5-7), very little is known about their three- dimensional structure. The topology of P2X receptors is well-defined; each monomer subunit is predicted to possess intracellular N- and C-termini, two transmembrane- spanning domains and a large ecto-domain (2). The functional channel unit is thought to be a trimer (8- 11), a feature which is shared with acid-sensing ion channels (12). A low-resolution structural study of the rat P2X 2 isoform has been published; electron microscopy of single particles gave rise to a structure with a volume of approximately 1200nm 3 (13). However, the orientation of the molecule was not assigned and there was no independent evidence to verify the dimensions. Moreover, atomic force microscopy studies suggest a smaller molecular volume at 490nm 3 . However, these studies model the channel as a flat spherical cap with a height of 2.9 nm (10,14). Because the thickness of plasma membrane is ~7nm this implies that the AFM studies report on molecules in a squashed conformation (10,14). Thus the available data do not provide a consistent or satisfying view of the shape, architecture or size of P2X receptors. To further our structural knowledge of P2X receptors, and to address the above discrepancies in estimates of molecular volume and size, we have explored two parallel experimental approaches. First, we have measured the efficiency of fluorescence-resonance energy transfer (FRET) between subunits within homomeric P2X receptors http://www.jbc.org/cgi/doi/10.1074/jbc.M804458200 The latest version is at JBC Papers in Press. Published on July 17, 2008 as Manuscript M804458200 Copyright 2008 by The American Society for Biochemistry and Molecular Biology, Inc. by guest on February 12, 2018 http://www.jbc.org/ Downloaded from
Transcript of 1 molecular shape, architecture and size of p2x4 receptors ...

1
MOLECULAR SHAPE, ARCHITECTURE AND SIZE OF P2X4 RECEPTORS DETERMINED USING FLUORESCENCE RESONANCE ENERGY TRANSFER AND
ELECTRON MICROSCOPY Mark T Young*¶, James A Fisher†, Samuel J Fountain‡, Robert C Ford*, R Alan North‡ and
Baljit S Khakh†§¶¶
From *Manchester Interdisciplinary Biocentre, University of Manchester, 131 Princess Street, Manchester, M1 7DN, UK, †MRC Laboratory of Molecular Biology, Hills Road, Cambridge, CB2
0QH, UK, ‡Faculty of Life Sciences, University of Manchester, Oxford Road, Manchester, M13 9PT, UK and §Departments of Physiology and Neurobiology, David Geffen School of Medicine,
University of California Los Angeles, CA 90095, USA. Running head: Molecular shape, architecture and size of P2X4 receptors
Address correspondence to: Baljit S. Khakh Departments of Physiology and Neurobiology David Geffen School of Medicine, University of California Los Angeles, CA 90095, USA.
P2X receptors are ATP-gated non-selective cation channels with important physiological roles. However, their structures are poorly understood. Here we analyzed the architecture of P2X receptors using fluorescence resonance energy transfer (FRET) microscopy and direct structure determination using electron microscopy. FRET efficiency measurements indicated that the distance between the C-terminal tails of P2X4 receptors was 5.6 nm. Single particle analysis of purified P2X4 receptors was used to determine the three-dimensional structure at a resolution of 21 Å; the orientation of the particle with respect to the membrane was assigned by labeling the intracellular C-termini with 1.8 nm gold particles, and the carbohydrate-rich ecto-domain with lectin. We found that human P2X4 is a globular torpedo-like molecule with an approximate volume of 270 nm3, with a compact, propeller-shaped ecto-domain. In this structure the distance between the centers of the gold particles was 6.1 nm, which closely matches FRET data. Thus our data provide the first views of the architecture, shape and size of single P2X receptors, furthering our understanding of this important family of ligand-gated ion channels.
P2X receptors, of which seven subtypes are found in mammals, display a diverse tissue distribution and play key roles in a variety of physiological processes such as neurotransmission, sensory transduction, inflammation and cardiovascular regulation (1-3). They are mostly found on the plasma membrane, but in some
species such as Dictyostelium may also fulfil physiological functions within intracellular membranes (4). They comprise the third major superfamily of ligand-gated ion channels; however, in contrast to other cationic channel superfamilies (5-7), very little is known about their three-dimensional structure.
The topology of P2X receptors is well-defined; each monomer subunit is predicted to possess intracellular N- and C-termini, two transmembrane-spanning domains and a large ecto-domain (2). The functional channel unit is thought to be a trimer (8-11), a feature which is shared with acid-sensing ion channels (12). A low-resolution structural study of the rat P2X2 isoform has been published; electron microscopy of single particles gave rise to a structure with a volume of approximately 1200nm3 (13). However, the orientation of the molecule was not assigned and there was no independent evidence to verify the dimensions. Moreover, atomic force microscopy studies suggest a smaller molecular volume at 490nm3. However, these studies model the channel as a flat spherical cap with a height of 2.9 nm (10,14). Because the thickness of plasma membrane is ~7nm this implies that the AFM studies report on molecules in a squashed conformation (10,14). Thus the available data do not provide a consistent or satisfying view of the shape, architecture or size of P2X receptors.
To further our structural knowledge of P2X receptors, and to address the above discrepancies in estimates of molecular volume and size, we have explored two parallel experimental approaches. First, we have measured the efficiency of fluorescence-resonance energy transfer (FRET) between subunits within homomeric P2X receptors
http://www.jbc.org/cgi/doi/10.1074/jbc.M804458200The latest version is at JBC Papers in Press. Published on July 17, 2008 as Manuscript M804458200
Copyright 2008 by The American Society for Biochemistry and Molecular Biology, Inc.
by guest on February 12, 2018http://w
ww
.jbc.org/D
ownloaded from

2
bearing yellow- or cyan-fluorescent protein (YFP and CFP) tags at their C-termini. Extensive previous studies by us and others have employed GFP labeled P2X receptors (15-25), demonstrating that tagging of P2X2, P2X4 and P2X5 receptors on the C termini with GFP does not affect receptor function. Second, we have over-expressed P2X4 in HEK293 cells and purified the trimer form to homogeneity. We used single particle analysis and domain-specific labeling to generate the three-dimensional structure of human P2X4 at a resolution of 21 Å, oriented with respect to the lipid bilayer.
Experimental procedures
Molecular and cell biology: The cell line used was HEK293 or HEK293T cells transiently expressing appropriate wild type (wt), and fluorescently labelled P2X receptor subunits. Some cDNAs were available from previous work (18-20), and others were generated using standard cloning procedures. The resulting plasmids were verified by sequencing (P2X1-P2X7, all tagged with either CFP or YFP). The plasmids were propagated in DH5α E. Coli. The plasmid encoding human P2X4 with a C-terminal EYMPME (EE) tag has been described previously (26). Human P2X4 containing a C-terminal deca-histidine tag was generated from this construct by PCR. HEK 293 cells (obtained from ATCC) were maintained in 75 cm2 cell culture flasks (Corning) in DMEM/F12 media with Glutamax (Invitrogen) supplemented with 10% fetal bovine serum and penicillin/streptomycin. Cells were grown in a humidified atmosphere of 95% air / 5% CO2, at 37 ºC in a cell culture incubator. The cells were split 1 in 10 when confluence reached 60-90%, which was generally every 4 days. Cells were prepared for transfection by plating onto 6-well plates at the time of splitting, 3-4 days before transfection. They were transfected at ~60% confluence. For transient expression in HEK-293 we used 0.5-1 µg plasmid cDNA and the Effectene transfection reagent (Qiagen) for each well of a 6 well plate. The manufacturer’s instructions were followed, with 4 μl of enhancer and 10 μl of Effectene used for each transfection. The transfection efficiency was 40-60%. The HEK293 stable cell line constitutively expressing human P2X4(His)10 was generated using electroporation and selection with 400 μg/ml G418 (Invitrogen, Paisley, UK) for 14 days in 15 cm culture dishes. Single colonies were isolated using
sterile greased stainless steel rings, trypsin-treated and transferred to 24-well plates. Expression of P2X4(His)10 was verified by Western blotting according to standard protocols, and the highest-expressing clone was selected for over-expression.
Epifluorescence FRET microscopy: We have previously described the set up (19). We used an Olympus BX50 microscope equipped with a Peltier cooled (-15°C) Imago CCD camera (640X480 pixels; each pixel 9.9x9.9 μm), epifluorescence condenser, control unit (containing ISC and PDC boards) and the Polychrome IV monochromator (all from Till Photonics). The light from the monochromator was led to the microscope through a quartz fiber light guide. The hardware was controlled by a personal computer, an appropriate frame grabber (TILL Photonics), and macros driven by TILLvisION v3.3 software. The cells were viewed with a 40X water immersion objective lens with a numerical aperture of 0.8 (Olympus). We used the following filters for acquiring CFP or YFP images (all from Glen Spectra, Stanmore, UK; order is dichroic, emitter in nm): CFP (455DRLP, 480AF30) and YFP (525DRLP, 545AF35). To photo destroy the YFP we used 525 nm light from the monochromator, and a 525 DRLP dichroic. Electrophysiology: HEK 293 cells were used for recordings 24–48 h post transfection. Cells were gently mechanically dispersed and plated onto glass coverslips 2-12 hrs before use. We included this step (27) to ensure adequate voltage clamp during reversal potential measurements from single spherical cells. The extracellular recording solution comprised (mM) NaCl 150, MgCl2 1, CaCl2 1 (or 0.1), HEPES 10 and glucose 10 (pH 7.4), and the pipette solution comprised (mM) NaCl (or CsCl or CsF) 154, EGTA 11 and HEPES 10. Whole-cell voltage clamp recordings were made with ~4 MΩ borosilicate glass electrodes (World Precision Instruments), using an Axopatch-1D or Axopatch 200 amplifier controlled by a computer running pCLAMP 8.1 or 10 software via a Digidata 1322 interface (Molecular Devices). Data were filtered at 0.5-2 kHz and digitised at 1-5 kHz. Drugs were applied to single cells by pressure-ejection using a Picospritzer (Intracell Ltd) or in the bathing medium, which flowed at 2-3 ml/min. For pressure application (~20 psi; 1 psi = 6.89 kPa) we used 2-4 MΩ pipettes as previously described (21): solution exchange occurred in ~10 ms.
by guest on February 12, 2018http://w
ww
.jbc.org/D
ownloaded from

3
Protein purification: Membrane fractions were prepared from 2.5 x 10⁸ cells and solubilised in phosphate-buffered saline (PBS) containing 1% (w/v) β-D-dodecyl maltoside (DDM; Merck, Nottingham, UK) and protease inhibitors (Complete-EDTA, Roche)). Samples were diluted into buffer A (150 mM NaCl, 20 mM sodium phosphate pH 7.4, 150 mM imidazole, 0.1% (w/v) DDM) and incubated overnight at 4 ºC with nickel-sepharose beads (Amersham, Chalfont St. Giles, UK) to capture His-tagged protein. Beads were packed into columns and washed with 20 column volumes of buffer A; 50 % pure His-tagged protein was eluted in buffer A containing 500 mM imidazole. Purification of P2X4 trimers: 1 ml protein-containing fractions from the nickel-affinity column were concentrated using 50 kDa cut-off filters (Millipore, Watford, UK) and separated using PFO-PAGE according to published methods (28). For preparative PFO-PAGE, samples were loaded onto 1.5 mm-thick 8% (w/v) polyacrylamide gels and run at 4 ºC at 10 mA. P2X4 trimers (150-180kDa) were excised from non-stained gels, placed into 2 ml D-tube dialysis units (Merck) and protein was eluted at 60 V for 2 h at 4 ºC. Protein samples were diafiltered into PBS containing 0.1% (w/v) DDM. Gold and lectin labeling: For gold-labeling, purified P2X4(His)10 in 0.1% DDM was incubated for 10 minutes at room temperature with a 10:1 molar excess of 1.8 nm diameter Ni-NTA nanogold particles (Nanoprobes, NY). Samples were adsorbed on to grids and washed with nanogold suspension to prevent unbinding of the protein-associated gold particles. For lectin labeling, purified P2X4(His)10 in 0.1% DDM was mixed with Lens culinaris lectin (Sigma, Poole, UK) at a molar ratio of 1:1 and immediately applied to grids. After TEM and image processing, 1966 gold-labelled P2X4(His)10 particles (in 48 x 48 pixel boxes) and 2862 lectin-labeled particles (in 64 x 64 pixel boxes) were manually selected. 3D structures were generated using the refined P2X4 structure as a starting model with 8 rounds of iterative refinement. Structure determination by electron microscopy and single particle analysis: Protein samples (20 μg/ml) were adsorbed to glow-discharged carbon-
coated copper grids and negatively stained with 2% (w/v) uranyl acetate. Transmission electron microscopy (TEM) images were recorded on to Kodak SO-163 film at 43500 x calibrated magnification using a Tecnai 10 operating at 100 kV. Images were digitized using a UMAX 2000 Powerlook scanner at 1200 pixels per inch, providing a specimen level increment of 4.87 Å/pixel. EMAN software (29) was used to manually select, filter and process 6826 particles in 48 x 48 pixel boxes. Using the command ‘startcsym’, we compared the best match of the 2D reference-free class averages with symmetrised classes, using C2, C3, C4, C5 and C6 symmetry (Fig. 3E). C3 symmetry provided the best fit to the data, and so a start model was generated from a manually selected set of reference-free class averages with C3 symmetry applied using the command ‘startAny’; this model was refined by 12 rounds of iterative projection matching using the ‘refine’ command. FSC analysis of the final iteration using comparison of structures generated from even or odd-numbered particles (‘eotest’; Fig. 3D) indicated a final resolution of approximately 21 Å. Structures were displayed at volume shells corresponding to at least 3 standard deviations above the mean density. Imaging data analysis: For donor de-quenching experiments the FRET efficiency (e) was calculated as 100])/[1( ×−= −− afterCbeforeC IIe , where IC-before is the donor fluorescence intensity before photo destruction and IC-after is the intensity after photo destruction. The photo destruction of the YFP proceeds with a kinetics similar to the de-quenching of the donor (Fig. 1C), and plotting the photo recovery versus photo destruction yields a linear plot (Fig. 2). We used such linear plots and extrapolated to 100% acceptor photodestruction to calculate the maximum donor de-quenching for epifluorescence microscopy: e is given by the Y-axis intercept. In a specific set of experiments we also calculated FRET e from just one point of photodestruction and extrapolated to 100% destruction. We did this to ensure that the estimates of e were not affected by the method used to measure FRET (Fig 4), particularly for P2X1 and P2X7 receptors (see Results).
To approximate distances we used the Förster equation
by guest on February 12, 2018http://w
ww
.jbc.org/D
ownloaded from
4
66
6
RRRe
O
O
+= where
DADO JnR φκ 42236 )1079.8( −×= and e is the experimentally determined FRET efficiency and R is the distance between donor and acceptor fluorophores (30,31). R0 includes terms for the donor quantum efficiency (φD), the solvent refractive index (n), overlap of the donor emission and acceptor absorption spectra (JDA) and the orientation factor (κ2). R0 is the distance at which e is 50% for any given fluorophore pair. In the case of CFP and YFP this is ~50 Å (5 nm). Importantly, R0 contains a term for the fluorophore dipole orientation factor (κ2), which at 2/3 assumes random tumbling of the fluorophores (30). This means that R0, and the distance measurements reported here, assume that the fluorophores adopt all spherically random orientations. Given that we do not know the relative orientation of the fluorophores on P2X2 channels assuming a κ2 value of 2/3 seems appropriate (30). When interpreting FRET e measurements in terms of distance it is important to consider that in the case of CFP and YFP the fluorophore is buried in the centre of a β-can of dimensions 30 Å width and 45 Å length (32). A further consideration is that we do not know the absolute ratio of donors to acceptors during FRET at the single molecule level. We have previously considered these issues in depth (18,19). For the FRET experiments we chose plasma membrane regions of interest (ROI) post hoc. Our criteria were that ROI (i) were bright in both CFP and YFP images, (ii) located at the edge, presumably plasma membrane of the cell, (iii) did not change or drift in intensity during the control period, and (iv) remained in focus during the entire experiment.
RESULTS
Tagged P2X receptors are functional: In past work it has been demonstrated that P2X2, P2X4 and P2X5 receptors tagged on their C termini with GFP function like their wild type counterparts in terms of ATP-evoked currents and ATP sensitivity (15-25). We started by recording ATP-evoked currents from HEK cells expressing CFP and YFP tagged P2X receptors and compared the responses to wt P2X receptors (Fig. 1). Receptor function was preserved for all receptors and the kinetics of their activation, desensitization and deactivation was not detectably affected for some receptors. In a later
section and in Fig. 2 we present a detailed characterization of these parameters for P2X4 receptors. Thus as expected (3) YFP tagged P2X1 and P2X3 receptors desensitized rapidly (<1s), P2X2 and P2X4 receptors desensitized slowly (over tens of seconds) and P2X5 expressed poorly (100 μM ATP was used for activation). In the case of P2X7 receptors we recorded large variability in 30 μM Bz-ATP evoked currents. Thus in the case of the wild type or YFP tagged receptors the currents from single cells were either monophasic or biphasic and displayed slow and variable kinetics (3 exemplar traces are shown in Fig 1). These cell-to-cell differences for P2X7 receptors have been well documented and may represent permeability changes (33), variable phosphorylation (34), interactions with Pannexin-1 channels (35,36) or modulation by calmodulin (37). The focus of this study was not P2X7 receptors, so we can not yet discriminate between these possibilities. The key point here is that the wild type and YFP tagged P2X7 receptors show similar overall responses, but in future work it will be important to determine the most critical factors that contribute to P2X7 response variability. These overall features show that YFP tagging does not largely affect the functional properties of homomeric P2X receptors, or peak currents (Fig. 1). We did not carry out an extensive pharmacological analysis of each tagged receptor because this was not the focus of this study, and also because this has been reported already with GFP tagged P2X2, P2X4 and P2X5 receptors (15-25). Because the structure of CFP and YFP is similar to GFP, and because they differ by only a few residues (32) it is reasonable to surmise that receptors that can be tagged with GFP can also tolerate CFP and YFP without altering function. Published data show this was the case for P2X2 and P2X4 receptors (15,17,18,21,23-25). Functional properties of CFP and YFP tagged P2X4 receptors: In the remainder of this study we focused on homomeric P2X4 receptors and so we began by determining if CFP or YFP tagging affected the overall properties of P2X4 receptors (Fig 2A,B). Fig 2A shows average 100 μM ATP-evoked currents from cells expressing wild type P2X4, P2X4-YFP or P2X4-CFP receptors. The traces are shown as pA/pF, and clearly show that CFP or YFP tagging did not significantly affect the peak responses, or the overall shape of the ATP-evoked current waveforms (n=9). The bar graphs in
by guest on February 12, 2018http://w
ww
.jbc.org/D
ownloaded from
5
Fig 2A plot the average rise time (ms), % desensitization in 2s of ATP and decay time (ms) after ATP removal for wild type and CFP/YFP tagged P2X4 receptors. We next examined the ATP concentration-dependence of the ATP-evoked responses for wild type and CFP/YFP tagged receptors. Fig 2B shows that the concentration-response curves superimpose with EC50 values of ~3μM and Hill slopes of ~1.5 (n=8). These values are similar to previous work on wild type P2X4 receptors (38). Overall, our data with CFP and YFP tagged receptors reproduce past work with GFP-tagged P2X4 receptors, where it was demonstrated that GFP did not affect P2X4 responses (15). Receptor specific FRET for homomeric P2X receptors: In order to measure FRET efficiency (e) we studied homomeric P2X receptors tagged with CFP and YFP and expressed in single living HEK cells. We focused on plasma membrane regions of interest and used donor dequenching (30) to estimate FRET e for P2X receptors in these regions (19,39,40). In Fig. 2B-C we present representative images and graphs for P2X4-CFP/P2X4-YFP receptors. We measured a decrease in P2X4-YFP fluorescence intensity with a time course that followed that of the P2X4-CFP increase when the acceptor YFP was optically destroyed with 525nm light (Fig. 2C). Maximum P2X4-CFP photorecovery when P2X4-YFP was 100% photodestroyed
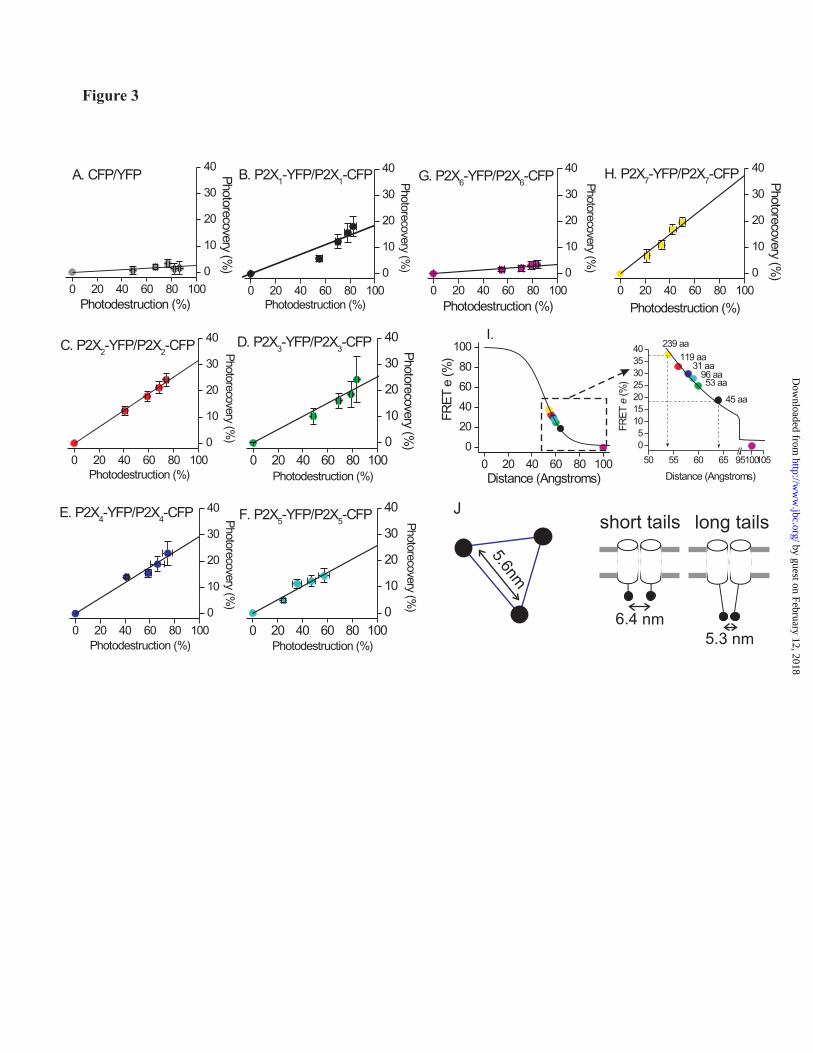
corresponds to FRET e, which in the case of P2X4-CFP/P2X4-YFP channels near the cell perimeter was 30 ± 5% (n=8). We repeated these experiments to establish the level of FRET noise that arises as CFP and YFP randomly approach a distance of ~20-70Å within the cell. The measured FRET efficiency for cytosolic CFP and YFP, as well as P2X6-CFP and P2X6-YFP receptors within HEK cells was ~3% (Fig. 3A). In these experiments we used P2X6 receptors as a negative control because they do not express in the plasma membrane and are unassembled (41). We next extended the work by measuring FRET e for all homomeric P2X receptors in plasma membrane regions. The donor dequenching plots are presented in Fig. 3. These experiments clearly establish that FRET e for receptors in plasma membrane regions is subunit specific. In the case of P2X6 receptors we could not measure FRET e for membrane regions because these channels are retained within the cell in intracellular compartments (41).
We explored the relationship between the experimentally determined FRET e for P2X receptors in the membrane to the dependence of FRET between CFP and YFP and inter fluorophore distance (in angstroms). For this comparison we used the Förster equation and an Ro value of 50 Å. The graph in Fig. 3I plots the FRET e for all homomeric P2X receptors on top of how FRET e falls (as 1/R6) with distance between the chromophores of CFP and YFP. The numbers next to the data points indicate the length of the cytosolic C tail for each of the receptors. From these data a trend is readily apparent. The FRET e for P2X receptors (and thus one assumes the inter fluorophore distance) is related to the length of the C tail. For instance the channels with the shortest C tails display the lowest FRET e (e.g. P2X1 and P2X3; C tail lengths of 44 and 42 residues), whereas the channels with the longest C tails lengths display the highest FRET e (e.g. P2X2 and P2X7; C tail lengths of 118 and 238 residues. P2X5 sits intermediate in this trend, consistent with its C tail being of intermediate length (96 residues). P2X4 with a C tail length of 33 residues is the receptor that is slightly shifted in the overall trend. Overall, our data show a surprising trend between FRET e for P2X receptors and the C tail length, implying that the distance between the tips of the C tails for P2X receptors near the membrane is larger than at the tips of those with longer tails. Put another way the cytosolic domain of P2X2 and P2X7 receptors narrows from its origins at the plasma membrane to its tip (Fig. 3J). Using this method the distance between the C tails of functional P2X4 receptors in the plasma membrane of single living cells was calculated to be 5.6 nm.
All of the FRET experiments shown in Fig 3 were carried out using identical imaging/analysis methods and in parallel to reduce any variability between experiments. In the case of P2X2, P2X3, P2X4, P2X5 and P2X6 receptors the data points were well fit by a straight line (Fig 3). However, in the case of P2X1 and P2X7 receptors the linear plots were less aesthetically pleasing. We could think of no precise scientific reason to discard these data and present them faithfully in Fig 3. The relevant issue here is whether the FRET e estimates for P2X1 and P2X7 receptors were adversely affected. To address this we specifically determined if estimates of FRET e were adversely affected by prolonged photodestruction that is needed for the linear plots in Fig 3. We measured FRET e for all
by guest on February 12, 2018http://w
ww
.jbc.org/D
ownloaded from
6
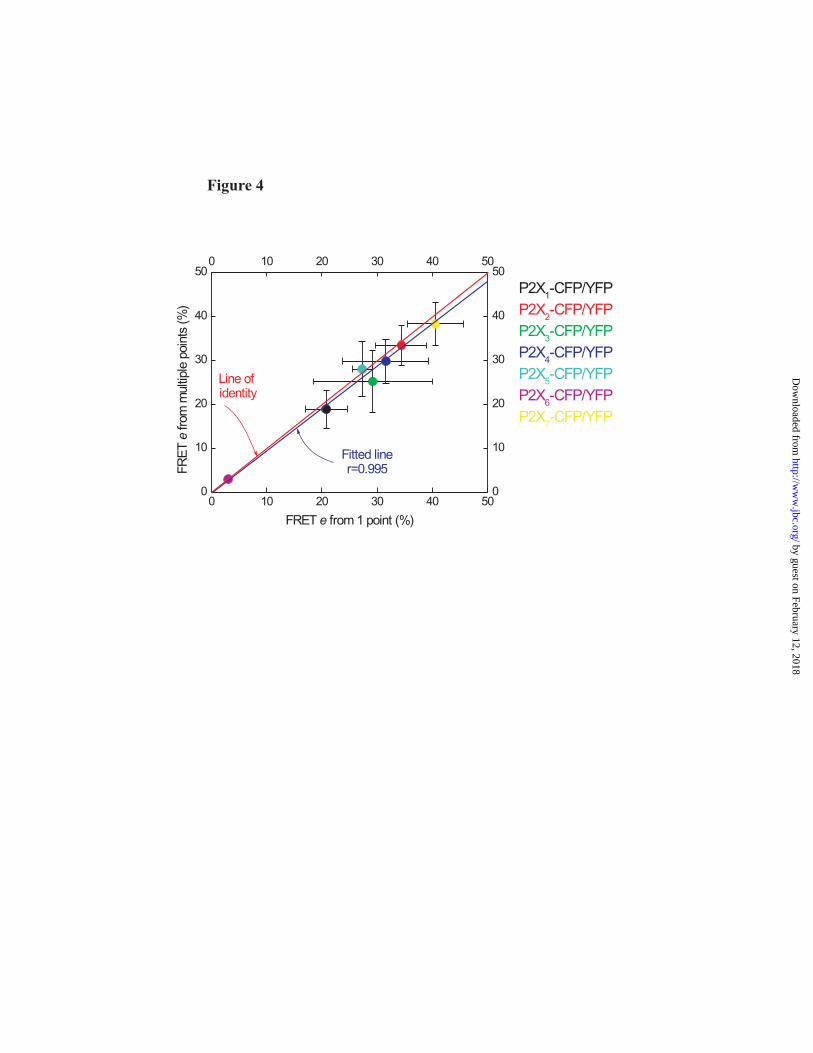
homomeric P2X receptors from only one point of photodestruction and compared the estimated FRET e values to those determined with extensive photodestruction (Fig 2C,D and Fig 3). Figure 4 shows that FRET values agree between these methods. Thus although there is some variability between P2X receptors in the extent to which the CFP photorecovery is fit by linear functions (compare plots in Fig 3) this does not under- or overestimate FRET e values. This is consistent with past work for a variety of FRET constructs, including P2X2 receptors, where we showed using 3-cube linear unmixing that FRET e could be reliably estimated by donor dequenching (18) (Figs 3 & 4).
We next sought to generate a three-dimensional structure of purified human P2X4 protein. Our reasoning was two-fold. First, because FRET is an ensemble measurement and makes a number of assumptions about the fluorophore orientations a three dimensional structure could be used to verify the FRET e measurements. Second, the estimates of distance by FRET may be used as a “barometer” to ascertain that the P2X4 structure was of a size appropriate for the channel in the membrane. This is important because the published single particle and AFM studies differ largely on the dimensions of P2X receptors (see Introduction).
Functional expression and purification of hP2X4(His)10 from HEK cells: The expression of hP2X4(His)10 was verified by Western blotting and compared with P2X4-EE (26). Both the C-terminal P2X4 epitope and the His-tag were readily detected and total protein expression levels appeared similar to those of P2X4-EE (not shown). Whole-cell currents were evoked by 2 s application of 1, 10 and 100 μM ATP in perforated-patch clamp configuration; peak current densities to 100μM ATP were 40 ± 4 pA/pF for P2X4-EE and 45 ± 6 pA/pF for P2X4(His)10 (n=8). EC50 values were 2.9 ± 0.2 μM for P2X4-EE and 2.7 ± 0.3 μM for P2X4(His)10 (n=8).
Following nickel-affinity chromatography, the majority of P2X4 eluted in the 500 mM imidazole fraction as a diffuse 55 kDa band. The size of the band was in agreement with that observed by Western blotting and purity was estimated to be approximately 50%. To purify P2X4 to homogeneity, we used non-denaturing perfluoro-octanoic acid polyacrylamide gel electrophoresis (PFO-PAGE) (28) followed by electro-elution.
When separated on PFO-PAGE, 50% pure P2X4 presented as three bands corresponding to monomer (55 kDa), a faint dimer (110 kDa) and trimer (165 kDa) (Fig. 5A). No higher-order oligomers were observed. We assumed that the observed monomers and dimers corresponded to immature, non-assembled proteins recovered from internal membranes. Trimers were selectively purified by excising bands from preparative, non-stained PFO-PAGE gels and eluting protein under an electric field. SDS-PAGE analysis of eluted protein demonstrated the high purity obtained using this purification method (Fig. 5B); the only bands visible on the silver-stained gel corresponded to P2X4 (SDS-stable dimer and trimer forms were also observed). In addition, PFO-PAGE of purified trimers was used to demonstrate that the trimeric form was stable after purification (Fig. 5C, arrow). After diafiltration into 0.1% (w/v) DDM, 40 μl of P2X4 was recovered at an approximate concentration of 1 mg/ml. Yield was estimated by comparing the band intensity of pure P2X4 on Coomassie-stained SDS-PAGE gels with known quantities of bovine serum albumin. In summary, 40μg pure P2X4 trimer was recovered from 2.5 x 10⁸ cells (equivalent to a confluent monolayer 5000cm2 in area).
Electron microscopy and single particle analysis: Pure protein was diluted to 25 μg/ml, applied to EM grids and negatively stained with 2% (w/v) uranyl acetate. An image field for wild-type human P2X4 is shown in Fig. 5D. Single particles of P2X4 receptor were relatively homogeneous, with the majority (approximately 70%) appearing either nearly circular, with a radius of approximately 8 nm, or nearly rectangular, with a short side of 8 nm and a long side of 12 nm. We interpreted these particles as either top/bottom view or side views respectively. In total, 6826 particles were manually selected in 48 x 48 pixel boxes for image processing using the EMAN software package (29). Reprojections of the C3-symmetrized 3D structure, paired with their corresponding unsymmetrized class averages, are shown in Fig. 5G. Representations of the structure of human P2X4 were generated and are shown in Fig. 5H. The resolution of the wild-type structure was approximately 21 Å as judged by Fourier shell correlation of structures calculated from sets of even- and odd-numbered particles (Fig. 5F).
by guest on February 12, 2018http://w
ww
.jbc.org/D
ownloaded from
7
Gold and lectin labeling: To orient our structure, the C-terminal His-tags of hP2X4 were labeled using 1.8 nm diameter Ni-NTA nanogold particles, washing our EM grids in a nanogold suspension to prevent unbinding during sample preparation. A high off-rate for this probe has recently been described (42). We selected 1966 particles with at least one gold particle attached. A sample field of view is displayed in Fig 6A. Reprojections of the C3-symmetrized 3D structure, paired with their corresponding unsymmetrized class averages, are shown in Fig. 6C. Gold particles were clearly visible, with some classes containing 2 attached gold particles per trimer. The gold-labeled particles were significantly smaller than the wild-type particles, most noticeably in areas near where the gold was bound, due to the strong negative density of the gold overshadowing the protein density within its vicinity.
The extensive glycosylation present on human P2X4 receptors enabled labelling of the ecto-domain with Lens culinaris lectin at a 1:1 molar ratio. Analysed by TEM, the single particles were heterogeneous (Fig 6B), which was expected considering the potential number of lectin binding sites per P2X4 molecule. 2862 particles were manually selected in 64 x 64 pixel boxes and reprojections of the C3-symmetrized 3D structure, paired with their corresponding unsymmetrized class averages, are shown in Fig. 6D.
3D structure of human P2X4 at 21 Å resolution: The overall shape of the molecule was globular and somewhat reminiscent of a torpedo (Fig. 5H); in the gold-labeled structure, three strong negative densities corresponding to the 1.8 nm-diameter gold spheres were clearly averaged into the density map towards the narrow end of the molecule (Fig. 6E), implying that the propeller-like structure at the top of the molecule corresponded to the ecto-domain. The distance between the centers of the gold particles was 6.1 nm (Fig 6E black arrow), which agrees well with the data from FRET experiments 5.6 nm; Fig 6E pink arrow). In confirmation that we had assigned the correct orientation, the lectin-labeled particle clearly displayed two regions of additional protein density per monomer at the propeller end of the molecule (Fig. 6F). The molecular mass of Lens culinaris lectin tetramers is 49kDa, but the additional volume observed in the labelled structure was smaller than expected for 3
tetramers. This is probably because lectin bound to P2X4 N-linked glycan chains present at different positions in the ectodomain, and furthermore flexibility of each glycan chain could also lead to a smearing out of the lectin location. Such variability would lead to some averaging out of the lectin location by single particle analysis, so that only the core of the lectin binding to P2X4 would be observed in the final structure.
At a threshold of 5.6σ above the mean density (Fig. 5H, dark blue inner core), the hP2X4 receptor ecto-domain displayed cavities with lateral fins running alongside them. This volume threshold corresponds to a molecular mass of 220 kDa and a volume of 270 nm3, allowing for one P2X4 trimer in addition to a detergent micelle (assuming a protein density of 1.35 g/ml, and no significant internal cavities within the structure). At 3σ above the mean density (Fig. 5F, blue outer core), the cavities disappeared, and the lateral fins were more pronounced. This density corresponds to a molecular mass of 410 kDa and a volume of 506 nm3. Our value for the molecular volume of human P2X4 of 270nm3 is consistent with the value of 409nm3 obtained for rat P2X2 using AFM imaging (10) (trimer masses of 165 kDa for human P2X4 and 210 kDa for rat P2X2). The transmembrane domains are most likely shrouded in a torus-shaped detergent micelle, which could explain the bulbous nature of the P2X4 3D structure in the region below the fins that we associate with the ecto-domain. However, we cannot rule out the possibility that regions of the ecto-domain re-enter the transmembrane region and contribute to the protein content of the transmembrane space.
DISCUSSION The main findings of this study are (i) we developed methods to over express P2X4 receptors for structural work, (ii) we determined the shape, architecture and size of a single human P2X receptor and (iii) we verified the dimensions with independent measurements using FRET. We initially chose to work on all homomeric P2X receptors using FRET microscopy and measured the proximity between their C tail tips at 5.3 to 6.4 nm. We then focused on P2X4 receptors for electron microscopy because of its favorable expression profile (43). The single particle studies provide data on the overall shape and size of a single P2X receptor, and on the
by guest on February 12, 2018http://w
ww
.jbc.org/D
ownloaded from
8
approximate distance between the C tail tips at 6.1 nm. The agreement for proximity between FRET and electron microscopy attests to the reliability of the methods. Förster theory of energy transfer makes several assumptions about the mutual orientation of the fluorophores (notably the κ2 value). In the usual case κ2 is taken to equal 2/3, which implies adoption of all spherically random orientations between the fluorophores (30). The agreement for distance estimates by FRET and single particle imaging suggests FRET is useful as a molecular caliper for membrane embedded P2X channels. This is consistent with previous pioneering FRET studies by Nashmi et al., (39) of neuronal nicotinic receptors, and comparisons of distance to the structural model of the muscle nicotinic receptor (19,39,40). One of the key issues in the P2X field is the need to obtain direct structural information for this novel class of membrane proteins. This is a non trivial issue because no P2X receptors have been found in bacteria, and there are no other receptors with similar structure based on sequence analysis. This calls for the development of approaches that can be used for the expression and purification of P2X receptors. In this work we have both developed an efficient expression and purification system for human P2X4, and significantly improved the quality and resolution of existing structural data available for P2X receptors. Our methods should also enable relatively straightforward purification of larger quantities of human P2X4 for higher-resolution structure studies. Preparative electrophoresis has been used extensively for the purification of membrane protein complexes (44), and, in at least one case, this method has yielded sufficient quantities for 3D crystallization (45). The use of our method, by us and others, will allow high resolution structural information on P2X receptors. Selective purification by preparative electrophoresis of a band corresponding in apparent molecular mass to a trimeric form of human P2X4 strongly suggested the application of C3 symmetry in image processing and 3D reconstruction. Since initial pioneering work with Blue Native PAGE by Nicke et al., (8) virtually all recent evidence also indicates that trimers are the functional unit of P2X receptors (9-11). In addition, we were able to label the C-terminal His-tags on each monomer with 1.8nm gold particles. Although three gold particles attached to a single trimeric particle were only infrequently observed, probably because of a
relatively weak binding or a rapid off-rate (42), many particles were doubly labeled, and after classification and averaging, a 120° angle was subtended between the two gold labels in the classes corresponding to ‘face-on’ views along the C3 axis of rotational symmetry (Figure 4C arrows).
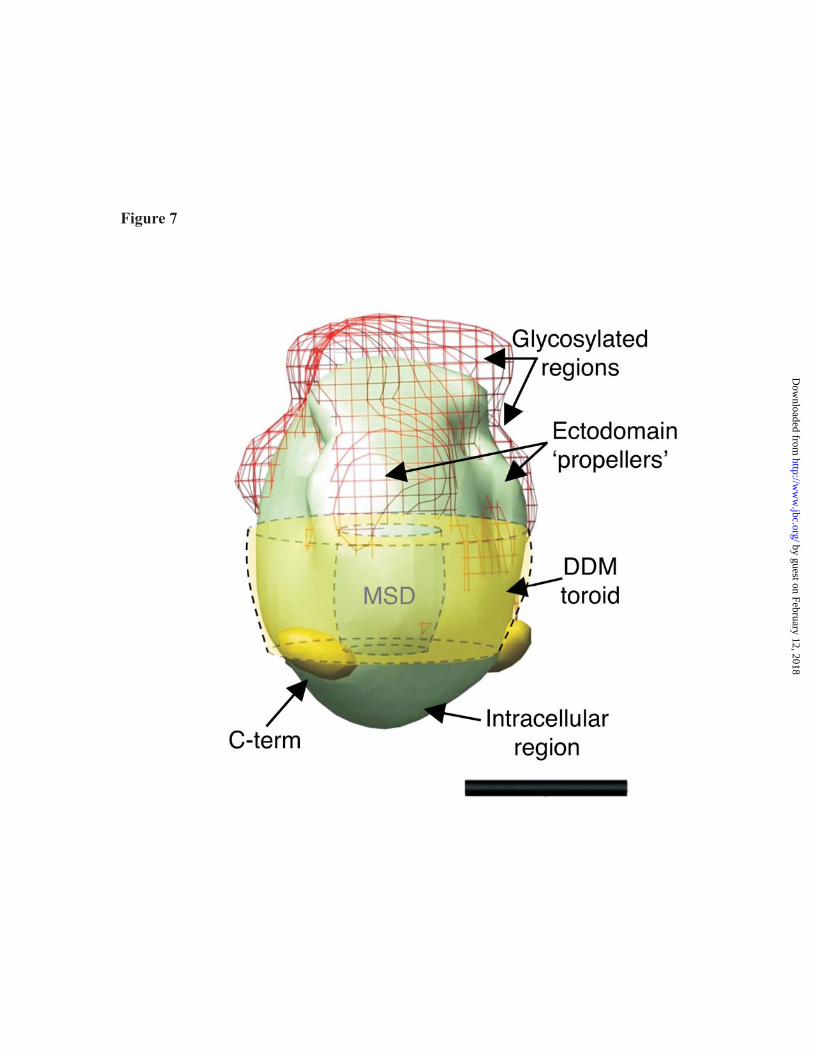
Labelling of the large, multiply-glycosylated ecto-domain with plant lectin confirmed that the ‘propeller’-like domain, previously identified in the low resolution structural analysis as being at the opposite end of the molecule to the Ni-NTA gold label, probably corresponded to this extracellular region. A composite model based on all the EM data is shown in Figure 5. Note the expected dimensions of a torus-shaped DDM micelle are indicated, which would leave a relatively small volume at its centre corresponding to the transmembrane regions of P2X4. The final structure is therefore expected to be torpedo- shaped, with a narrow transmembrane domain and compact, ecto-domains which does not display a central cavity or pore. Approximate maximal dimensions were 8 nm diameter and 12 nm along the longest axis, coincident with the C3 symmetry axis. Under our experimental conditions, where P2X4 was solubilised in detergent, the position of membrane spanning domain (MSD) could not be accurately determined; however, we have indicated its approximate position in Figure 7. It is probable that the transmembrane domains were protected from the aqueous environment by a detergent micelle, which could possess a molecular mass of in excess of 50 kDa. However, our structure does not inform us about protein organisation within the transmembrane region, and it is possible that regions of the ecto-domain may form re-entrant loops, increasing the protein content within the transmembrane space. In the model shown in Figure 7, the C-terminal deca-His tag is positioned close to the start of the MSD, a location which would place it close to the polar head group region of the inner leaflet of the plasma membrane.
Our work represents the first direct structural study of a human P2X receptor, but should be discussed in the light of previous work on rat P2X2. Mio et al (13) purified rat P2X2 from an insect cell line, and determined a structure by TEM and single particle analysis. Their structure resembled an inverted three-sided pyramid, 21.5 nm in height and 20 nm in side length, corresponding to a molecular volume of approximately 1200 nm3; this is 4.5-fold greater than our measurement of 270 nm3. The
by guest on February 12, 2018http://w
ww
.jbc.org/D
ownloaded from
9
authors stated that their model contained a large, stain-permeable cavity; however, as the orientation of the particle was not assigned, it was not possible to state which portion of the molecule contained the cavity in their experiments. The authors assumed that this portion of their structure corresponded to the ecto-domain by comparison with the topology map of the receptor. However, our data clearly shows that the ecto-domain of human P2X4 is a highly compact structure, such as has been shown in the recently published structure of the trimeric acid-sensing ion channel 1 (12). Given the high degree of sequence homology between rat P2X2 and human P2X4, it seems unlikely that the structures at the monomeric level would be so radically different in size and shape. A possible explanation for the discrepancy may be that the rat P2X2 particles were composed of a higher order quaternary structure. Four trimeric P2X2 complexes of the dimensions described here could potentially associate into a large complex with tetragonal symmetry. Such a tetramer of trimers, composed of 12 P2X2 polypeptides, would account for the ~4 fold greater volume of the rat P2X2 particles versus expectations, and the very large (20 nm side-length) overall dimensions of the pyramidal particles. Two additional studies of rat P2X2 structure have been published. Nakazawa et al (14) analyzed single particles of rat P2X2 using atomic force microscopy. They found that, in the presence of 1 mM ATP, particles of approximately 10 nm diameter were observed, with evidence suggesting the presence of a central pore. The diameter of these particles is more consistent with those observed for human P2X4 in our study (8 nm diameter along the C3 axis); however, at the resolution of our study, we could not observe a central pore. It is possible that AFM, which measures the surface topography of the specimen,
is detecting an indentation in P2X2 that is not present in P2X4, or alternatively, that the negative staining and EM method does not access this surface topography in P2X4. Barrera et al (10) also imaged rat P2X2 using atomic force microscopy. They provided evidence for the trimeric nature of rat P2X2 by measuring the average angle (120°) between peripheral particles interpreted as antibodies attached to the (three) C-termini of their P2X2 specimen. Their estimate of the volume of the receptor was 409 nm3, which is consistent with our measurement for human P2X4 of 270 nm3, allowing for the difference in molecular mass between the two receptor subtypes (165 kDa for human P2X4 trimers versus 210 kDa for rat P2X2 trimers).
In summary, we have introduced an efficient method for purification of human P2X4 that has been over-expressed in human cells. This methodology may be readily applicable to other members of this family and could be of interest for the purification of other membrane proteins where isolation of a single oligomeric form is desirable. This method has allowed us to study the overall structure and topology of P2X4 and has helped to interpret existing structural data for this unique and intriguing family of non-selective cation channels. Our work has enabled visualisation of some global structural features of these receptors, and paves the way for future studies. This work should be viewed as an initial and necessary step towards the longer term goal of obtaining high resolution structural information for P2X receptors. From this perspective it is worth considering that spectacular progress has been made using cryoelectron microscopy studies of nicotinic receptors since initial views of the quaternary structure (46) published in 1985 to a recent 4Å resolution model (47).
REFERENCES
FOOTNOTES The authors would like to thank Helen Broomhead for assistance with molecular biology, and Kyriaki Dossi and Joan Sim for assistance with cell culture. This work was supported by the Wellcome Trust (RAN), MRC (JAF, BSK), NIH (BSK) and Human Frontier Science Program (BSK); MTY is the recipient of a Wellcome Trust Advanced Training Fellowship. The abbreviations used are: CFP, cyan fluorescent protein; DDM, n-β-D-dodecyl maltoside; FRET, fluorescence-resonance energy transfer; PBS, phosphate-buffered saline; PFO-PAGE, perfluoro-octanoic acid polyacrylamide gel electrophoresis; TEM, transmission electron microscopy; YFP, yellow fluorescent protein.
by guest on February 12, 2018http://w
ww
.jbc.org/D
ownloaded from
10
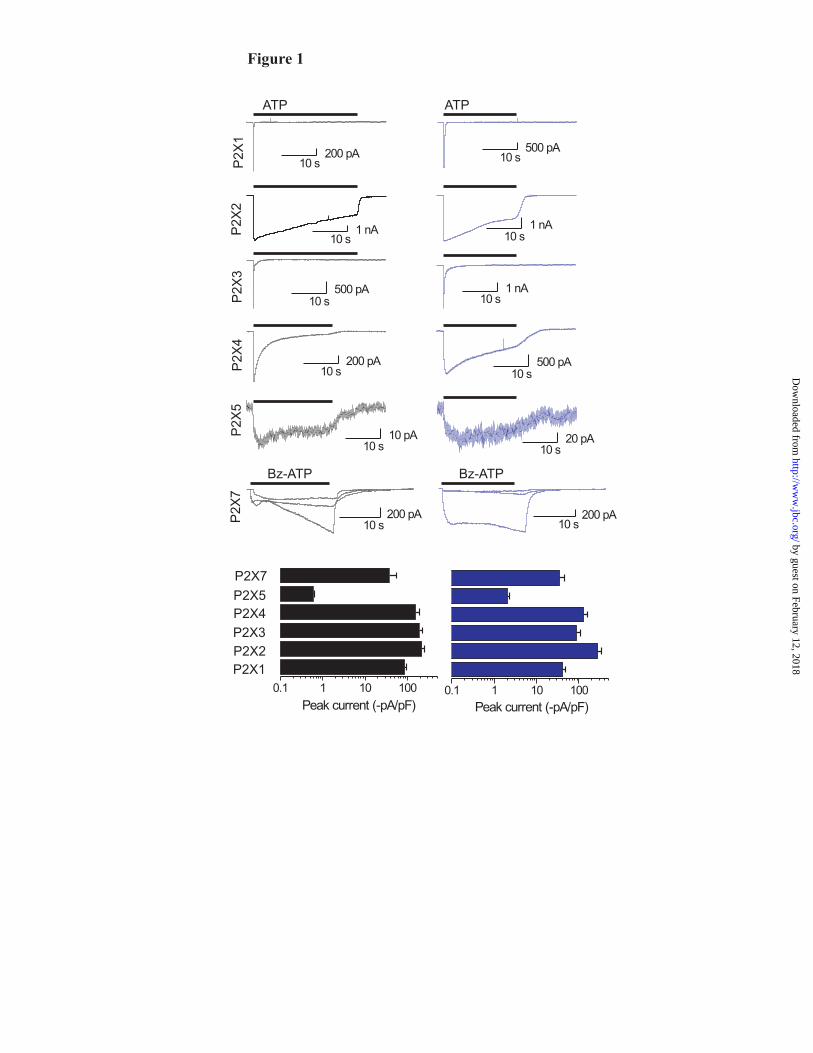
Fig. 1. Functional analysis of wild type and YFP-tagged P2X receptors. The black traces show agonist-evoked currents for wild type homomeric P2X1, P2X2, P2X3, P2X4, P2X5 and P2X7 receptors. In each case the agonist was applied for 20-30s, so that the time course of desensitisation could be monitored (100 μM ATP for all P2X receptors, except P2X7 when 30 μM Bz-ATP was used). The blue traces show similar experiments for the same receptors carrying YFP tags. Note that the response is similar for each receptor with or without the tag. The lower bar graphs show peak current densities; here again the peaks for wild type and YFP tagged receptors were similar. P2X6 receptors were not examined because they do not express in the plasma membrane. Fig. 2. Functional properties and FRET for CFP and YFP tagged P2X4 receptors. (A) Average 100 μM ATP-evoked current waveforms for P2X4, P2X4-CFP and P2X4-YFP receptors (n=9), with bar graphs below showing the properties of the currents (the kinetic values are time constants). (B) Concentration-response curves for wild type and CFP/YFP tagged receptors. (C) Images of two HEK cells expressing P2X4-CFP and P2X4-YFP before and after photodestruction of the acceptor YFP. Note the fluorescence intensity of the YFP channel decreases following photodestruction, whereas that of the CFP increases. The images were from the 30 minute photodestruction time point. (D) Time course of YFP photodestruction and CFP photorecovery for whole-cell and near membrane regions. Graphs such as these are used to determine FRET e: YFP photodestruction is plotted versus CFP photorecovery and the data are fit with a straight line and extrapolated to 100% YFP photodestruction. The intersection with the Y-axis represents the FRET e (see Fig 3). Fig. 3. FRET e for all homomeric P2X receptor for near membrane regions of interest, and relationship of FRET e and interfluorophore distance. (A-H) In each case linear plots of YFP photodestruction and CFP photorecovery are shown for the indicated constructs. In each case FRET e is given by the Y-axis intercept of the straight line fits. The FRET e value from a linear fit to the mean data for CFP/YFP represent FRET noise. In the case of tagged P2X6 receptors only whole-cell regions were examined because these do not express in the plasma membrane, but are instead retained within intracellular membranes (see text). (I) The left-had graph shows a plot of the Förster equation relating FRET e (Y-axis) and interfluorophore distance (X-axis), with FRET e data for all homomeric P2X receptors superimposed. The boxed region is expanded in the right-hand graph. (J) The left-hand panel shows the measured distance between the C tails of P2X4 monomers within the trimer (5.6 nm). The right-hand cartoon summarizes the trend that was observed in the P2X receptor data. Namely that receptors with short C termini displayed lower FRET e (thus greater interfluorophore distance), and those with longer tails displayed higher FRET e (thus greater interfluorophore distance). In interpreting these data it is important to remember that the orientation factor κ2 is taken as 2/3, and assumes random tumbling as discussed by us and others (19,30). Fig 4. Comparison of P2X receptor FRET by two methods. The graph shows the relationship between FRET e estimates from experiments such as those in Fig 3 where extensive photobleaching was employed (~30 min), and to estimates of FRET e when only 5 minutes of photodestruction was used. The graph shows strong agreement in FRET e values for these two donor dequenching methods (see text for further details). Fig. 5. Purification and 21 Å structure of P2X4 receptor trimers. (A) Coomassie-stained 8% (w/v) PFO-PAGE gel of partially purified P2X4 after nickel chromatography. The molecular masses of monomer (55 kDa), dimer (110 kDa) and trimer (165 kDa) bands are indicated (1, 2 and 3 respectively). (B) Silver-stained SDS-PAGE gel of purified human P2X4 trimers following gel excision and electro-elution. A high purity was obtained; SDS-stable dimer and trimer forms of protein are also visible. (C) Silver-stained PFO-PAGE gel of purified trimers demonstrated that the trimer form was stable after purification (indicated with an arrow). (D) Particle field from an electron micrograph of negatively stained
by guest on February 12, 2018http://w
ww
.jbc.org/D
ownloaded from
11
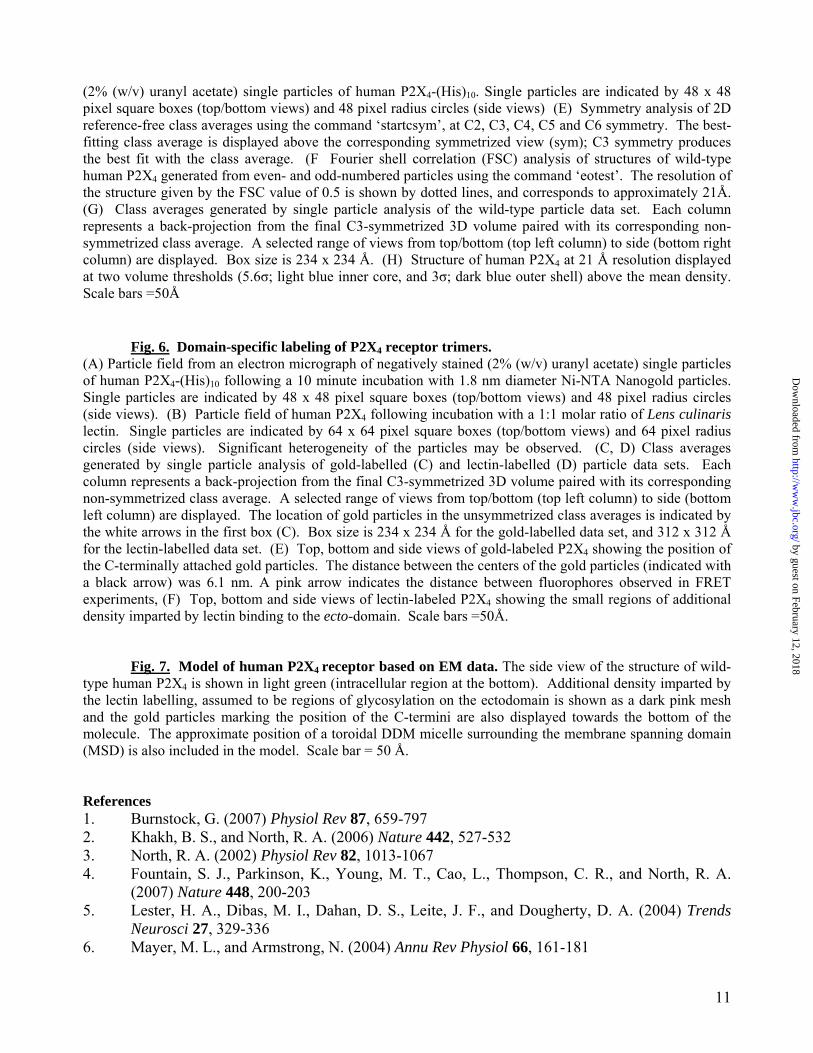
(2% (w/v) uranyl acetate) single particles of human P2X4-(His)10. Single particles are indicated by 48 x 48 pixel square boxes (top/bottom views) and 48 pixel radius circles (side views) (E) Symmetry analysis of 2D reference-free class averages using the command ‘startcsym’, at C2, C3, C4, C5 and C6 symmetry. The best-fitting class average is displayed above the corresponding symmetrized view (sym); C3 symmetry produces the best fit with the class average. (F Fourier shell correlation (FSC) analysis of structures of wild-type human P2X4 generated from even- and odd-numbered particles using the command ‘eotest’. The resolution of the structure given by the FSC value of 0.5 is shown by dotted lines, and corresponds to approximately 21Å. (G) Class averages generated by single particle analysis of the wild-type particle data set. Each column represents a back-projection from the final C3-symmetrized 3D volume paired with its corresponding non-symmetrized class average. A selected range of views from top/bottom (top left column) to side (bottom right column) are displayed. Box size is 234 x 234 Å. (H) Structure of human P2X4 at 21 Å resolution displayed at two volume thresholds (5.6σ; light blue inner core, and 3σ; dark blue outer shell) above the mean density. Scale bars =50Å Fig. 6. Domain-specific labeling of P2X4 receptor trimers. (A) Particle field from an electron micrograph of negatively stained (2% (w/v) uranyl acetate) single particles of human P2X4-(His)10 following a 10 minute incubation with 1.8 nm diameter Ni-NTA Nanogold particles. Single particles are indicated by 48 x 48 pixel square boxes (top/bottom views) and 48 pixel radius circles (side views). (B) Particle field of human P2X4 following incubation with a 1:1 molar ratio of Lens culinaris lectin. Single particles are indicated by 64 x 64 pixel square boxes (top/bottom views) and 64 pixel radius circles (side views). Significant heterogeneity of the particles may be observed. (C, D) Class averages generated by single particle analysis of gold-labelled (C) and lectin-labelled (D) particle data sets. Each column represents a back-projection from the final C3-symmetrized 3D volume paired with its corresponding non-symmetrized class average. A selected range of views from top/bottom (top left column) to side (bottom left column) are displayed. The location of gold particles in the unsymmetrized class averages is indicated by the white arrows in the first box (C). Box size is 234 x 234 Å for the gold-labelled data set, and 312 x 312 Å for the lectin-labelled data set. (E) Top, bottom and side views of gold-labeled P2X4 showing the position of the C-terminally attached gold particles. The distance between the centers of the gold particles (indicated with a black arrow) was 6.1 nm. A pink arrow indicates the distance between fluorophores observed in FRET experiments, (F) Top, bottom and side views of lectin-labeled P2X4 showing the small regions of additional density imparted by lectin binding to the ecto-domain. Scale bars =50Å.
Fig. 7. Model of human P2X4 receptor based on EM data. The side view of the structure of wild-type human P2X4 is shown in light green (intracellular region at the bottom). Additional density imparted by the lectin labelling, assumed to be regions of glycosylation on the ectodomain is shown as a dark pink mesh and the gold particles marking the position of the C-termini are also displayed towards the bottom of the molecule. The approximate position of a toroidal DDM micelle surrounding the membrane spanning domain (MSD) is also included in the model. Scale bar = 50 Å. References 1. Burnstock, G. (2007) Physiol Rev 87, 659-797 2. Khakh, B. S., and North, R. A. (2006) Nature 442, 527-532 3. North, R. A. (2002) Physiol Rev 82, 1013-1067 4. Fountain, S. J., Parkinson, K., Young, M. T., Cao, L., Thompson, C. R., and North, R. A.
(2007) Nature 448, 200-203 5. Lester, H. A., Dibas, M. I., Dahan, D. S., Leite, J. F., and Dougherty, D. A. (2004) Trends
Neurosci 27, 329-336 6. Mayer, M. L., and Armstrong, N. (2004) Annu Rev Physiol 66, 161-181
by guest on February 12, 2018http://w
ww
.jbc.org/D
ownloaded from
12
7. Sine, S. M., and Engel, A. G. (2006) Nature 440, 448-455 8. Nicke, A., Baumert, H. G., Rettinger, J., Eichele, A., Lambrecht, G., Mutschler, E., and
Schmalzing, G. (1998) EMBO J 17(11), 3016-3028 9. Aschrafi, A., Sadtler, S., Niculescu, C., Rettinger, J., and Schmalzing, G. (2004) J Mol Biol
342, 333-343 10. Barrera, N. P., Ormond, S. J., Henderson, R. M., Murrell-Lagnado, R. D., and Edwardson, J.
M. (2005) J Biol Chem 280, 10759-10765 11. Jiang, L. H., Kim, M., Spelta, V., Bo, X., Surprenant, A., and North, R. A. (2003) J Neurosci
23, 8903-8910 12. Jasti, J., Furukawa, H., Gonzales, E. B., and Gouaux, E. (2007) Nature 449, 316-323 13. Mio, K., Kubo, Y., Ogura, T., Yamamoto, T., and Sato, C. (2005) Biochem Biophys Res
Commun 337, 998-1005 14. Nakazawa, K., Yamakoshi, Y., Tsuchiya, T., and Ohno, Y. (2005) Eur J Pharmacol 518,
107-110 15. Yan, Z., Liang, Z., Tomic, M., Obsil, T., and Stojilkovic, S. S. (2005) Mol Pharmacol 67,
1078-1088 16. Bo, X., Jiang, L. H., Wilson, H. L., Kim, M., Burnstock, G., Surprenant, A., and North, R. A.
(2003) Mol Pharmacol 63, 1407-1416 17. Bobanovic, L. K., Royle, S. J., and Murrell-Lagnado, R. D. (2002) J Neurosci 22, 4814-4824 18. Fisher, J. A., Girdler, G., and Khakh, B. S. (2004) J Neurosci 24, 10475-10487 19. Khakh, B. S., Fisher, J. A., Nashmi, R., Bowser, D. N., and Lester, H. A. (2005) J Neurosci
20, 6911-6920 20. Khakh, B. S., and Egan, T. M. (2005) J Biol Chem 280, 6118-6129 21. Khakh, B. S., Smith, W. B., Chiu, C. S., Ju, D., Davidson, N., and Lester, H. A. (2001) Proc
Natl Acad Sci U S A 98, 5288-5293 22. Richler, E., Chaumont, S., Shigetomi, E., Sagasti, A., and Khakh, B. S. (2008) Nature
Methods 5, 87-93 23. Royle, S. J., Bobanovic, L. K., and Murrell-Lagnado, R. D. (2002) J Biol Chem 277, 35378-
35385 24. Royle, S. J., Qureshi, O. S., Bobanovic, L. K., Evans, P. R., Owen, D. J., and Murrell-
Lagnado, R. D. (2005) J Cell Sci 118, 3073-3080 25. Samways, D. S., and Egan, T. M. (2007) J Gen Physiol 129, 245-256 26. Fountain, S. J., and North, R. A. (2006) J Biol Chem 281, 15044-15049 27. Egan, T. M., Haines, W. R., and Voigt, M. M. (1998) J Neurosci 18(7), 2350-2359 28. Ramjeesingh, M., Huan, L. J., Garami, E., and Bear, C. E. (1999) Biochem J 342, 119-123 29. Ludtke, S. J., Baldwin, P. R., and Chiu, W. (1999) J Struct Biol 128, 82-97 30. Michalet, X., Kapanidis, A. N., Laurence, T., Pinaud, F., Doose, S., Pflughoefft, M., and
Weiss, S. (2003) Annual Review of Biophysics and Biomolecular Structure 32, 161-182 31. Bunt, G., and Wouters, F. S. (2004) Int Rev Cytol 237, 205-277 32. Tsien, R. Y. (1998) Annu Rev Biochem 67, 509-544 33. Surprenant, A., Rassendren, F., Kawashima, E., North, R. A., and Buell, G. (1996) Science
272(5262), 735-738 34. Kim, M., Jiang, L. H., Wilson, H. L., North, R. A., and Surprenant, A. (2001) EMBO J 20,
6347-6358 35. Pelegrin, P., and Surprenant, A. (2006) EMBO J 25, 5071-5082 36. Pelegrin, P., and Surprenant, A. (2007) J Biol Chem 282, 2386-2394 37. Roger, S., Pelegrin, P., and Surprenant, A. (2008) J Neurosci 28, 6393-6401
by guest on February 12, 2018http://w
ww
.jbc.org/D
ownloaded from
13
38. Khakh, B. S., Burnstock, G., Kennedy, C., King, B. F., North, R. A., Seguela, P., Voigt, M., and Humphrey, P. P. A. (2001) Pharmacol Rev 53, 107-118
39. Nashmi, R., Dickinson, M. E., McKinney, S., Jareb, M., Labarca, C., Fraser, S. E., and Lester, H. A. (2003) J Neurosci 23, 11554-11567
40. Drenan, R. M., Nashmi, R., Imoukhuede, P., Just, H., McKinney, S., and Lester, H. A. (2008) Mol Pharmacol 73, 27-41
41. Le, K. T., Babinski, K., and Séguéla, P. (1998) J Neurosci 18(18), 7152-7159 42. Lata, S., Gavutis, M., Tampé, R., and Piehler, J. (2006) J Am Chem Soc 128, 2365-2372 43. Kawate, T., and Gouaux, E. (2006) Structure 14, 673-681 44. Kashino, Y. (2003) J Chromatogr B Analyt Technol Biomed Life Sci. 797, 191-216 45. Ford, R. C., Picot, D., and Garavito, R. M. (1987) EMBO J 6, 1581-1586 46. Brisson, A., and Unwin, P. N. (1985) Nature 315, 474-477 47. Unwin, N. (2005) J Mol Biol 346, 967-989
by guest on February 12, 2018http://w
ww
.jbc.org/D
ownloaded from
0.1 1 10 100
Peak current (-pA/pF)
P2X7
P2X5
P2X4
P2X3
P2X2
P2X1
200 pA10 s
1 nA10 s
500 pA10 s
10 pA10 s
200 pA10 s
500 pA10 s
1 nA10 s
1 nA10 s
500 pA10 s
20 pA10 s
P2X
1P
2X
2P
2X
3P
2X
4P
2X
5P
2X
7
ATP ATP
0.1 1 10 100
Peak current (-pA/pF)
Bz-ATP Bz-ATP
Figure 1
200 pA10 s
200 pA10 s
by guest on February 12, 2018http://w
ww
.jbc.org/D
ownloaded from

P2X4
50 pA/pF0.5 s
P2X4-CFP P2X4-YFP
0
100
200
300
P2X
4-Y
FP
P2X
4-C
FP
Ris
etim
e(m
s)
P2X
4
0
50
100
%de
sens
itisa
tion
P2X
4
P2X
4-C
FP
P2X
4-Y
FP
0
100
200
300
Dec
ay(m
s)
P2X
4
P2X
4-C
FP
P2X
4-Y
FP
0.1 1 10 100
0.0
0.2
0.4
0.6
0.8
1.0
Nor
mal
ised
resp
onse
[ATP] M
P2X4
P2X4-CFP
P2X4-YFP
Before photodestruction
After photodestruction
YFP image CFP image
256
0
YFP image CFP image
0 10 20 30 400
20
40
60
80
100
0
20
40
60
80
100
Photorecovery
(%)
Pho
tode
stru
ctio
n(%
)
Time (min)
C D
A B
Figure 2 by guest on February 12, 2018
http://ww
w.jbc.org/
Dow
nloaded from
0 20 40 60 80 100
0
10
20
30
40
Photorecovery
(%)
Photodestruction (%)
C. P2X2-YFP/P2X
2-CFP
0 20 40 60 80 100
0
10
20
30
40
Photodestruction (%)
D. P2X3-YFP/P2X
3-CFP P
hotorecovery(%
)
0 20 40 60 80 100
0
10
20
30
40
Photorecovery
(%)
Photodestruction (%)
E. P2X4-YFP/P2X
4-CFP
0 20 40 60 80 100
0
10
20
30
40
Photorecovery
(%)
Photodestruction (%)
F. P2X5-YFP/P2X
5-CFP
0 20 40 60 80 100
0
10
20
30
40
Photorecovery
(%)
G. P2X6-YFP/P2X
6-CFP
Photodestruction (%)0 20 40 60 80 100
0
10
20
30
40H. P2X7-YFP/P2X
7-CFP P
hotorecovery(%
)
Photodestruction (%)
0 20 40 60 80 100
0
10
20
30
40 Photorecovery
(%)
Photodestruction (%)
A. CFP/YFP
0 20 40 60 80 100
0
20
40
60
80
100I.
FR
ET
e(%
)
Distance (Angstroms)
short tails long tails
0 20 40 60 80 100
0
10
20
30
40
Photorecovery
(%)
Photodestruction (%)
B. P2X1-YFP/P2X
1-CFP
5.6nm
J
5.3 nm6.4 nm
Figure 3
50 55 60 65 95100105
05
10152025303540
45 aa
96 aa31 aa
53 aa
119 aa
239 aa
FR
ET
e(%
)
Distance (Angstroms)
by guest on February 12, 2018http://w
ww
.jbc.org/D
ownloaded from
0 10 20 30 40 500
10
20
30
40
500 10 20 30 40 50
0
10
20
30
40
50
P2X1-CFP/YFP
P2X2-CFP/YFP
P2X3-CFP/YFP
P2X4-CFP/YFP
P2X5-CFP/YFP
P2X6-CFP/YFP
P2X7-CFP/YFP
Fitted liner=0.995
Line ofidentity
FR
ET
efrom
mul
tiple
poin
ts(%
)
FRET e from 1 point (%)
Figure 4
by guest on February 12, 2018http://w
ww
.jbc.org/D
ownloaded from
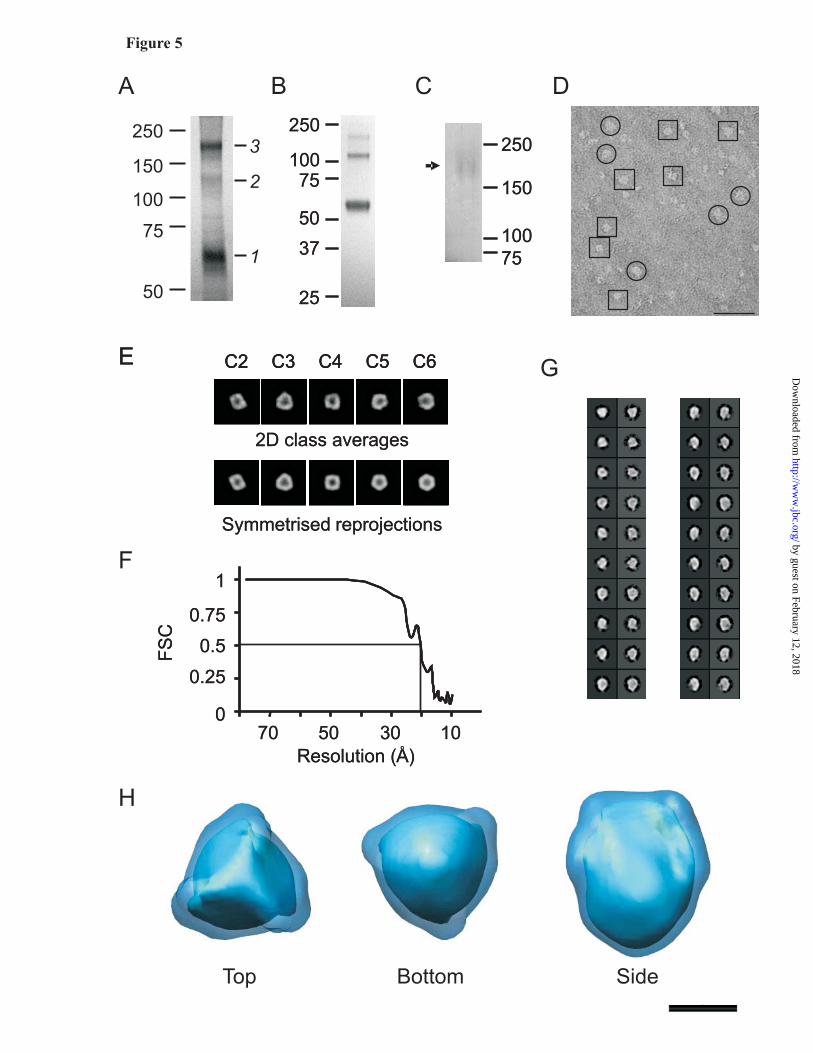
Figure 5
GE C2 C3 C4 C5 C6
2D class averages
Symmetrised reprojections
E C2 C3 C4 C5 C6C2 C3 C4 C5 C6
2D class averages
Symmetrised reprojections
F
H
FS
C
0
0.25
0.5
0.75
1
10305070Resolution (Å)
FS
C
0
0.25
0.5
0.75
1
10305070Resolution (Å)
DA
3
2
1
Top Bottom Side
B C
250
10075
50
37
25
250
10075
50
37
25
250
150
10075
250
150
10075
250
150
100
75
50
by guest on February 12, 2018http://w
ww
.jbc.org/D
ownloaded from
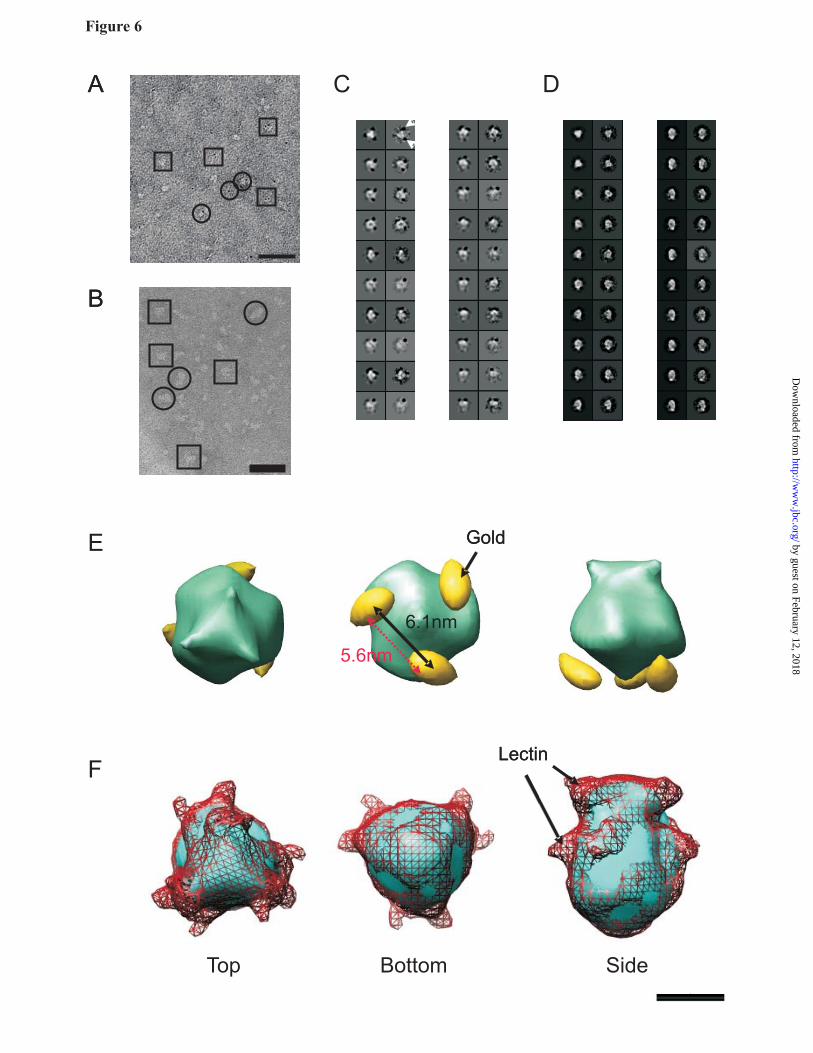
Figure 6
D
E
C
F
B
A
B
A
Top Bottom Side
LectinLectin
Gold
6.1nm
Gold
6.1nm
5.6nm
by guest on February 12, 2018http://w
ww
.jbc.org/D
ownloaded from
Baljit S. KhakhMark T. Young, James A. Fisher, Samuel J. Fountain, Robert C. Ford, R. Alan North and
fluorescence resonance energy transfer and electron microscopyMolecular shape, architecture and size of P2X4 receptors determined using
published online July 17, 2008J. Biol. Chem.
10.1074/jbc.M804458200Access the most updated version of this article at doi:
Alerts:
When a correction for this article is posted•
When this article is cited•
to choose from all of JBC's e-mail alertsClick here
by guest on February 12, 2018http://w
ww
.jbc.org/D
ownloaded from
![[Pharma] receptors](https://static.fdocuments.in/doc/165x107/55c466e6bb61eb94478b470c/pharma-receptors.jpg)