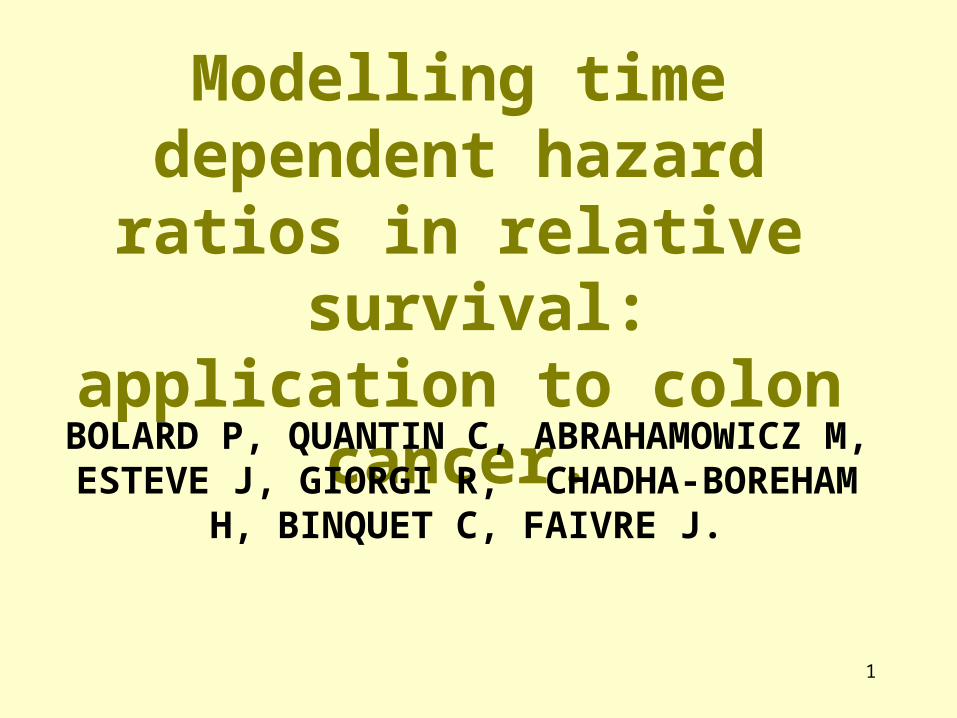
1 Modelling time dependent hazard ratios in relative survival: application to colon cancer. BOLARD...
22
1 Modelling time dependent hazard ratios in relative survival: application to colon cancer. BOLARD P, QUANTIN C, ABRAHAMOWICZ M, ESTEVE J, GIORGI R, CHADHA-BOREHAM H, BINQUET C, FAIVRE J.
-
Upload
giles-cross -
Category
Documents
-
view
213 -
download
0
Transcript of 1 Modelling time dependent hazard ratios in relative survival: application to colon cancer. BOLARD...
1
Modelling time dependent hazard ratios in relative survival: application to
colon cancer.
BOLARD P, QUANTIN C, ABRAHAMOWICZ M, ESTEVE J, GIORGI R, CHADHA-BOREHAM H,
BINQUET C, FAIVRE J.

2
INTRODUCTION Previous results of the Flexible generalisation of the Cox model
- The PH hypothesis does not hold for most prognostic factors for all-causes mortality in colon cancer
-Some of these effects may reflect the inability of the method to separate cancer-related mortality from all-causes mortality
- Analyses of our BRDC colon cancer data require simultaneous modelling of both relative survival and possibly non-proportional hazards.
3
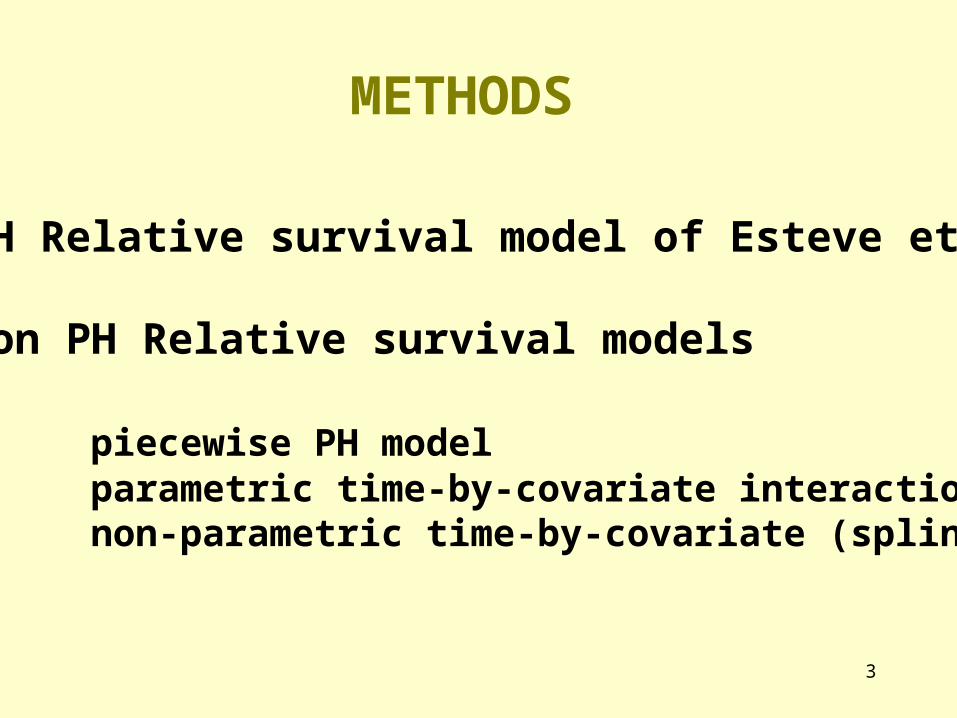
METHODS
PH Relative survival model of Esteve et al.
Non PH Relative survival models
piecewise PH modelparametric time-by-covariate interactionnon-parametric time-by-covariate (spline)

4
PH Relative survival model of Esteve
1,,,, zxtZtxZt ec
c = disease-related mortality hazard for the k-th interval
p
j
jjkc ZZt1
exp, for tk-1<t<tk
e = general population mortality hazard, depends on age (x)and gender (z1)
5
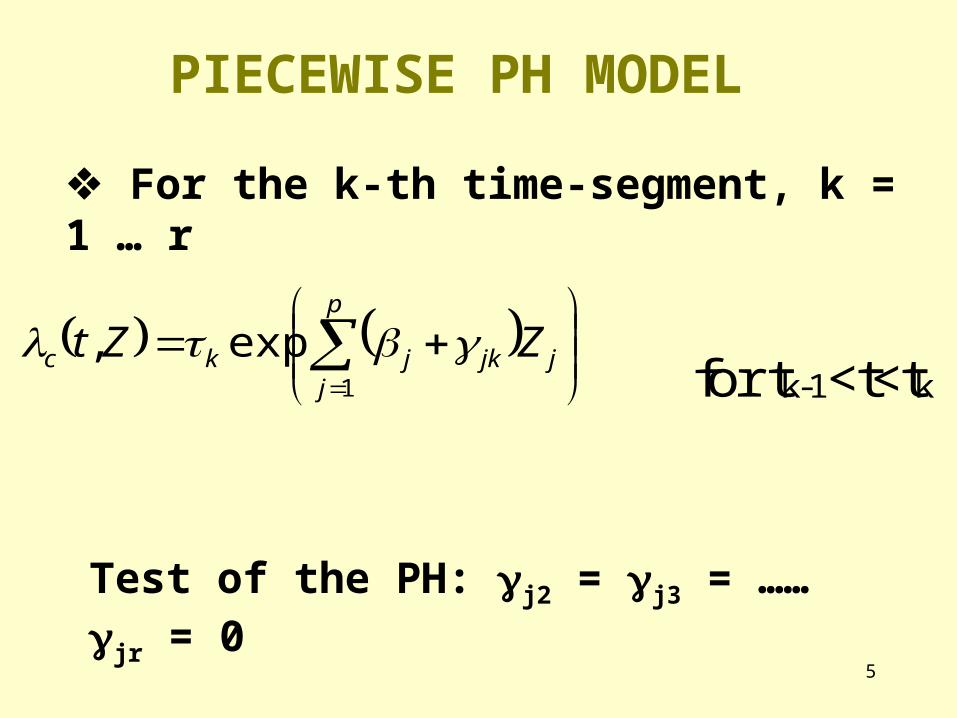
For the k-th time-segment, k = 1 … r
p
jjjkjkc ZZt
1
exp, for tk-1<t<tk
PIECEWISE PH MODEL
Test of the PH: j2 = j3 = …… jr = 0
6
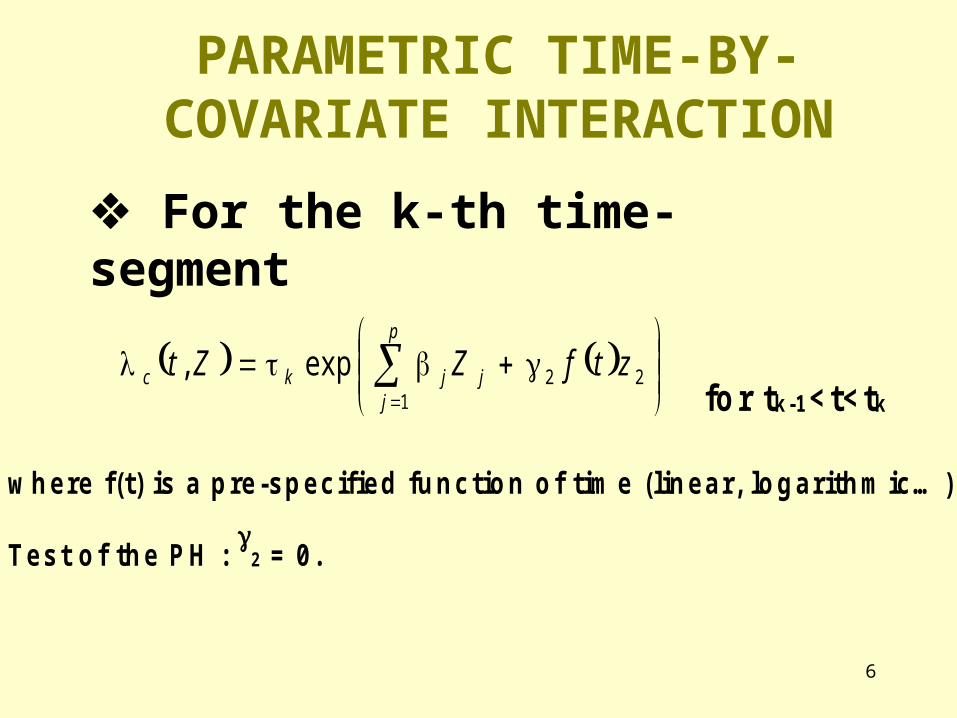
PARAMETRIC TIME-BY-COVARIATE INTERACTION
For the k-th time-segment
22
1
exp, ztfZZtp
jjjkc
fo r t k -1 < t< t k
w h e re f( t ) is a p re -s p e c if ie d fu n c t io n o f t im e ( lin e a r , lo g a r ith m ic … )
T e s t o f th e P H : 2 = 0 .

7
L i n e a r i t y c o n s t r a i n t s b e f o r e t h e 1 s t k n o t a n d a f t e r t h e l a s t k n o t
a r e s t r i c t e d c u b i c s p l i n e f u n c t i o n w i t h v k n o t s ( v p a r a m e t e r s ) :
23
1
131
1
310
v
ir
rr
irr
rr
irii tt
tt
tttt
tt
ttttttS
I f w e u s e v = 3 k n o t s :
3
323
1232
23
1331210 tt
tt
tttt
tt
ttttttS
t 1 , t 2 a n d t 3 a r e t h e t i m e p o i n t s w h e r e t h e k n o t s a r e p l a c e d
CUBIC SPLINE FUNCTIONS FOR MODELLING TIME-BY-COVARIATE INTERACTIONS
8
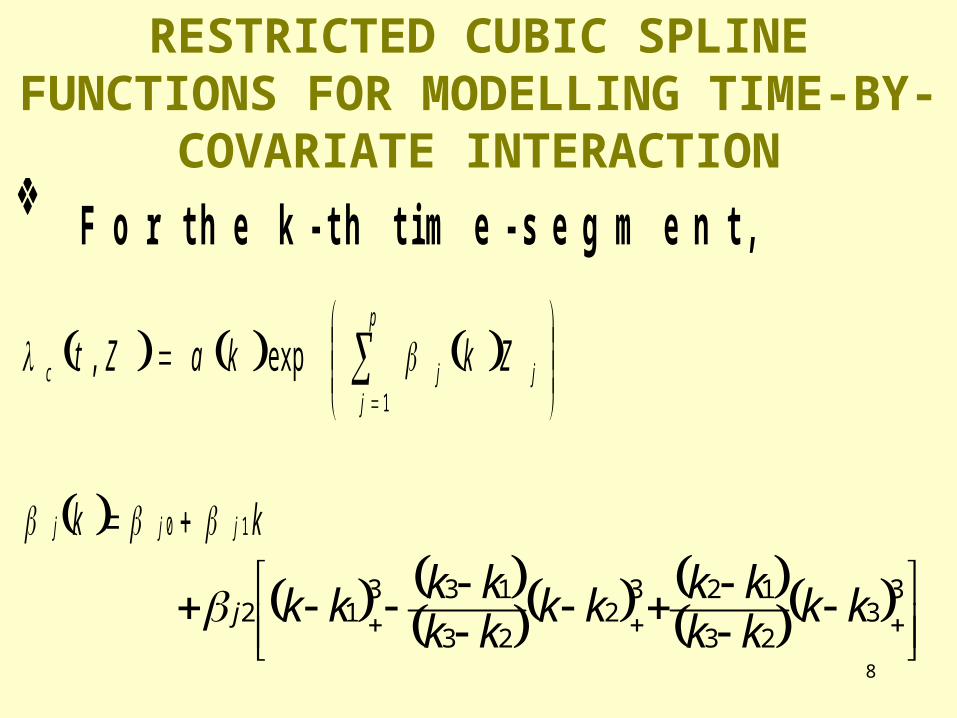
RESTRICTED CUBIC SPLINE FUNCTIONS FOR MODELLING TIME-BY-
COVARIATE INTERACTION F o r t h e k - t h t i m e - s e g m e n t ,
p
jjjc ZkkaZt
1
exp,
kk jjj 10
33
23
1232
23
13312 kk
kkkkkk
kkkkkkj
9
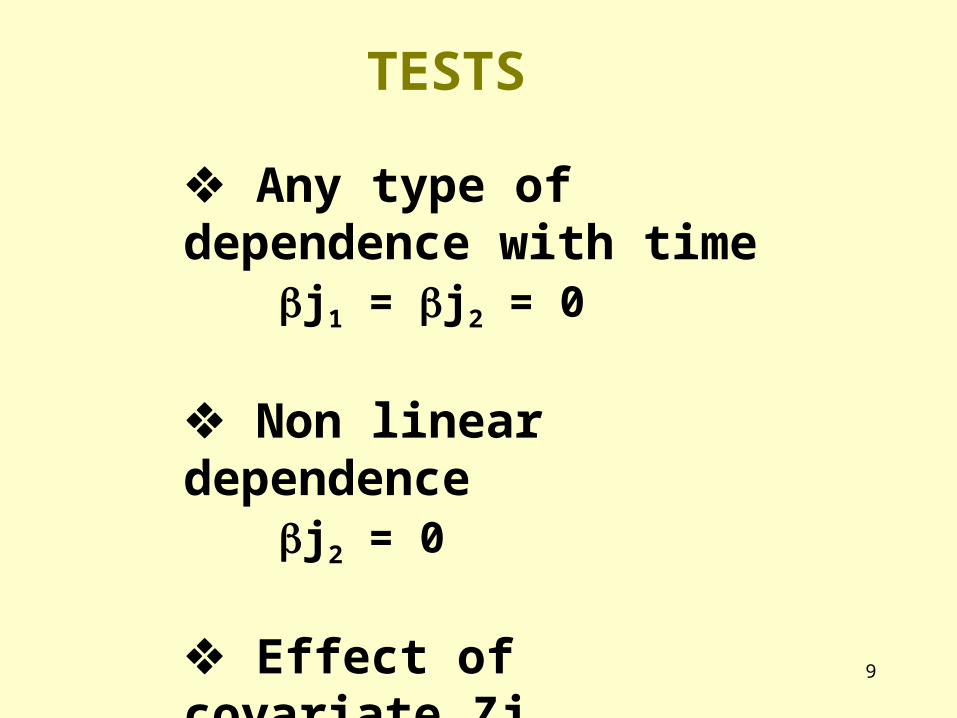
TESTS
Any type of dependence with time
j1 = j2 = 0
Non linear dependencej2 = 0
Effect of covariate Zjj0 = j1 = j2 = 0

10
NUMBER OF KNOTS AND THEIR LOCATION
Number: can be restricted between 3 and 5 knots in most cases [Stone ] 3 knots.
Location: * both
- quantiles of the distribution function of deaths.
- percentiles of the distribution function of the follow-up times.
* In our restricted cubic spline model, we cannot fix the knots too near the extremes because of the linearity constraints.
5th, 50th and 95th quantiles

11
APPLICATION: PATIENTS
2075 cases of colon cancer diagnosed between 76 and 90 (Burgundy Registry of Digestive Cancers)
end of follow-up: December 31, 1994.
1334 deaths at 5 yearsMedian survival time of 12 months

12
Prognostic factors:
* gender
* age (< 65, 65-74, 75)
* periods of diagnosis (76-78, 79-81, 82-84, 85-87, 88-90)
* cancer TNM stage

13
RESULTS

14
Comparison of crude (Cox model) and relative survival (Esteve model) Proportional Hazard model in multivariate analyses
Cox Model Esteve ModelAGE HR 95% CI HR 95% CI< 65 years 1 165-74 years 1.44 [1.25 - 1.66] 1.19 [0.98-1.44]75 years or older 2.29 [2.03 - 2.65] 1.49 [1.23-1.74]
GENDERwoman 1 1man 1.20 [1.09-1.33] 1.06 [0.95-1.21]
STAGE AT DIAGNOSISstage I 1 1stage II 1.36 [1.13 - 1.63] 1.62 [1.11-2.38]stage III 2.33 [1.93 - 2.82] 4.09 [2.82-5.95]stage IIIb 5.23 [4.06 -6.73] 11.56 [7.66-17.43]stage IV 7.63 [6.31 - 9.23] 18.10 [12.63-25.93]
PERIOD OF DIAGNOSIS76-78 1 179-81 1.05 [0.90 - 1.24] 0.96 [0.76-1.22]82-84 1.02 [0.86 - 1.19] 0.87 [0.70-1.09]85-87 0.91 [0.77 - 1.07] 0.73 [0.58 - 0.92]88-90 0.81 [0.68 - 0.95] 0.62 [0.49 - 0.79]
Click for larger picture

15
Testing the Proportional Hazard assumption in multivariate Relative Survival analysis
Time by covariate interaction Piecewise PHrelative survival
t log (t)
AgeGlobal < 0.001 0.008 <0.001
65-74 years 0.003 0.143 0.01275 years or older 0.004 0.004 <0.001
Gender 0.256 0.337 0.183
Stage at diagnosisGlobal <0.001 0.002 <0.001Stage II 0.172 0.008 0.287Stage III 0.024 0.043 0.004
Stage IIIb 0.256 0.214 0.024Stage IV 0.007 0.092 0.002
Period of diagnosisGlobal 0.164 0.005 0.00179-81 0.229 0.037 0.01682-84 0.181 0.350 0.01385-87 0.264 0.194 0.00688-90 0.368 0.226 0.002
Click for larger picture

16
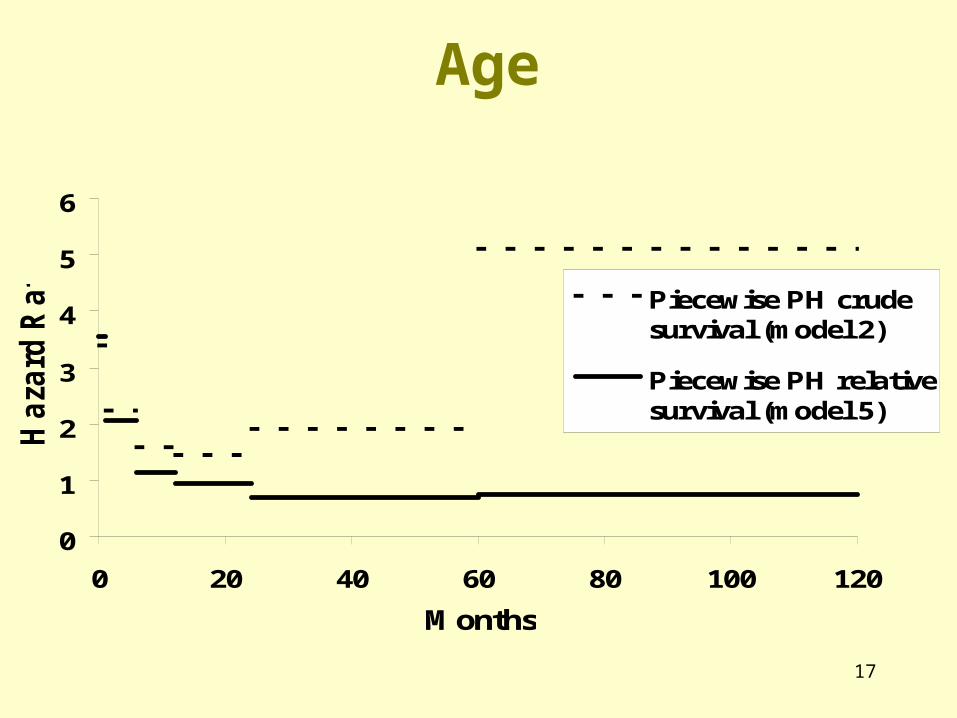
Change of the Hazard Ratio associated to age (reference category: < 65 years) using piecewise Proportional Hazard models in crude and relative survival
HR estimated by piecewise PH model in crude survival (Moreau's model)Time-segments (months)
[0;1[ [1;6[ [6;12[ [12;24[ [24;60[ pa
AGE
65-74 years 1.83* 1.62* 1.48* 0.94 1.08 0.02975 years or older 3.40* 2.25* 1.60* 1.47* 1.93* <0.001
HR estimated by piecewise PH model in relative survivalTime-segments (months)
[0;1[ [1;6[ [6;12[ [12;24[ [24;60[ pa
AGE
65-74 years 1.77* 1.52* 1.27 0.73 0.74 0.01275 years or older 3.54* 2.06* 1.13 0.96 0.70 <0.001
* : Hazard Ratio significantly different from 1
Click for larger picture
17
0
1
2
3
4
5
6
0 20 40 60 80 100 120
Months
Ha
zard
Ra
tio
Piecewise PH crudesurvival (model 2)
Piecewise PH relativesurvival (model 5)
Age

18
Test of proportional hazard assumption obtained with model 3 using restricted cubic spline functions for modelling different time-by-covariate interactions.
Age Site Stage Period ofdiagnosis
Gender
df -2Log L df -2Log L df -2Log L df -2Log L df -2Log L
Null 0 4947 0 4955 0 3955 0 4913 0 4970
Linear 2 4914 1 4949 4 3931 4 4886 1 4968
Cubic spline (3knots)
4 4903 2 4944 8 3900 8 4875 2 4964
Any type ofdependence(Betaj1 = Betaj2 = 0)
< 0.0001 < 0.0001 < 0.0001 < 0.0001 < 0.0001
Non lineardependence(Betaj2 = 0)
< 0.0001 < 0.0001 < 0.0001 <0.004 < 0.0001
Click for larger picture

19
Age > 74 years versus age < 65 years
-1,5
-1
-0,5
0
0,5
1
1,5
0 10 20 30 40 50 60
Months
Lo
g H
azar
d R
atio

20
Stage 2 versus Stage 1
-2,00
-1,00
0,00
1,00
2,00
3,00
4,00
0 10 20 30 40 50 60
Months
Lo
g H
azar
d R
atio

21
Period of diagnosis 85-87 versus 76-78
-1,50
-1,00
-0,50
0,00
0,50
1,00
1,50
0 10 20 30 40 50 60
Months
Lo
g H
aza
rd R
ati
o
1,50
-1,50
0,00

22
CONCLUSION
Both flexible modelling of non-proportional hazards and the relative survival approach are important:
differences between relative survival and the conventional Cox model.
Restricted cubic spline model * better fit than a linear time-by-covariate interaction* more parsimonious than a piecewise PH relative survival model * allows to represent both simple and complex patterns of changes
Number and the location of knots