Chapter 7: Atmospheric Disturbances Part I: Midlatitude Disturbances.
Upload
caitlin-ramseyCategory
view
215download
2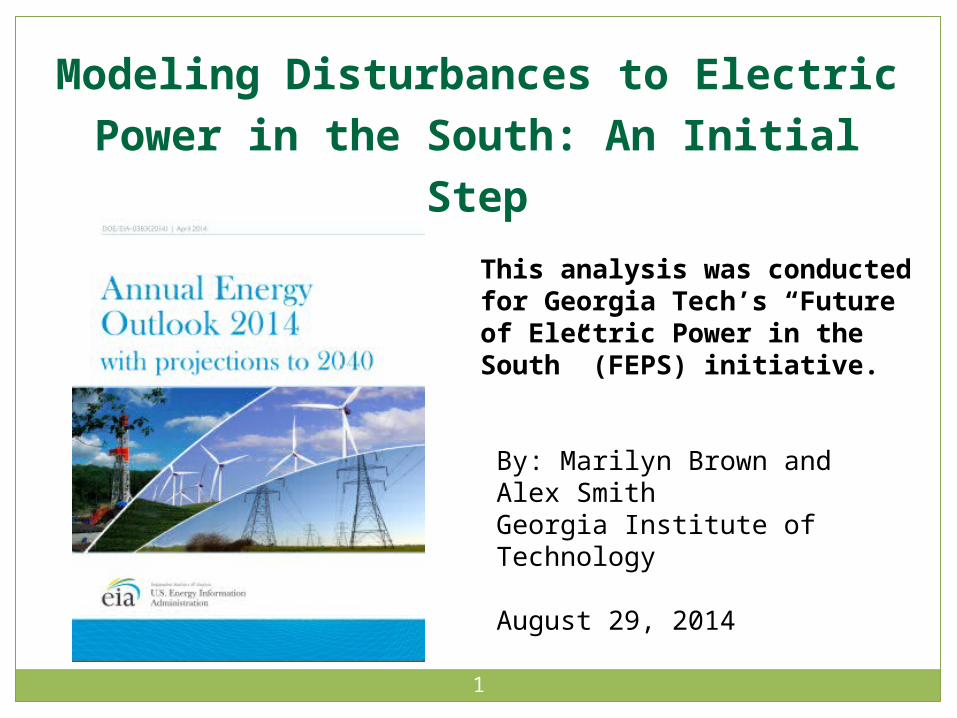
1
Modeling Disturbances to Electric Power in the South: An Initial Step
By: Marilyn Brown and Alex SmithGeorgia Institute of Technology
August 29, 2014
This analysis was conducted for Georgia Tech’s “Future of Electric Power in the South” (FEPS) initiative.

2
Progress Since our August 8th FEPS Webinar
• Continued to examine options for modeling “disruptions”.
• Modeled an initial disruption scenario using Georgia Tech’s National Energy Modeling System (GT-NEMS 2014).
• Developing an approach to modeling EPA Section 111(d) compliance options in the South on September 19 at 2 pm.
• Plans have continued for a meeting co-convened with Duke University’s Nicholas Institute at Georgia Tech on September 26: “Shaping the Southeast’s Energy Future: Regional Electricity Trends
and the EPA’s Clean Power Plan”
3
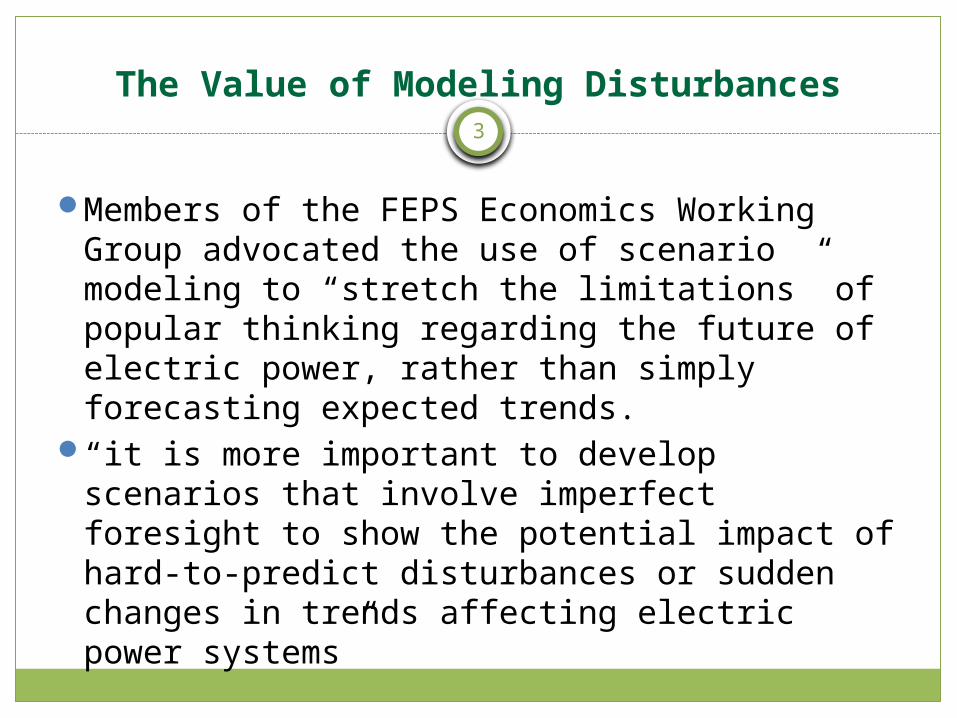
The Value of Modeling Disturbances
Members of the FEPS Economics Working Group advocated the use of scenario modeling to “stretch the limitations” of popular thinking regarding the future of electric power, rather than simply forecasting expected trends.
“it is more important to develop scenarios that involve imperfect foresight to show the potential impact of hard-to-predict disturbances or sudden changes in trends affecting electric power systems”

4
Our Initial “Disturbance Scenario” Has Multiple Storylines
We model a case where beginning in 2020 electricity demand significantly exceeds expectations, creating a need for rapid power system expansion.
This type of disturbance could be caused by: A sudden surge in global warming Malaise in EE and DG (the anticipated “vicious cycle of
utility company demand loss doesn’t play out”) A battery breakthrough that enables electric vehicles Rapid expansion of digital networks and the industrial
internet
5
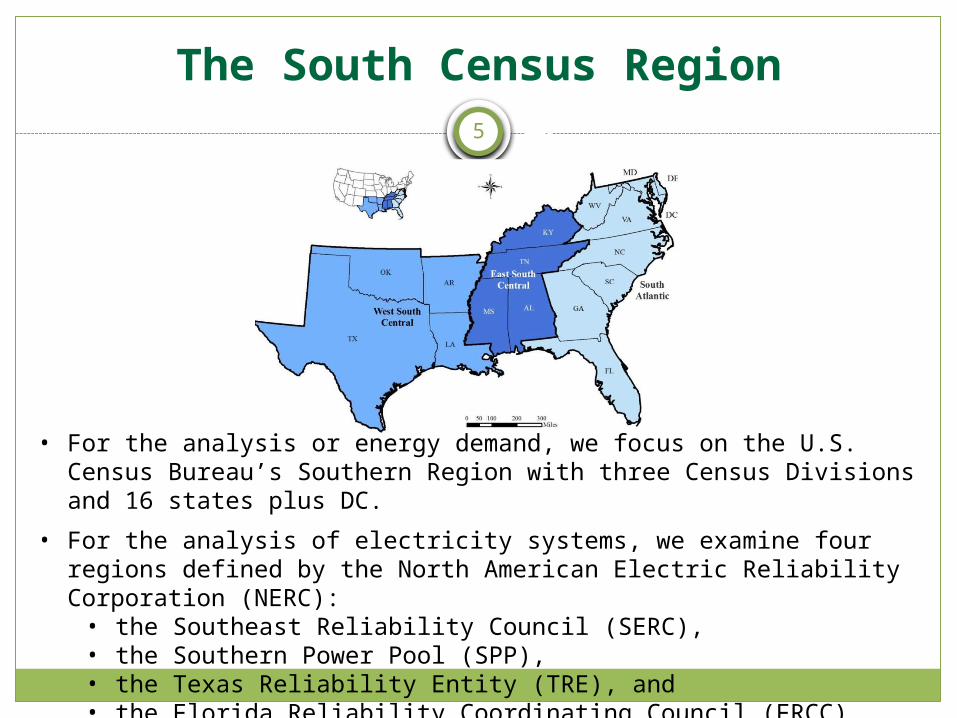
The South Census Region
• For the analysis or energy demand, we focus on the U.S. Census Bureau’s Southern Region with three Census Divisions and 16 states plus DC.
• For the analysis of electricity systems, we examine four regions defined by the North American Electric Reliability Corporation (NERC):
• the Southeast Reliability Council (SERC), • the Southern Power Pool (SPP), • the Texas Reliability Entity (TRE), and• the Florida Reliability Coordinating Council (FRCC).
6
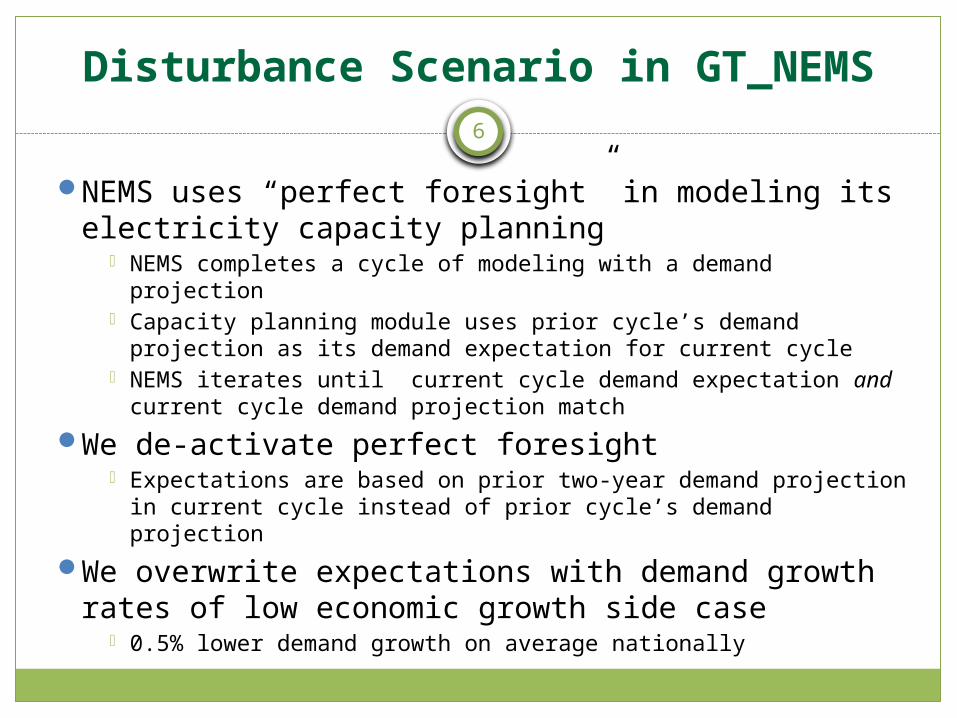
Disturbance Scenario in GT_NEMS
NEMS uses “perfect foresight” in modeling its electricity capacity planning
NEMS completes a cycle of modeling with a demand projection
Capacity planning module uses prior cycle’s demand projection as its demand expectation for current cycle
NEMS iterates until current cycle demand expectation and current cycle demand projection match
We de-activate perfect foresight Expectations are based on prior two-year demand projection
in current cycle instead of prior cycle’s demand projection
We overwrite expectations with demand growth rates of low economic growth side case
0.5% lower demand growth on average nationally
7
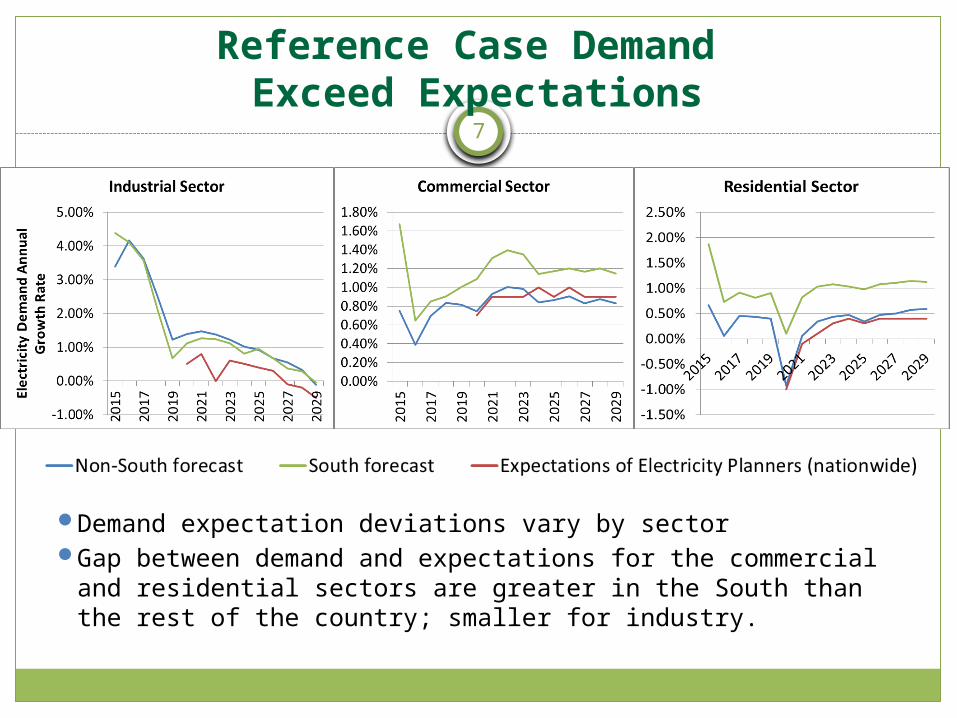
Reference Case Demand Exceed Expectations
Demand expectation deviations vary by sectorGap between demand and expectations for the
commercial and residential sectors are greater in the South than the rest of the country; smaller for industry.

8
The Disturbance Causes Less Capacity to be Built, and Less Generation
Capacity____________
Generation__________

9
Disturbance scenario exhibits improved energy efficiency of US economy
Disturbance case exhibits a ~5% decrease in energy intensity of US economy

10
Recall that Electricity Prices in the South are Projected to Remain Low
History Projections
2012
Projection for the South
Average Electricity Prices in the South, 2005-2040 (2012 cents per kWh)
The average annual growth rate of retail electricity prices from 2013-2040 is forecast to be 0.51% for the US, 0.47% for the South
Average Electricity Prices in the U.S, 2005-2040 (2012 cents per kWh)
11
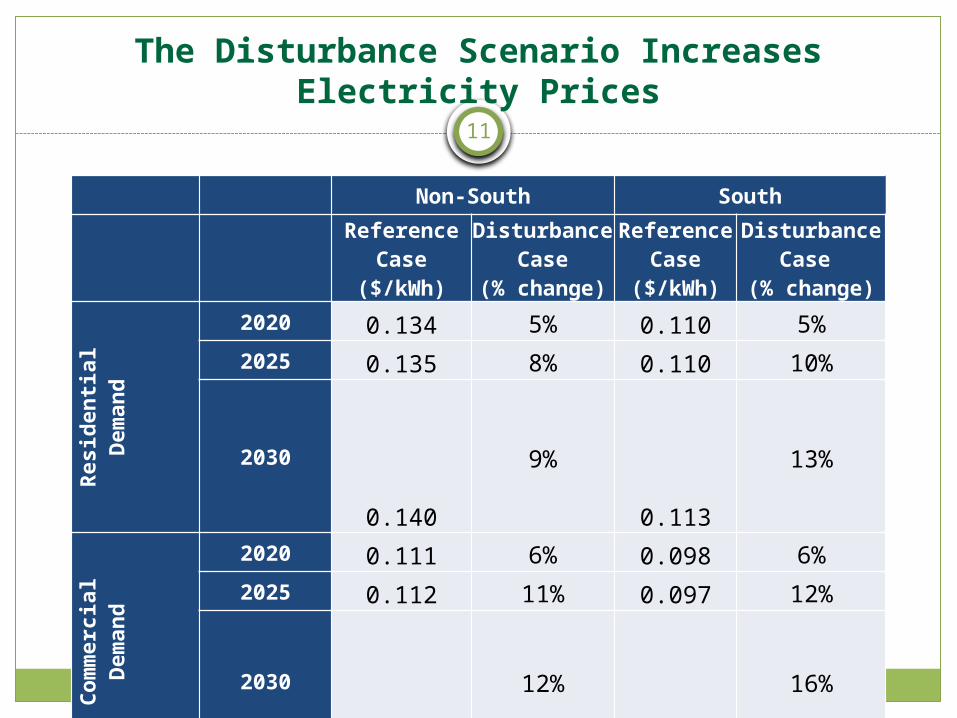
The Disturbance Scenario Increases Electricity Prices
Non-South South
Reference Case($/kWh)
Disturbance Case
(% change)
Reference Case($/kWh)
Disturbance Case
(% change)
Residential
Demand
2020 0.134 5% 0.110 5%
2025 0.135 8% 0.110 10%
2030 0.140 9% 0.113 13%
Commercial
Demand
2020 0.111 6% 0.098 6%
2025 0.112 11% 0.097 12%
20300.116
12%0.100
16%
Industrial Demand
2020 0.079 9% 0.066 8%
2025 0.081 14% 0.067 16%
2030 0.086 16% 0.070 22%
12
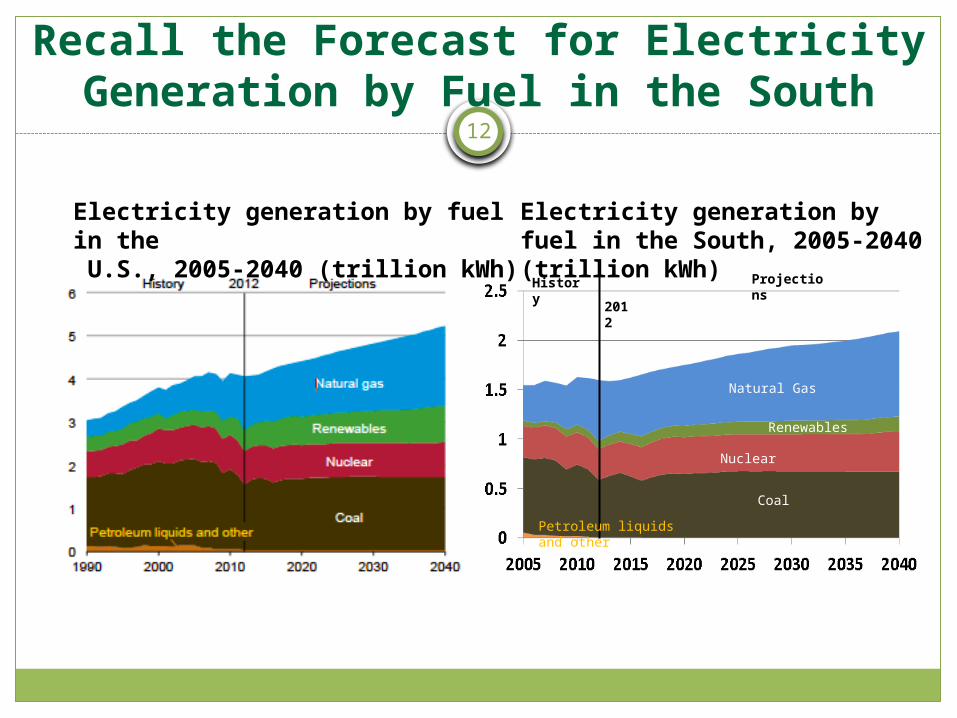
Recall the Forecast for Electricity Generation by Fuel in the South
History Projections
2012
Electricity generation by fuel in the South, 2005-2040 (trillion kWh)
Natural Gas
Renewables
Nuclear
Coal
Petroleum liquids and other
Electricity generation by fuel in the U.S., 2005-2040 (trillion kWh)
13
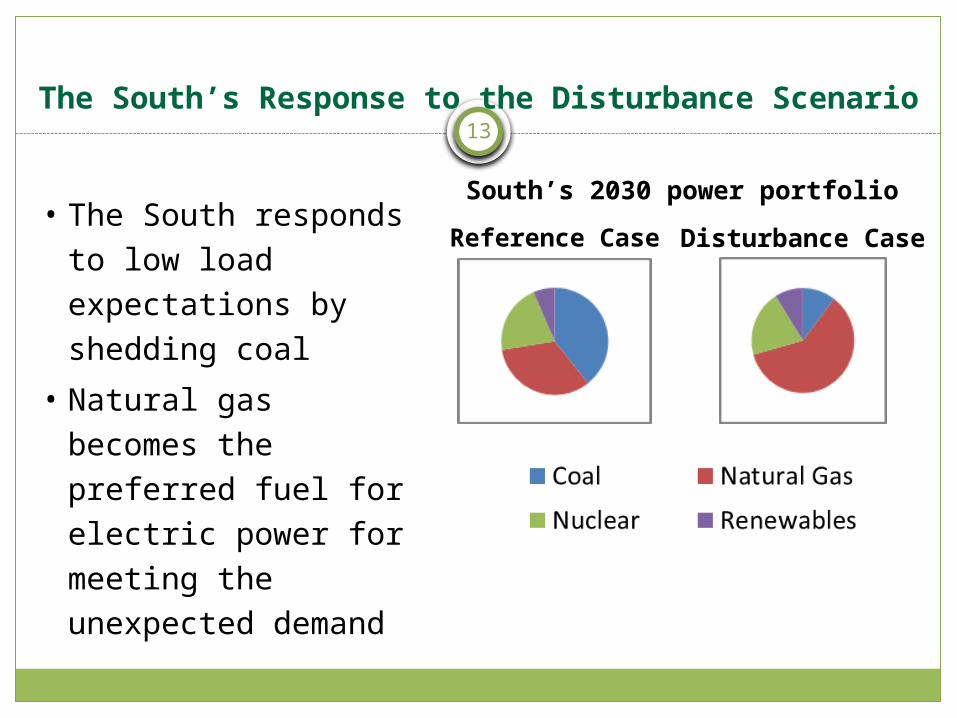
The South’s Response to the Disturbance Scenario
South’s 2030 power portfolio • The South responds
to low load expectations by shedding coal
• Natural gas becomes the preferred fuel for electric power for meeting the unexpected demand
Reference Case Disturbance Case

14
The Rest of the Country’s Response to the Disturbance Scenario
Non-south’s 2030 power portfolio • Non-south’s
response to disturbance involves retaining its renewables.
• Still, natural gas is the “swing fuel” for this region as well
Reference Case Disturbance Case

15
Ideas for Further Work on Disturbances
What other sorts of disturbances should be modeled? The FEPS Economics Working Group agreed that some scenario
involving a natural disaster or weather-related event would be useful, as such disturbances are expected to be more likely and more severe in the future – e.g. drought scenario
Two other scenarios were suggested: a high electricity demand, high economic growth scenario a low electricity demand, low economic growth scenario. Each of these scenarios was then to receive its own “shock”– that is,
a sudden change in trend.
Value of identifying low-cost means to improving power system resilience Modeling alternate assumptions with disturbances
16
Next Steps for FEPS
• Develop approach to modeling EPA Section 111(d) compliance options in the South.
• Prepare preliminary results to discuss at the fourth FEPS webinar on September 19.

17
For More Information
Professor Marilyn A. BrownSchool of Public PolicyGeorgia Institute of TechnologyAtlanta, GA [email protected] and Energy Policy Lab: http://www.cepl.gatech.edu
Research Assistants:
Alexander Smith [email protected]
Gyungwon [email protected]