1 Mid Day Meal Scheme Ministry of HRD Government of India MDM-PAB Meeting – NCT OF DELHI On...
29
1 Mid Day Meal Scheme Ministry of HRD Government of India MDM-PAB Meeting – NCT OF DELHI On 11.05.2009
-
Upload
preston-joseph -
Category
Documents
-
view
213 -
download
0
description
Questions? What is the level of coverage – Institution-wise, No. of children- wise, in terms of No. of meal served? What is the level of unspent balances (Inventory) as on as well as ? How regular the lifting of food grains? Is there any disruption/shortage in availability of food grains? What is the level of lifting? How about cooking cost? Was disbursed to Districts? What is the level of utilisation at school level? How synchronous utilisation of food grains and cooking cost? How utilisation of foodgrains reconcile with number of meal served? …… contd Ministry of HRD, Govt. of India
Transcript of 1 Mid Day Meal Scheme Ministry of HRD Government of India MDM-PAB Meeting – NCT OF DELHI On...
1
Mid Day Meal SchemeMinistry of HRD
Government of IndiaMDM-PAB Meeting – NCT OF DELHIOn 11.05.2009
Review of Implementation of MDMS in NCT of Delhi
(Primary + Upper Primary)(1.4.2008 to 31.12.2008)
Part-I
Ministry of HRD, Govt. of India

Questions? What is the level of coverage – Institution-wise, No. of children-
wise, in terms of No. of meal served? What is the level of unspent balances (Inventory) as on 31.03.08
as well as 31.12.08? How regular the lifting of food grains? Is there any
disruption/shortage in availability of food grains? What is the level of lifting? How about cooking cost? Was disbursed to Districts? What is
the level of utilisation at school level? How synchronous utilisation of food grains and cooking cost? How utilisation of foodgrains reconcile with number of meal
served?…… contd
Ministry of HRD, Govt. of India
Contd ….., Questions?
How much MME was utilized? Under what activities? What is the progress in construction of Kitchen Sheds
and procurement of kitchen devices?Part –II
What is the trend in Enrollment and No. of children availing MDM from 2007 to 2008?
How well MDM data compares with SSA data and Census data?
Ministry of HRD, Govt. of India
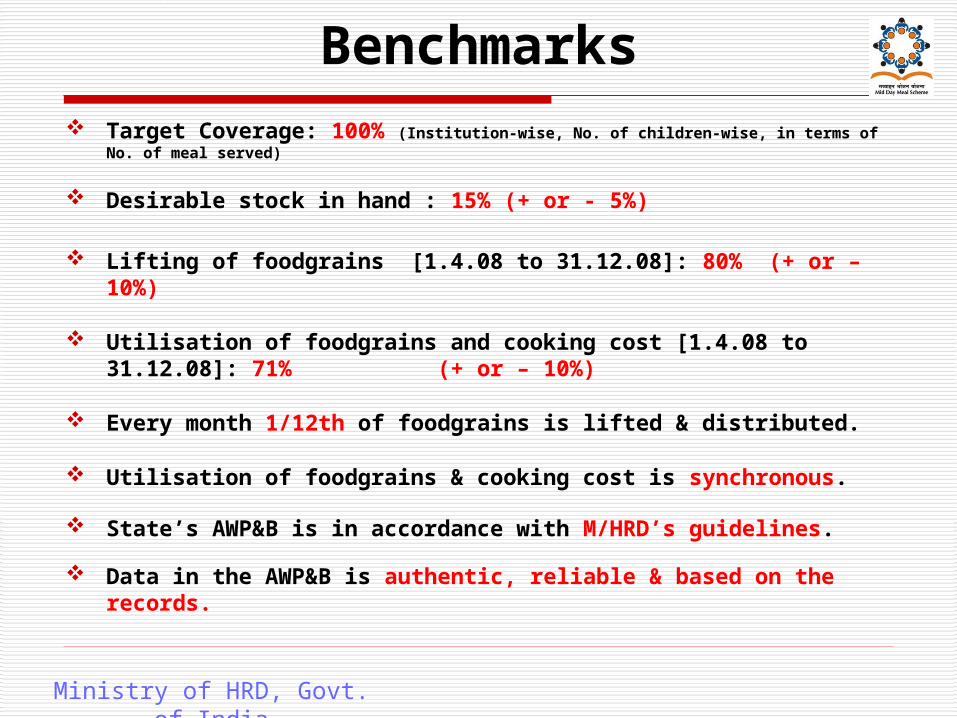
Benchmarks Target Coverage: 100% (Institution-wise, No. of children-wise, in terms of No. of meal served)
Desirable stock in hand : 15% (+ or - 5%)
Lifting of foodgrains [1.4.08 to 31.12.08]: 80% (+ or – 10%)
Utilisation of foodgrains and cooking cost [1.4.08 to 31.12.08]: 71% (+ or – 10%)
Every month 1/12th of foodgrains is lifted & distributed.
Utilisation of foodgrains & cooking cost is synchronous.
State’s AWP&B is in accordance with M/HRD’s guidelines.
Data in the AWP&B is authentic, reliable & based on the records.
Ministry of HRD, Govt. of India

Plan Vs Performance (No. of Meal in Q1+Q2+Q3)
Ministry of HRD, Govt. of India
3% Less
(Primary )

Plan Vs Performance (No. of Children in Q1+Q2+Q3)
Ministry of HRD, Govt. of India
2% Less
(Primary )

Plan Vs Performance (No. of Working Days in Q1+Q2+Q3)
Ministry of HRD, Govt. of India
(2% Less)
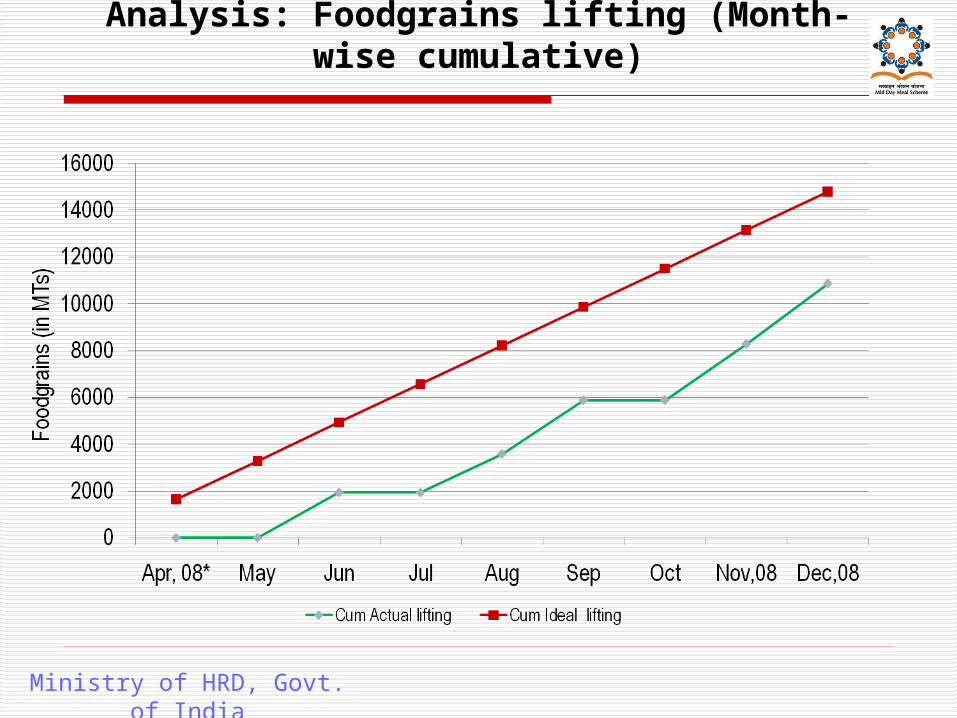
Analysis: Foodgrains lifting (Month-wise cumulative)
Ministry of HRD, Govt. of India

Analysis: Foodgrains lifting (Month-wise)
Ministry of HRD, Govt. of India
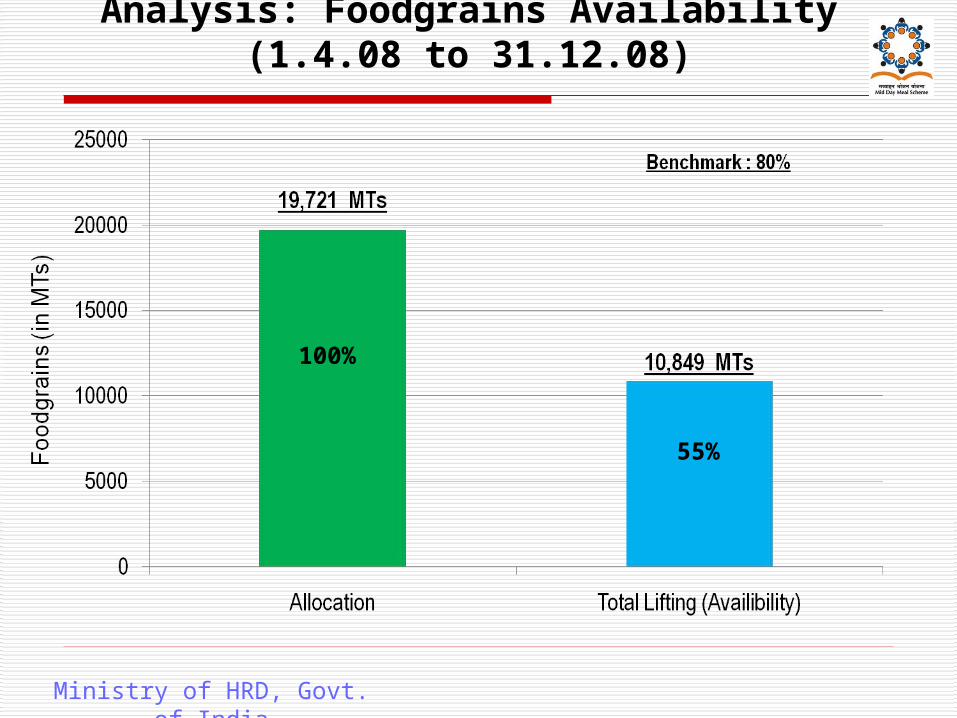
Analysis: Foodgrains Availability (1.4.08 to 31.12.08)
100%
55%
Ministry of HRD, Govt. of India
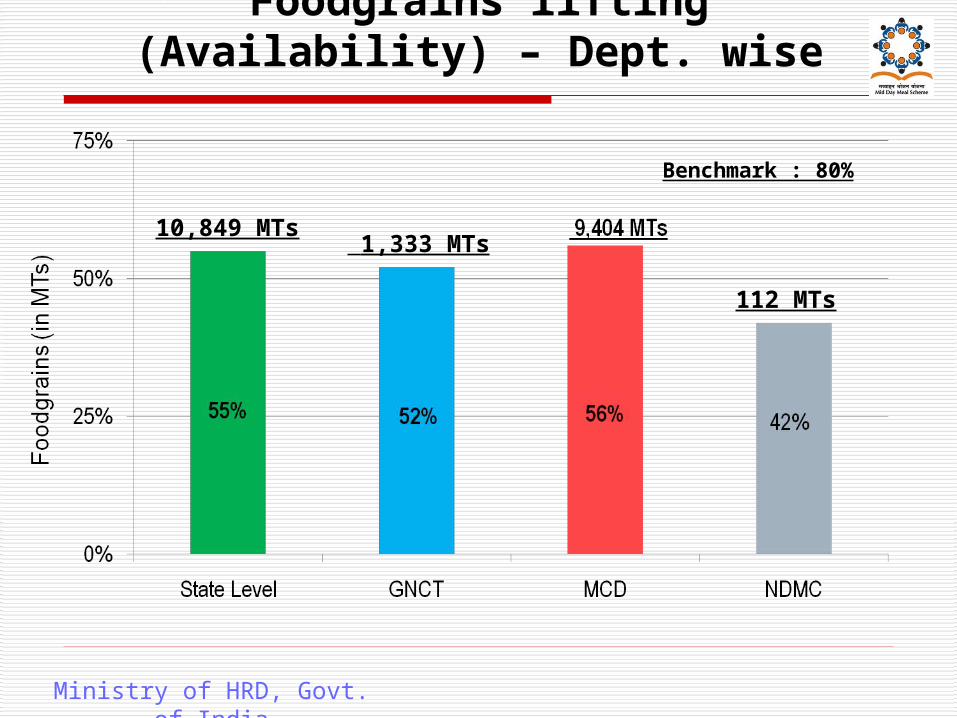
Foodgrains lifting (Availability) – Dept. wise
Ministry of HRD, Govt. of India
Benchmark : 80%
10,849 MTs 1,333 MTs
112 MTs
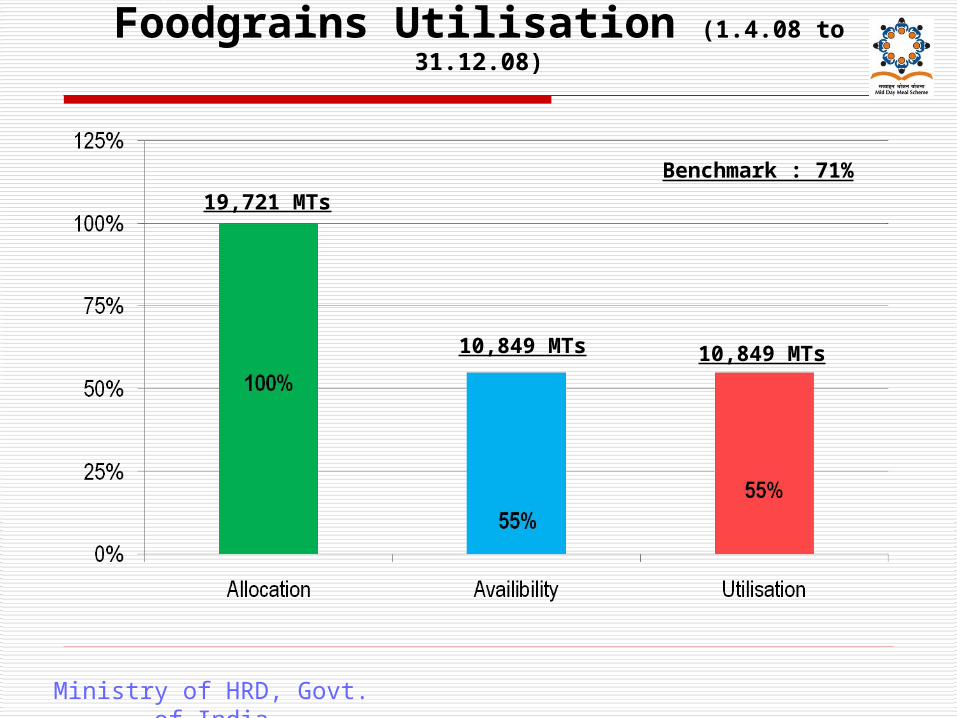
Foodgrains Utilisation (1.4.08 to 31.12.08)
Ministry of HRD, Govt. of India
Benchmark : 71%19,721 MTs
10,849 MTs 10,849 MTs

Cooking Cost Disbursed and Utilisation(1.4.2008 to 31.12.2008)
Benchmark :71%
Ministry of HRD, Govt. of India
Rs. 46.80 Cr.Rs. 35.87 Cr.
Rs. 22.43 Cr.
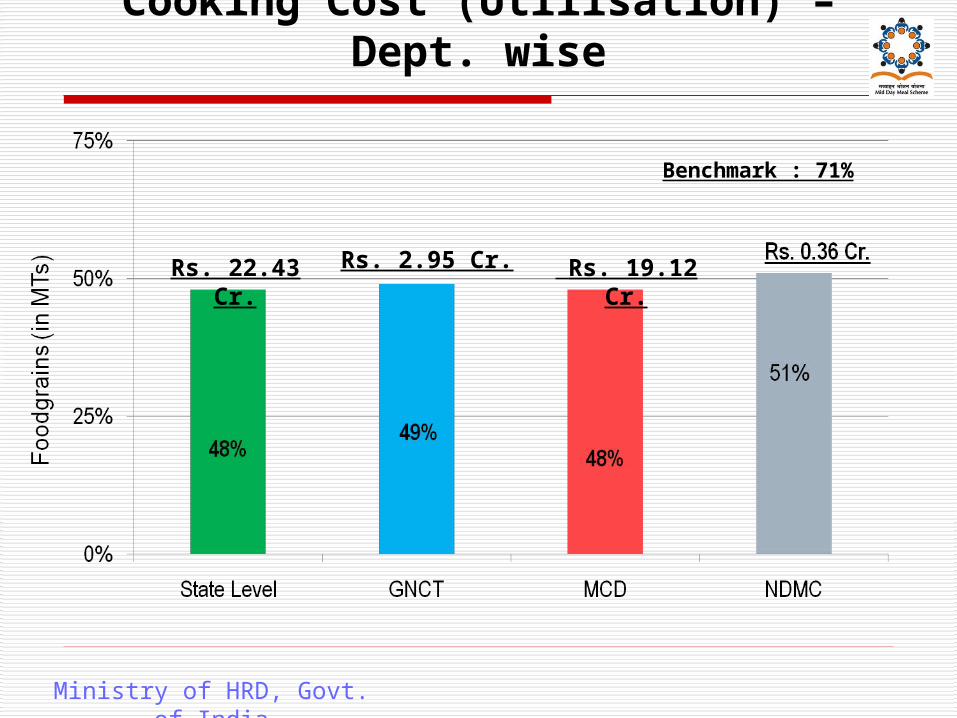
Cooking Cost (Utilisation) – Dept. wise
Ministry of HRD, Govt. of India
Benchmark : 71%
Rs. 2.95 Cr. Rs. 19.12 Cr.Rs. 22.43 Cr.
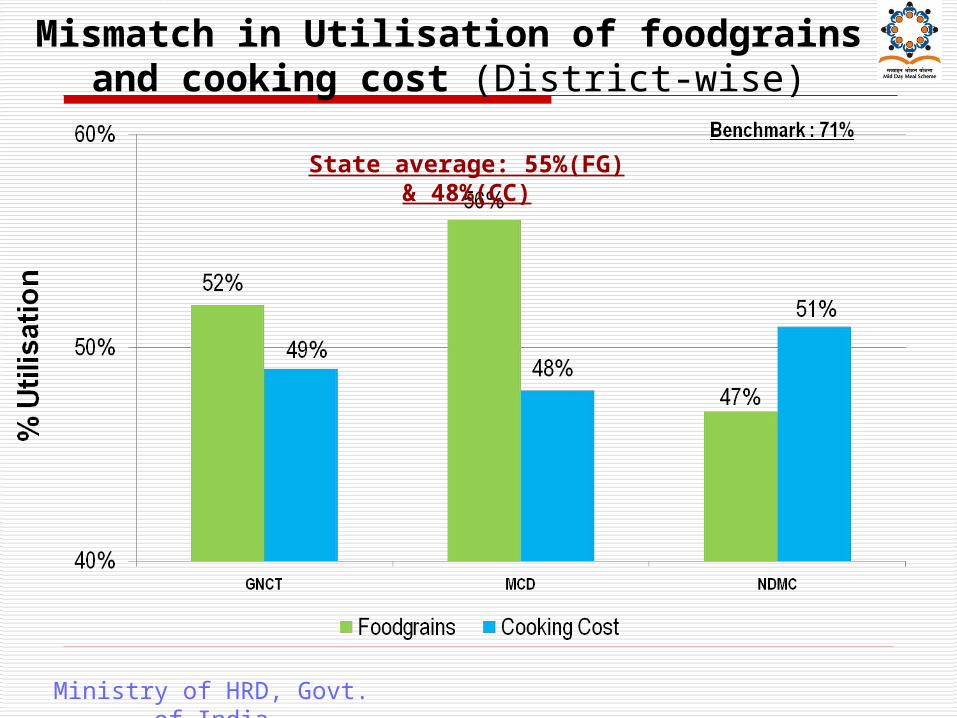
Mismatch in Utilisation of foodgrains and cooking cost (District-wise)
Ministry of HRD, Govt. of India
State average: 55%(FG) & 48%(CC)
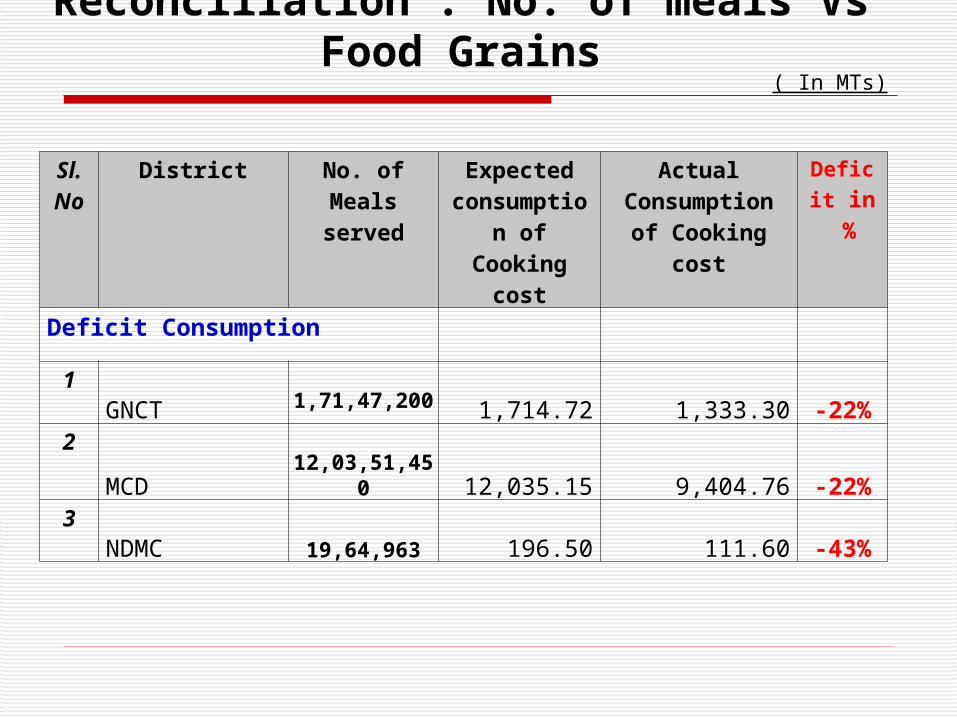
Reconciliation : No. of meals Vs Food Grains
Sl. No
District No. of Meals served
Expected consumption
of Cooking cost
Actual Consumption of
Cooking cost
Deficit in %
Deficit Consumption
1GNCT 1,71,47,200 1,714.72 1,333.30 -22%
2MCD 12,03,51,450 12,035.15 9,404.76 -22%
3NDMC 19,64,963 196.50 111.60 -43%
( In MTs)
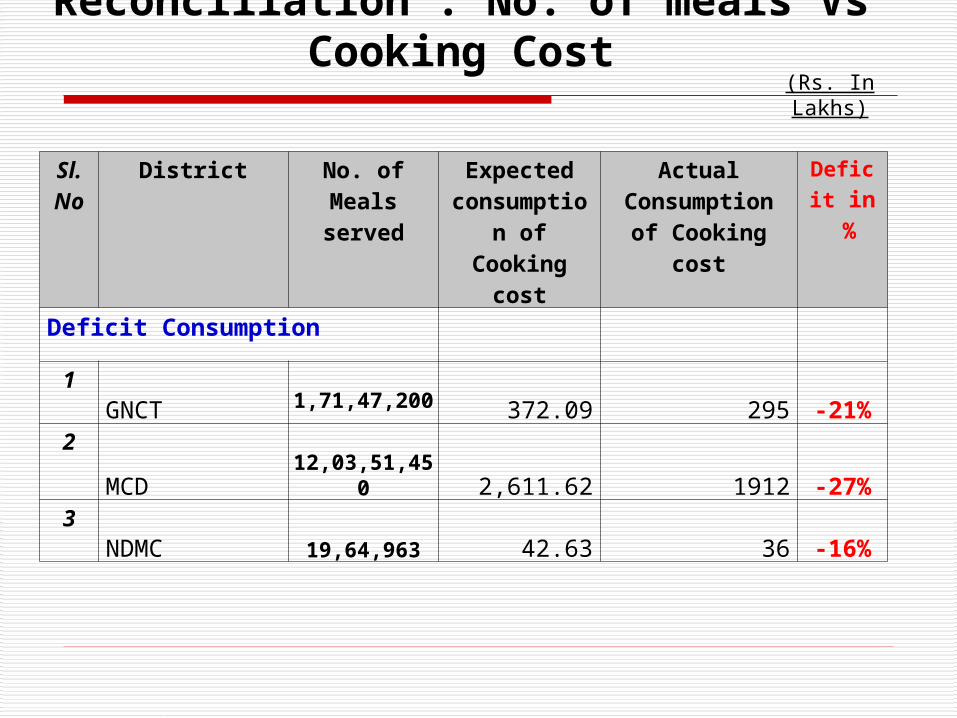
Reconciliation : No. of meals Vs Cooking Cost
Sl. No
District No. of Meals served
Expected consumption
of Cooking cost
Actual Consumption of
Cooking cost
Deficit in %
Deficit Consumption
1GNCT 1,71,47,200 372.09 295 -21%
2MCD 12,03,51,450 2,611.62 1912 -27%
3NDMC 19,64,963 42.63 36 -16%
(Rs. In Lakhs)
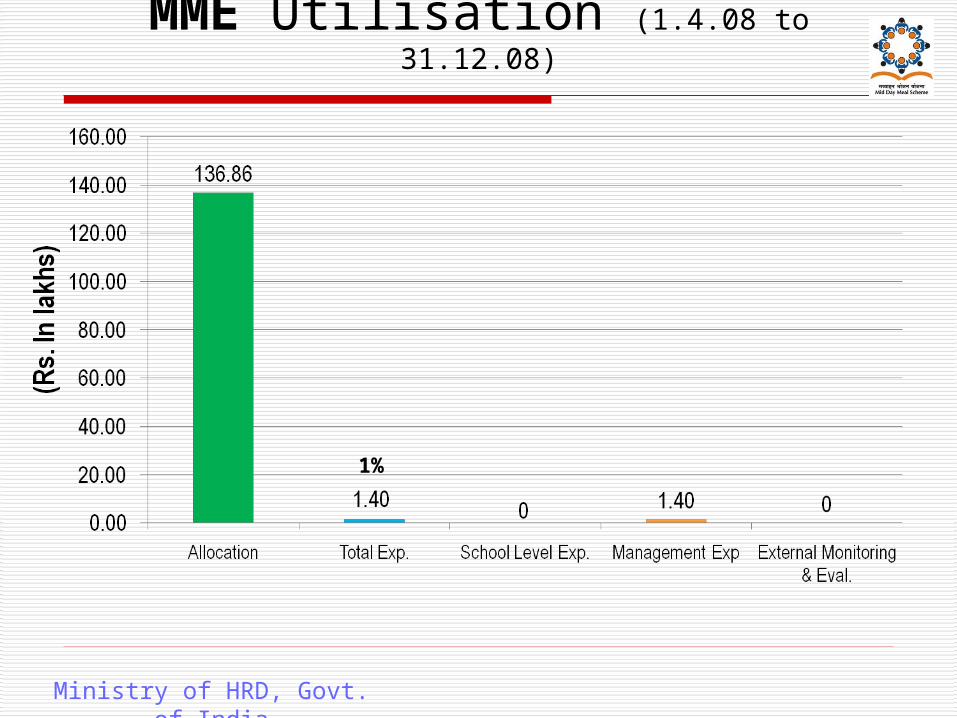
MME Utilisation (1.4.08 to 31.12.08)
Ministry of HRD, Govt. of India
1%

Transport Assistance Utilisation (1.4.08 to 31.12.08)
Ministry of HRD, Govt. of India
(100%)

Performance Score card – A Summary
Sl. No.
Component Achievement Benchmark
1. Foodgrains Availability 55% 80%2. Foodgrains Utilisation 55% 71%3. Cooking Cost Utilisation 48% 71%4. MME Utilisation 1% 100%
5 QPRs received 3 nos. (Only Pry) 3 nos.
Ministry of HRD, Govt. of India
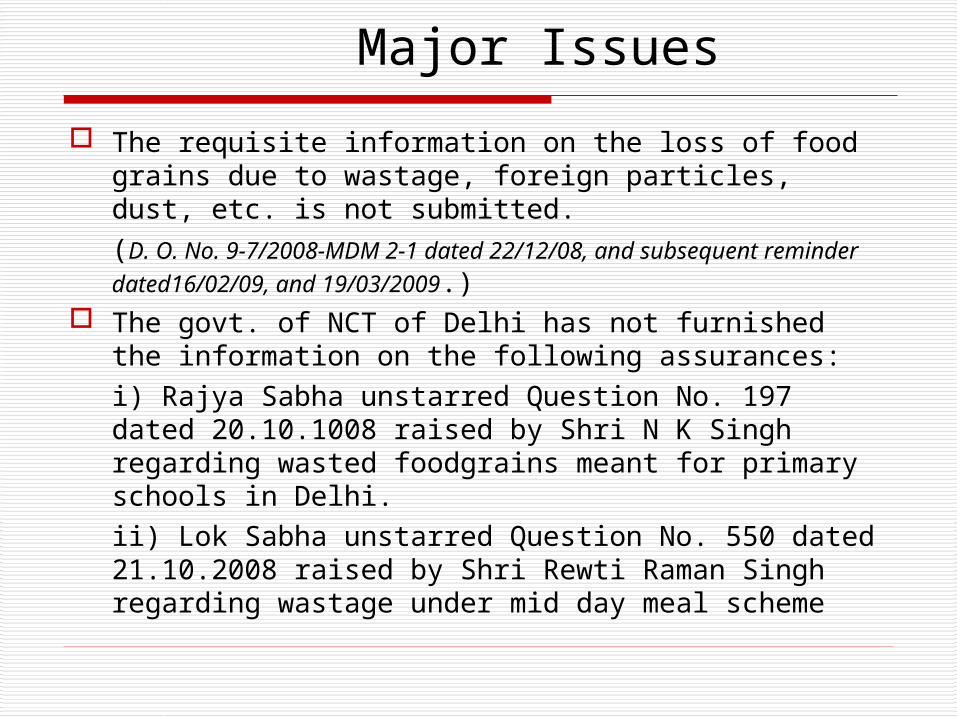
Major Issues
The requisite information on the loss of food grains due to wastage, foreign particles, dust, etc. is not submitted. (D. O. No. 9-7/2008-MDM 2-1 dated 22/12/08, and subsequent reminder dated16/02/09, and 19/03/2009.)
The govt. of NCT of Delhi has not furnished the information on the following assurances:i) Rajya Sabha unstarred Question No. 197 dated 20.10.1008 raised by Shri N K Singh regarding wasted foodgrains meant for primary schools in Delhi.ii) Lok Sabha unstarred Question No. 550 dated 21.10.2008 raised by Shri Rewti Raman Singh regarding wastage under mid day meal scheme
Analysis of State’s Proposal for 2009-10
Ministry of HRD, Govt. of India

Time Series – No. of Children (PRIMARY)
11.2811.89
9.86 9.66
0
2
4
6
8
10
12
14
2007-08 2008-09
(13% Less)(19% less)
Ministry of HRD, Govt. of India
Enrollment Availing MDM

Primary School Enrolment – SSA [Govt. + Govt.-aided + LB) Vs MDM
Ministry of HRD, Govt. of India
(7% More) (13% More)

Population Vs Enrolment Vs Availing MDM (PRIMARY)
Ministry of HRD, Govt. of India
2009-10 (Proposed)
Q-1 Q-2 Q-3
11.89

Population Vs Enrolment Vs Availing MDM during 2008-09 (UPPER PRIMARY)
Ministry of HRD, Govt. of India
*:SSA= Govt+LB+GA
2009-10 (Proposed)

No. of School Working Days (Pry & U Pry)DISE Vs MDM
Ministry of HRD, Govt. of India
Sl. No
Year As per DISE Data
As per MDM Sanctions
1 2006-07 216 200
3 2007-08 211 200
4 2008-09 200
5 2009-10 Not available 210(State’s claim for
2009-10)
Thank You
Ministry of HRD, Govt. of India