1 Market Information and Opportunities for Trade with Europe March 23, 2011.
45
1 Market Information Market Information and Opportunities and Opportunities for Trade with for Trade with Europe Europe March 23, 2011
-
Upload
christine-watts -
Category
Documents
-
view
215 -
download
3
Transcript of 1 Market Information and Opportunities for Trade with Europe March 23, 2011.

1
Market Information Market Information and Opportunitiesand Opportunities
for Trade with for Trade with EuropeEurope
March 23, 2011

2
OutlineOutlineOutlineOutline● General Points to Note
● Overview of Regional & National Trade with the EU
● Overview of the Food & Beverage Industry in EU
● Trends and Opportunities in major Food & Beverage Sectors Meat Products Processed Fruits and Vegetables Dairy Products Sugar and Sugar Based Products Fish and Seafood Beverages
● Other Sectors of Interest
● Conclusions

General Points to NoteGeneral Points to Note

ObjectivesObjectives● To provide insight into the European Union’s
(EU) market for food & beverage products
● To identify EU trends in food & beverage sector
● To identify opportunities for exports of Trinidad and Tobago’s food and beverage products to the EU
4

5
MethodologyMethodology● Examined EU Food and Beverage Industry reports
● Analyzed current and potential trade data for the period 2005-2009 Bilateral Trade between the EU and TT TT World Exports EU World Imports
● Matched rising TT exports (globally) to rising EU imports
● Identified other opportunities for products based
on the national, regional and international trade climate

6
Additional Points to NoteAdditional Points to Note● Data source: Trade-map, International Trade
Centre
● All monetary figures are quoted in $US
● The effects of the global financial and economic crises which began in 2007, were realised in 2009
● The EU refers to the EU 27, whose
members are as follows:

Members of the European Members of the European Union 27Union 27● Austria
● Belgium ● Bulgaria ● Cyprus ● Czech Republic ● Denmark ● Estonia ● Finland ● France ● Germany ● Greece ● Hungary ● Ireland ● Italy
● Latvia ● Lithuania ● Luxembourg ● Malta ● Netherlands ● Poland ● Portugal ● Romania ● Slovakia ● Slovenia ● Spain ● Sweden ● United Kingdom
7
Overview of Regional Overview of Regional and National Trade with and National Trade with the EUthe EU

CARICOM Exports to the CARICOM Exports to the EUEU
9

TOTAL T&T EXPORTSTOTAL T&T EXPORTS
10

T&T F&B EXPORTS TO THE T&T F&B EXPORTS TO THE EUEU
11

Overview of the Overview of the European Food and European Food and Beverage SectorBeverage Sector
12

EU Food & Beverage SectorEU Food & Beverage Sector● Approximately 310,000 companies● Employ over 4 million persons● Total Population of 501 million (1.1.2011)● Largest food consumption potential in the world
● Main EU demand trends: Healthy nutritious food Low-fat, organic food Convenient pre-packaged and pre-cooked food
13

Trends and Trends and Opportunities in Major Opportunities in Major Food and Beverage Food and Beverage SectorsSectors

Major EuropeanMajor EuropeanFood & Beverage SectorsFood & Beverage Sectors
● Food Sectors: Meat products Processed fruit and
vegetables Dairy products Sugar and sugar based
products Fish and seafood
● Beverages Sectors: Wines Beer Spirits Mineral water Soft drinks
15

Meat ProductsMeat Products● Main meat products: pork, poultry and beef
● Major producing countries: Spain, Netherlands and Germany
● The EU meat industry is weak: Non-European countries such as Brazil and
Argentina supply cheaper meat products.● Source: Business Monitor International
16

Trade in Meat ProductsTrade in Meat Products● The EU imports 46.4%
of total world exports
● EU imports grew by approx. 32% over the period 2005-2009
● Fastest growing EU markets include: Poland (41%) Czech Republic (21%) Netherlands (15%)
● T&T’s fastest growing exports: Boneless bovine cuts Swine carcasses Fresh, chilled or frozen
fowls
● Challenges: Trade barriers Sanitary protection
laws Outbreaks of animal
disease
17

Processed Fruits and Processed Fruits and VegetablesVegetables● Accounts for more than 50% of EU consumption.
● This sector has great potential for foreign companies - the EU’s supply is insufficient.
● Major products demanded include: Canned and frozen vegetables Fruit juices Fruit preparations Jams and jellies Potato products Canned vegetables
18

Trade in Processed Fruits Trade in Processed Fruits and Vegetablesand Vegetables
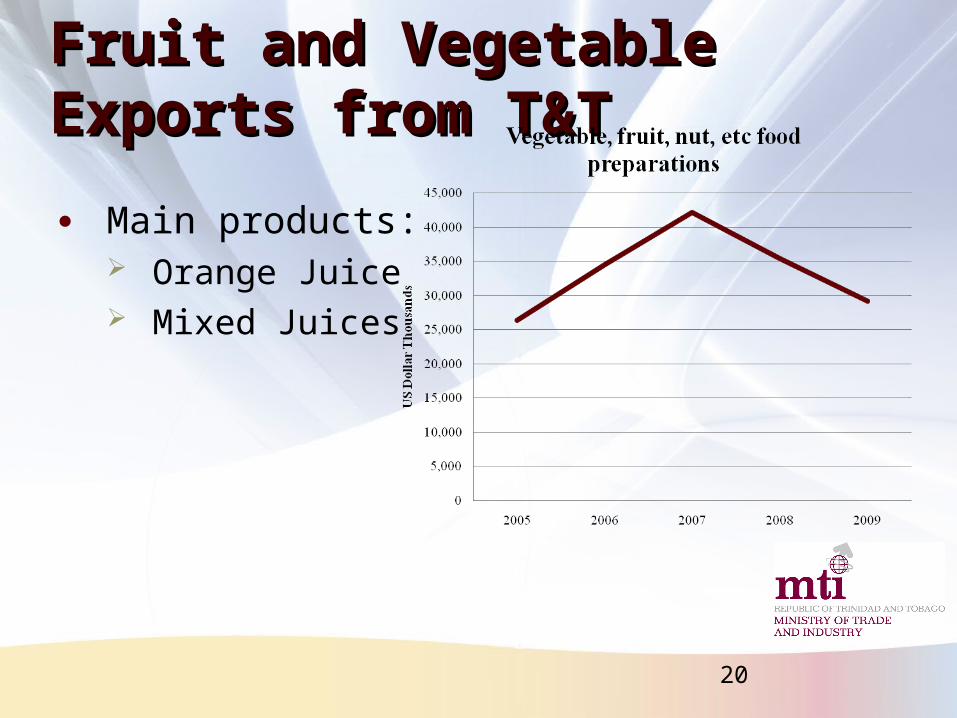
● The EU imports 50.2% of total world exports for vegetable, fruit, nuts etc
● T&T presently exports these products to: Netherlands France UK Germany Italy
19
Fruit and Vegetable Fruit and Vegetable Exports from T&TExports from T&T
● Main products: Orange Juice Mixed Juices
20

Dairy ProductsDairy Products● The EU produces mainly
for the domestic market
● Major producers – Austria, Italy, France
● EU exports includes: Milk powder Cheese Yoghurt Butter Ice-cream
● Increasing trends towards: Low-fat alternatives
e.g. skimmed milk Single serving
packages Marketing of health
benefits
21

Trade in Dairy ProductsTrade in Dairy Products● EU imports of dairy
products grew by 27.6% per year (2005 – 2009) Expected to reach
57.9%
● T&T currently exports: Milk and Cream To France and Italy
● Items of interest include: Cheese and curd Milk and cream
22

Sugar based productsSugar based products
● In the EU, sugar manufactured from beet is an input for candy.
● Major products include: Sugar confectionery Chocolate confectionery Bakery wares
● Emphasis on natural and
artificial sweeteners
23

Trade in Sugar Based Trade in Sugar Based ProductsProducts● The EU imports 35.1%
of the world's sugar based products
● T&T exports: Sweetened and
unsweetened biscuits Bread and cakes
● Items of interest include: Chewing gum Sugar confectionery
(candy) Chocolate
24
25
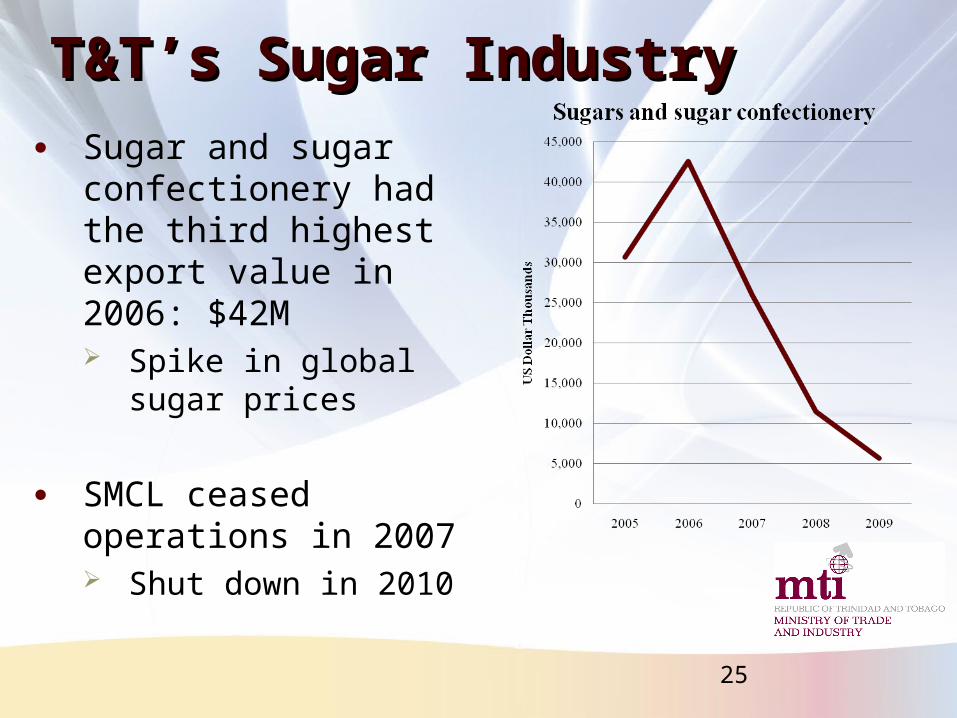
T&T’s Sugar IndustryT&T’s Sugar Industry● Sugar and sugar
confectionery had the third highest export value in 2006: $42M Spike in global sugar
prices
● SMCL ceased operations in 2007 Shut down in 2010

26
T&T’s Exports of Sugar T&T’s Exports of Sugar Based ProductsBased Products

27
Cocoa and Cocoa Cocoa and Cocoa PreparationsPreparations● Chocolate and other food preparations
EU world imports: $4 billion+ per year T&T world exports: $6 million per year T&T exports to the EU: $465, 000 per year
● Cocoa Beans EU world imports: $3 billion per year T&T world exports: $3 million per year T&T exports to the EU: $1 million

28
Fish and SeafoodFish and Seafood● Main sub-sectors are:
Fresh products Frozen foods and Canned fish/shellfish
● Third world countries can supply frozen/canned products extremely cheaply.
● Preferred species based on tradition of particular countries/regions.
● The EU imports the raw fish and shellfish and then processes it further into convenience food for consumption.

29
Trade in Fish and SeafoodTrade in Fish and Seafood● Top EU suppliers:
Spain Belgium France
● T&T currently exports to: United Kingdom Netherlands
● Potential Products: Fillets Crustaceans Sardines Frozen fish meat, tunas
(yellow fin and big eye)

30
Fish, crustaceans, molluscs Fish, crustaceans, molluscs nesnes● EU imported
approximately $2 billion per year in whole fresh fish 2nd highest import value
for EU
● T&T exported average of $3.7 million per year to the rest of the world An average of $12,000
per year goes to the EU

31
BeveragesBeverages● The EU exports:
¼ of the world’s alcohol More than ½ of the world's wine Mineral water Soft drinks
World leaders in the beer market include: Belgium The United Kingdom Netherlands Denmark
Wine production remains fragmented according to regions throughout Europe
The key to success in the beverage industry is Strong branding Wide product range New products and innovation

32
Trade in BeveragesTrade in Beverages● The EU imports 45.9% of the
world’s beverages exports
● T&T currently exports to: Netherlands France UK
● Export Products for T&T: Orange, Grapefruit and
Pineapple juices Rum Bitters

33
Beverages, spirits and Beverages, spirits and vinegarvinegar● Valuable products:
undenatured ethyl alcohol
rum and tafia beer made from malt
● Further opportunities: non-alcoholic beverages
nes excluding fruit and vegetable juices

Other Potential Exports Other Potential Exports
34

35
Animal, Vegetable Fats and Animal, Vegetable Fats and OilsOils● The EU imports 33.3% of
world exports
● T&T currently exports to: UK France Greece
● Growing EU Markets: Italy Germany Netherlands Spain
● Potential Products: Margarine
EU world imports: $4 billion/year
T&T world exports: $27 million/year
Coconut Oil EU world imports: $180
million/year T&T world exports: $1.5
million/year

36
Edible vegetables and Edible vegetables and certain roots and tuberscertain roots and tubers
● Specific products include: Onions Garlic Cabbages Peas / Lentils Peppers Potatoes
● Edible fruits, nuts, citrus etc Potential market: Germany
● T&T’s main exports: Paw paws Melons Coconuts
37
Coffee, tea mate and Coffee, tea mate and spices spices ● Market Dynamics: Main importers include: Belgium, Germany and the
Netherlands Fastest growing markets: France (17%), Italy (16%), United
Kingdom (12%)
● Tobacco and manufactured tobacco substitutes TT currently exports to Greece Potential markets include Italy, Germany and Belgium
● T&T can export to the EU: Coffee Green tea Black tea Pepper Cumin seeds Cigarettes containing tobacco
38
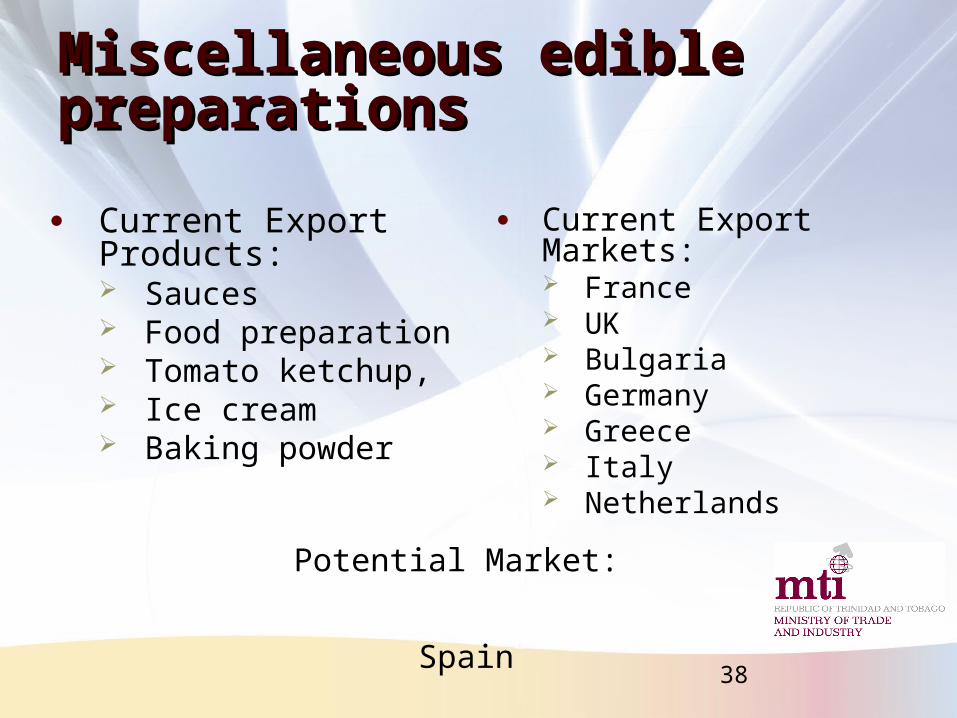
Miscellaneous edible Miscellaneous edible preparationspreparations
● Current Export Products: Sauces Food preparation Tomato ketchup, Ice cream Baking powder
● Current Export Markets: France UK Bulgaria Germany Greece Italy Netherlands
Potential Market:
Spain

39
Miscellaneous edible Miscellaneous edible preparationspreparations● Specific products:
Sauces Preparations, Mixed condiments Mixed seasoning
products Tomato ketchup

CONCLUSIONSCONCLUSIONS
40
41
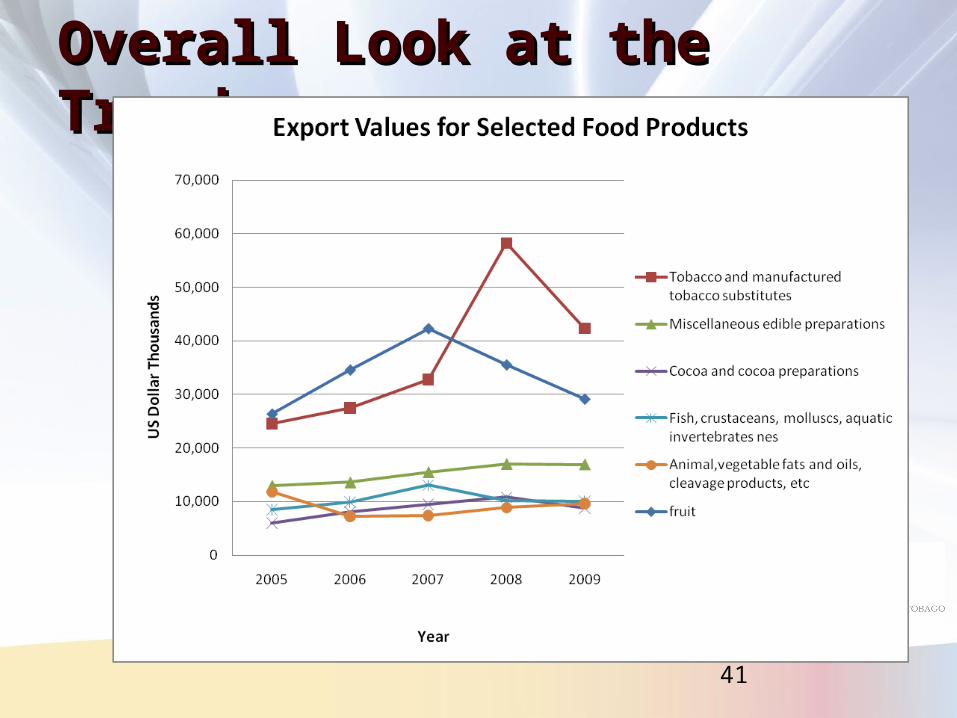
Overall Look at the Overall Look at the TrendsTrends

42
Illustration of the TrendsIllustration of the Trends

43
ConclusionsConclusions● The CARIFORUM-EC Economic Partnership
Agreement can help facilitate exports
● Domestic market size should not influence production levels
● Take advantage of the benefits of Economies of Scale: Maximize production/ Use up excess capacity Use this opportunity to invest and expand
● EXPORT to the EU!!!

QUESTIONS?QUESTIONS?
44

THANK YOU!THANK YOU!
ContactsMs. Trudy Lewis
Senior Trade Specialist
Level 14 Nicholas Tower
Tel: 623-2931/4 Ext 2113
Email: [email protected]
Website: www.tradeind.gov.tt
Ms. Krysta Ramrattan
Economist I
Level 14 Nicholas Tower
Tel: 623-2931/4 Ext. 2100
Email: [email protected]
45