1 LEGAL STATUS AND OPERATIONS
53
1 LEGAL STATUS AND OPERATIONS First International Investment Bank Limited (INTERBANK) is a public limited company incorporated in Pakistan on February 7, 1990 under the Companies Ordinance, 1984. Its shares are quoted on the Karachi and Lahore Stock Exchanges. The registered office of Interbank is situated at 5 F.C.C., Gulberg, Lahore. The principal place of business is situated at 7th Floor, Shaheen Commercial Complex, Dr. Ziauddin Ahmed Road, Karachi. INTERBANK is licensed to carry out all investment finance activities and leasing operations as a Non-Banking Finance Company under Section 282C of the Companies Ordinance, 1984 and Non-Banking Finance Companies (Establishment and Regulation) Rules, 2003. In addition, INTERBANK also offers brokerage services to retail and institutional clients. Based on the financial results for the year ended June 30, 2005, the Pakistan Credit Rating Agency (PACRA) maintained the long-term credit rating of INTERBANK at 'A' and the short-term rating at 'A1'. During the year INTERBANK has acquired Finex Securities Limited, a brokerage house in Karachi, and has established IGI Funds Limited, an Asset Management Company. These financial statements are the separate financial statements of First International Investment Bank Limited. In addition to these financial statements, consolidated financial statements of the company and its subsidiary companies, Finex Securities Limited and IGI Funds Limited, have also been prepared. 2 STATEMENT OF COMPLIANCE These financial statements have been prepared in accordance with the approved accounting standards as applicable in Pakistan, interpretations issued by the Standards Interpretations Committee of the IASC and the requirements of the Companies Ordinance, 1984, the Non- Banking Finance Companies (Establishment and Regulation) Rules, 2003 (NBFC Rules) and the Prudential Regulations for Non-Banking Finance Companies (Prudential Regulations). Approved accounting standards comprise of such International Accounting Standards (IASs) as notified under the provisions of the Companies Ordinance, 1984. Wherever the requirements of the Companies Ordinance, 1984, NBFC Rules, Prudential Regulations and directives issued by the Securities and Exchange Commission of Pakistan (SECP) differ with the requirements of these standards, the requirements of the Companies Ordinance, 1984, NBFC Rules, Prudential Regulations and the said directives take precedence. The SECP has deferred the applicability of International Accounting Standard 39, Financial Instruments: Recognition and Measurement (IAS 39) and International Accounting Standard 40, Investment Property (IAS 40) to Non-Banking Finance Companies (NBFCs) providing
Transcript of 1 LEGAL STATUS AND OPERATIONS

1 LEGAL STATUS AND OPERATIONS
First International Investment Bank Limited (INTERBANK) is a public limited companyincorporated in Pakistan on February 7, 1990 under the Companies Ordinance, 1984. Itsshares are quoted on the Karachi and Lahore Stock Exchanges. The registered office ofInterbank is situated at 5 F.C.C., Gulberg, Lahore. The principal place of business is situatedat 7th Floor, Shaheen Commercial Complex, Dr. Ziauddin Ahmed Road, Karachi.
INTERBANK is licensed to carry out all investment finance activities and leasing operationsas a Non-Banking Finance Company under Section 282C of the Companies Ordinance, 1984and Non-Banking Finance Companies (Establishment and Regulation) Rules, 2003. In addition,INTERBANK also offers brokerage services to retail and institutional clients.
Based on the financial results for the year ended June 30, 2005, the Pakistan Credit Rating Agency(PACRA) maintained the long-term credit rating of INTERBANK at 'A' and the short-term ratingat 'A1'.
During the year INTERBANK has acquired Finex Securities Limited, a brokerage house inKarachi, and has established IGI Funds Limited, an Asset Management Company.
These financial statements are the separate financial statements of First International InvestmentBank Limited. In addition to these financial statements, consolidated financial statements ofthe company and its subsidiary companies, Finex Securities Limited and IGI Funds Limited,have also been prepared.
2 STATEMENT OF COMPLIANCE
These financial statements have been prepared in accordance with the approved accountingstandards as applicable in Pakistan, interpretations issued by the Standards InterpretationsCommittee of the IASC and the requirements of the Companies Ordinance, 1984, the Non-Banking Finance Companies (Establishment and Regulation) Rules, 2003 (NBFC Rules) andthe Prudential Regulations for Non-Banking Finance Companies (Prudential Regulations).Approved accounting standards comprise of such International Accounting Standards (IASs)as notified under the provisions of the Companies Ordinance, 1984. Wherever the requirementsof the Companies Ordinance, 1984, NBFC Rules, Prudential Regulations and directives issuedby the Securities and Exchange Commission of Pakistan (SECP) differ with the requirementsof these standards, the requirements of the Companies Ordinance, 1984, NBFC Rules,Prudential Regulations and the said directives take precedence.
The SECP has deferred the applicability of International Accounting Standard 39, FinancialInstruments: Recognition and Measurement (IAS 39) and International Accounting Standard40, Investment Property (IAS 40) to Non-Banking Finance Companies (NBFCs) providing

Investment Finance Services, Discounting Services and Housing Finance Services vide theirCircular No. 19 dated August 13, 2003.
Standards, interpretations and amendments to published approved accountingstandards that are not yet effective
The following IAS, which have been published, have been revised and the amendments areapplicable to the financial statements of the company covering accounting periods beginningon or after January 1, 2006 or later periods:
IAS 1 Presentation of Financial Statements - Capital Disclosures effective from January 1, 2007
IAS 19 (Amendments) – Employee Benefits effective from January 1, 2006
Adoption of the above amendments would result in an impact on the extent of disclosurespresented in the future financial statements of INTERBANK.
3 BASIS OF MEASUREMENT
These financial statements have been prepared under the historical cost convention, exceptthat the held for trading and available-for-sale investments and derivative financial instrumentsare stated at fair value.
The preparation of financial statements in conformity with International Accounting Standardsrequires the use of certain accounting estimates. It also requires management to exercise itsjudgement in the process of applying the company's accounting policies. The areas involvinga higher degree of judgement or complexity, or areas where assumptions and estimates aresignificant to the financial statements, are disclosed in Note 52 to the financial statements.
4 SUMMARY OF SIGNIFICANT ACCOUNTING POLICIES
The significant accounting policies applied in the preparation of these financial statements areset out below. These policies have been applied consistently, unless otherwise stated.
4.1 Investments
The management of INTERBANK determines the appropriate classification of itsinvestments at the time of purchase and classifies these investments as held for trading,available-for-sale or held-to-maturity.
Held for Trading
These are securities which are acquired principally for the purpose of generating profitfrom short-term fluctuations in market prices, interest rate movement, dealer's margin orare securities included in a portfolio in which a pattern of short-term profit taking exists.

Available for Sale
These are investments intended to be held for an indefinite period of time which maybe sold in response to needs for liquidity or changes to interest rates, exchange ratesor equity prices.
Held-to-Maturity
These are securities with fixed or determinable payments and fixed maturity that themanagement has the positive intent and ability to hold to maturity.
All investments are initially recognised at cost, being the fair value of the consideration given.
Subsequent to initial recognition, investments in quoted securities are marked to market,in accordance with the guidelines contained in the State Bank of Pakistan's BSD CircularNo. 20 dated August 4, 2000, using rates quoted on Reuters, stock exchange quotesand brokers' quotations. Any difference between the carrying amount (representing costadjusted for amortisation of premium or discount, if any) and market value is taken tosurplus / (deficit) on revaluation of investments account and shown separately in thebalance sheet below shareholders' equity. At the time of disposal the respective surplusor deficit is transferred to income currently.
Investments in subsidiary companies are stated at cost less impairment for any diminutionin their value. In arriving at the provision in respect of any diminution in the value ofthese investments, consideration is given only if there is a permanent impairment inthe value of any investment.
Registered Special US Dollar Bonds are stated at cost translated at the exchange ratesprevailing at the balance sheet date. Any exchange difference on translation is takento income currently.
Unquoted investments are carried at cost in accordance with the requirements of theabove mentioned circular.
Impairment of investments is recognised when there is a permanent diminution in theirvalues. Provision for impairment in value, if any, is taken to income currently.
Investments are derecognised when the right to receive cash flows from the investmentshave expired, have been realised or transferred and the company has transferredsubstantially all risks and rewards of ownership.
Gain or loss on sale of investments is included in income currently.

4.2 Financial Instruments
All the financial assets and financial liabilities are recognised at the time when INTERBANKbecomes a party to the contractual provisions of the instrument. Any gain or loss onderecognition of the financial assets and financial liabilities is taken to income currently.(For "regular way" purchase and sale of financial assets refer note 4.3).
4.3 Trade and settlement date accounting
All “regular way” purchases and sales of financial assets are recognised on the settlementdate, i.e. the date on which the asset is delivered to or by INTERBANK. Regular waypurchases or sales of financial assets are those, the contract for which requires deliveryof assets within the time frame generally established by regulation or convention in themarket place.
4.4 Derivatives
Derivative instruments held by INTERBANK generally comprise of forward contractsin the capital and money markets. Derivatives are stated at fair value at the balancesheet date, if any. The fair value of a derivative is the equivalent of the unrealised gainor loss from marking to market the derivative using prevailing market rates. Derivativeswith positive market values (unrealised gains) are included in other assets and derivativeswith negative market values (unrealised losses) are included in other liabilities in thebalance sheet. The resultant gains and losses are included in the surplus / (deficit) onrevaluation of investments account in accordance with BSD Circular No. 20 datedAugust 4, 2000 issued by the State Bank of Pakistan until the derivatives are settled.
The fair value of unquoted derivatives is determined by discounted cash flows usingappropriate interest rates applicable to the underlying asset.
Hedging
For the purposes of hedge accounting, hedges existing at INTERBANK are classifiedas fair value hedges which hedge the exposure to changes in the fair value of arecognised asset or liability.
Where a fair value hedge meets the conditions for special hedge accounting, the hedgedinstrument is remeasured to fair value and the resultant gain or loss is immediatelyrecognised in the profit and loss account. Similarly, any gain or loss on the hedged itemattributable to the hedged risk is adjusted against the carrying amount of the hedgeditem and is taken to income currently.
4.5 Securities repurchase / resale agreements
Transactions of repurchase / resale of investment securities are entered into at contracted

rates for specified periods of time and are accounted for as follows :
a) Sale of securities under repurchase obligations
Securities sold with a simultaneous commitment to repurchase (repo) at a specifiedfuture date continue to be recognised in the balance sheet and are measured inaccordance with accounting policies for investments. Amounts received under theseagreements are included in borrowings from institutions. The difference between saleand repurchase price is amortised as expense over the life of the repo agreement.
b) Purchase of securities under resale obligations
Securities purchased with a corresponding commitment to resell (reverse repo) at aspecified future date are not recognised in the financial statements. Amounts paid underthese obligations are included in fund placements. The difference between purchaseand resale price is accrued as income over the life of the reverse repo agreement.
4.6 Revenue recognition
Mark-up / return on investments, finances, term finance certificates (TFCs), billsreceivable, demand promissory note, bankers' acceptances and fund placements arerecognised on a time proportion basis.
INTERBANk follows the finance method in accounting for recognition of leaseincome. Under this method, the unearned lease income, i.e., the excess of aggregatelease rentals and the residual value over the cost of leased asset is deferred andthen amortised to income over the term of the lease, applying the annuity methodto produce a constant rate of return on the net investment in lease finance. (Front-end fees, documentation charges and other lease related income are taken toincome currently).
Income on financial assets which have been classified is recognised on receipt basis.
Dividend from equity securities is recognised when the right to receive payment, at thetime of book closure of the company declaring the dividend, is established.
Commission and fees are taken to income when the service is provided.
4.7 Taxation
Current
Provision for current taxation is based on taxable income at the current rates of taxationafter taking into account tax credits and rebates available if any or at 0.5% of turnoverwhichever is higher.

Deferred
Deferred tax is recognised using the balance sheet liability method on all major temporarydifferences at the balance sheet date, between the tax base of the assets and liabilitiesand their carrying amounts for financial reporting purposes.
A deferred tax asset is recognised for all deductible temporary differences and unused taxlosses, if any, to the extent that it is probable that sufficient taxable income will be availableagainst which the deductible temporary differences and unused tax losses can be utilised.
The carrying amount of all deferred tax assets is reviewed at each balance sheet dateand reduced to the extent that it is no longer probable that sufficient taxable profits willbe available to allow all or part of the deferred tax assets to be utilised.
Deferred tax assets and liabilities are measured at the tax rates that are expected toapply to the period when the asset is realised or the liability is settled, based on taxrates (and tax laws) that have been enacted at the balance sheet date.
Deferred tax assets / liabilities on unrealised losses / gains on revaluation of investmentsare recorded as an adjustment to the same account, where the unrealised losses /gains are recognised.
4.8 Finances
Finances in the form of long term loans and advances and short term finances includedemand finance and installment finance and are stated at cost less any write-offs andprovision for doubtful finance, if any.
4.9 Net investment in lease finance
Leases where INTERBANK transfers substantially all the risks and rewards incidentalto ownership of the assets to the lessee are classified as finance leases. Net investmentin lease finance is stated at an amount equal to the aggregate of the minimum leasepayments receivable, including any guaranteed residual value and excluding anyunearned income, write-offs and provision for potential lease losses, if any.
4.10 Provision for doubtful finance / potential lease losses
The specific provision for doubtful finance / potential lease losses, if any, is made quarterlyin accordance with the Securities and Exchange Commission of Pakistan's PrudentialRegulations for Non-Banking Finance Companies (SECP's Regulations for NBFCs).
According to the instructions issued by the Securities and Exchange Commission of

Pakistan effective from January 09, 2006, NBFCs are required to maintain a generalreserve at an amount equivalent to 1.5% of the secured consumer portfolio and anamount equivalent of 5% of the unsecured consumer portfolio, to protect them from therisks associated with the economic cyclical nature of the business. Had this generalreserve not been created, the profit before taxation would have been higher by Rs.2,225 thousand. In addition to the general reserve specified by SECP, INTERBANKalso maintains a general provision to provide for potential lease losses on INTERBANK’sfinance / lease portfolio which have not been specifically indentified. This provision iscalculated based on management’s estimate.
4.11 Other provisions
Provisions are recognised when INTERBANK has a present legal or constructive obligationas a result of past events; it is probable that an outflow of resources will be required tosettle the obligation and a reliable estimate of the obligation can be made. Provisions arereviewed at each balance sheet date and adjusted to reflect the current best estimate.
4.12 Assets acquired in satisfaction of claims
INTERBANK occasionally acquires certain vehicles and assets in settlement of non-performing finances / leases provided to its customers. These are stated at lower ofthe original cost of the related asset, exposure to INTERBANK and net realisable value.Gains and losses on disposal are taken to income unless recoverable from / payableto the customer.
4.13 Fixed assets
Tangible
These are stated at cost less accumulated depreciation and accumulated impairmentlosses, (if any).
Depreciation is calculated using the straight line method in accordance with the ratesspecified in note 5.1 to the financial statements after taking into account residual value,if any. The residual values, useful lives and depreciation method are reviewed andadjusted, if appropriate, at each balance sheet date.
Depreciation on all fixed assets is charged from the month in which an asset is put touse while in case of assets disposed of depreciation is charged till the month of disposal.
Gains / losses on disposal of fixed assets, if any, are taken to income currently.
Maintenance and normal repairs are charged to income as and when incurred. Majorrenewals and improvements are capitalised and the assets so replaced, if any, are retired.
Intangible
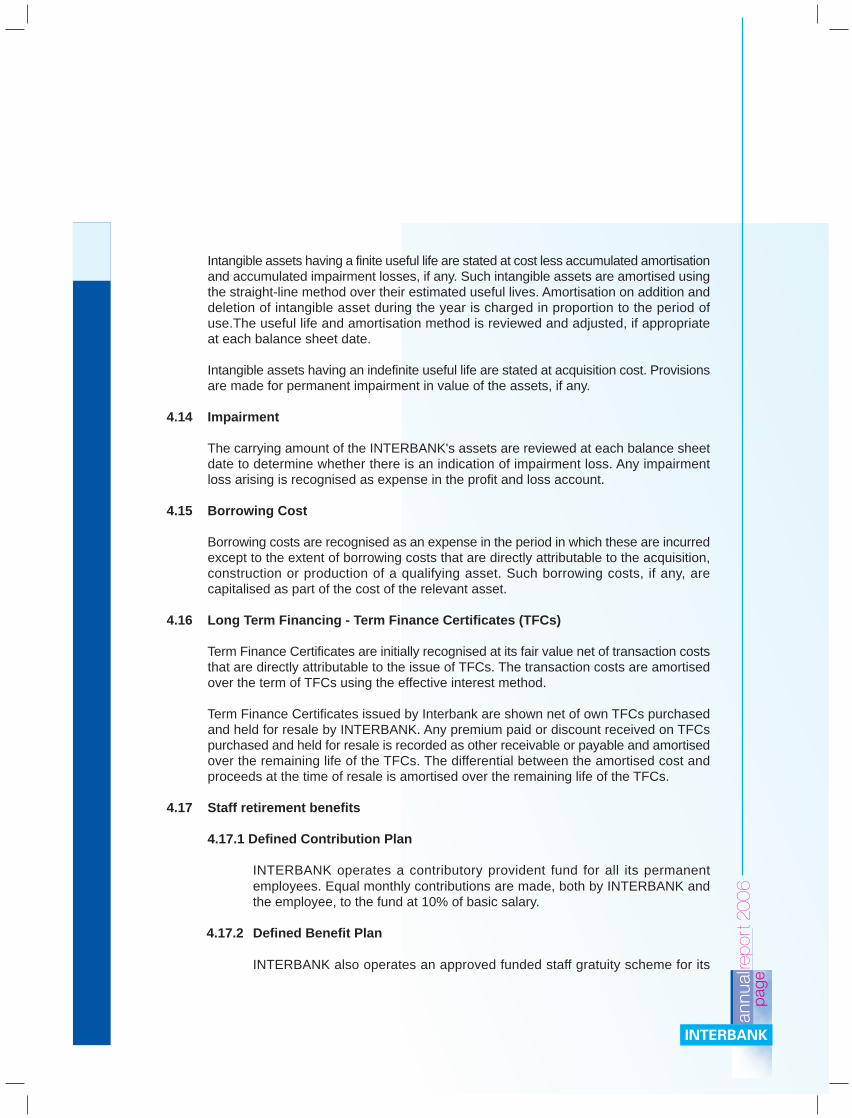
Intangible assets having a finite useful life are stated at cost less accumulated amortisationand accumulated impairment losses, if any. Such intangible assets are amortised usingthe straight-line method over their estimated useful lives. Amortisation on addition anddeletion of intangible asset during the year is charged in proportion to the period ofuse.The useful life and amortisation method is reviewed and adjusted, if appropriateat each balance sheet date.
Intangible assets having an indefinite useful life are stated at acquisition cost. Provisionsare made for permanent impairment in value of the assets, if any.
4.14 Impairment
The carrying amount of the INTERBANK's assets are reviewed at each balance sheetdate to determine whether there is an indication of impairment loss. Any impairmentloss arising is recognised as expense in the profit and loss account.
4.15 Borrowing Cost
Borrowing costs are recognised as an expense in the period in which these are incurredexcept to the extent of borrowing costs that are directly attributable to the acquisition,construction or production of a qualifying asset. Such borrowing costs, if any, arecapitalised as part of the cost of the relevant asset.
4.16 Long Term Financing - Term Finance Certificates (TFCs)
Term Finance Certificates are initially recognised at its fair value net of transaction coststhat are directly attributable to the issue of TFCs. The transaction costs are amortisedover the term of TFCs using the effective interest method.
Term Finance Certificates issued by Interbank are shown net of own TFCs purchasedand held for resale by INTERBANK. Any premium paid or discount received on TFCspurchased and held for resale is recorded as other receivable or payable and amortisedover the remaining life of the TFCs. The differential between the amortised cost andproceeds at the time of resale is amortised over the remaining life of the TFCs.
4.17 Staff retirement benefits
4.17.1 Defined Contribution Plan
INTERBANK operates a contributory provident fund for all its permanentemployees. Equal monthly contributions are made, both by INTERBANK andthe employee, to the fund at 10% of basic salary.
4.17.2 Defined Benefit Plan
INTERBANK also operates an approved funded staff gratuity scheme for its

permanent employees who have completed the qualifying period of service.Contributions and provisions in respect of the scheme are made in accordancewith actuarial recommendations.
Actuarial gains and losses are amortised over the average expected remaininglives of the employees participating in the plan.
4.18 Employees' compensated absences
INTERBANK provides for liability in respect of employees' compensated absences inthe year in which these are earned.
4.19 Functional and presentation currency
Items included in the financial statements are measured using the currency of theprimary economic environment in which the company operates. The financial statementsare presented in Pakistani Rupees, which is the company's functional and presentationcurrency.
4.20 Foreign currency transactions
Foreign currency transactions during the year are recorded at the exchange ratesapproximating those ruling on the date of the transactions. Assets and liabilities inforeign currencies are translated into Pakistan Rupees at the rates approximating thoseprevailing on the balance sheet date. Exchange differences are taken to income currently.
4.21 Offsetting of financial assets and financial liabilities
Financial assets and financial liabilities are offset and the net amount is reported in thefinancial statements only when INTERBANK has a legally enforceable right to set-offthe recognised amounts and intends either to settle on a net basis or to realise theasset and settle the liability simultaneously. Income and expenses arising from suchassets and liabilities are also accordingly offset.
4.22 Dividend distribution
Dividend distribution (including stock dividend) to INTERBANK's shareholders isaccounted for as a liability in the period in which the dividends are declared.
4.23 Segment Reporting
A Business segment is a group of assets and operations engaged in providing productsor services that are subject to risks and returns that are different from those of otherbusiness segments. As the operations of INTERBANK are carried out in Pakistan,information relating to geographical segment is not considered relevant.

INTERBANK accounts for segment reporting using the business segments as theprimary reporting format based on INTERBANK’S practice of reporting to the managementon the same basis.
Assets, liabilities, capital expenditures and other balances that are directly attributableto segments have been assigned to them while the carrying amount of certain assetsused jointly by two or more segments have been allocated to segments on a reasonablebasis. Those assets, liabilities and capital expenditure and other balances which cannotbe allocated to a particular segment on a reasonable basis are reported as unallocated.
4.24 Cash and cash equivalents
Cash and cash equivalents comprise of cash and bank balances, net of running finance.
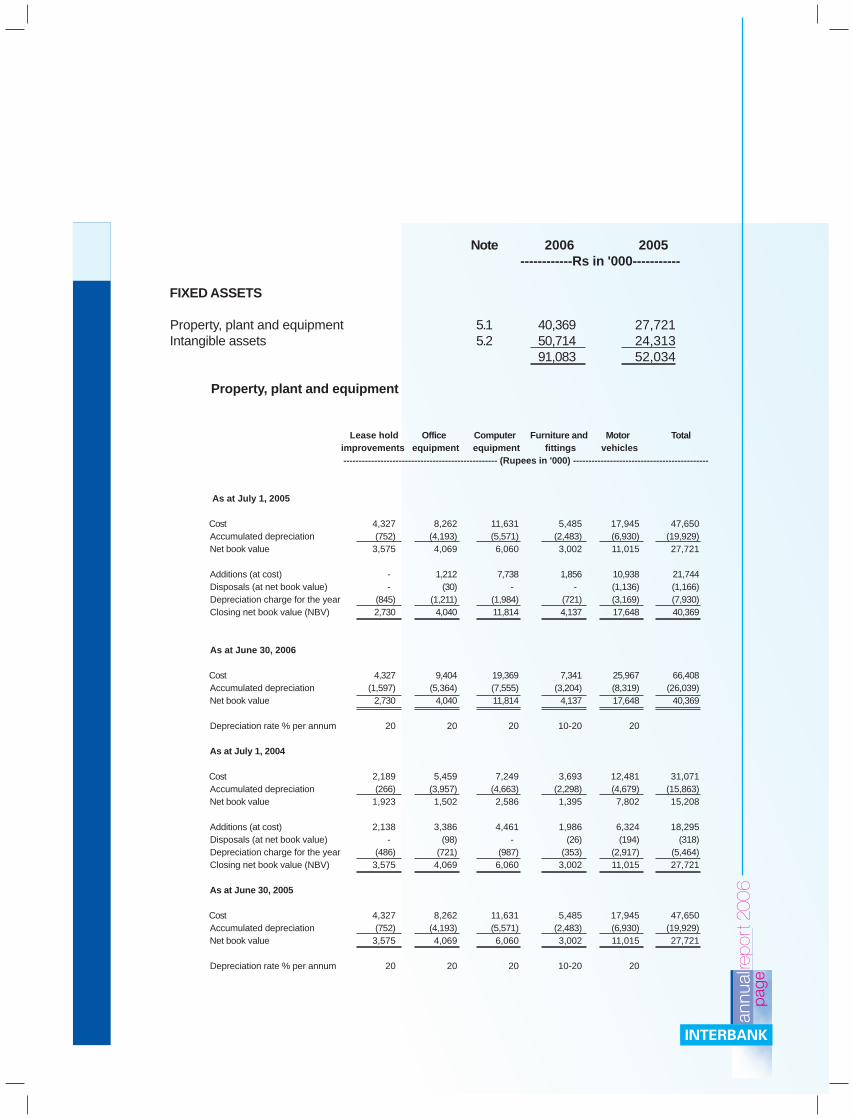
Note 2006 2005------------Rs in '000-----------
FIXED ASSETS
Property, plant and equipment 5.1 40,369 27,721Intangible assets 5.2 50,714 24,313
91,083 52,034
Property, plant and equipment
Lease hold Office Computer Furniture and Motor Totalimprovements equipment equipment fittings vehicles -------------------------------------------------- (Rupees in '000) --------------------------------------------
As at July 1, 2005
Cost 4,327 8,262 11,631 5,485 17,945 47,650Accumulated depreciation (752) (4,193) (5,571) (2,483) (6,930) (19,929)Net book value 3,575 4,069 6,060 3,002 11,015 27,721
Additions (at cost) - 1,212 7,738 1,856 10,938 21,744Disposals (at net book value) - (30) - - (1,136) (1,166)Depreciation charge for the year (845) (1,211) (1,984) (721) (3,169) (7,930)Closing net book value (NBV) 2,730 4,040 11,814 4,137 17,648 40,369
As at June 30, 2006
Cost 4,327 9,404 19,369 7,341 25,967 66,408Accumulated depreciation (1,597) (5,364) (7,555) (3,204) (8,319) (26,039)Net book value 2,730 4,040 11,814 4,137 17,648 40,369
Depreciation rate % per annum 20 20 20 10-20 20
As at July 1, 2004
Cost 2,189 5,459 7,249 3,693 12,481 31,071Accumulated depreciation (266) (3,957) (4,663) (2,298) (4,679) (15,863)Net book value 1,923 1,502 2,586 1,395 7,802 15,208
Additions (at cost) 2,138 3,386 4,461 1,986 6,324 18,295Disposals (at net book value) - (98) - (26) (194) (318)Depreciation charge for the year (486) (721) (987) (353) (2,917) (5,464)Closing net book value (NBV) 3,575 4,069 6,060 3,002 11,015 27,721
As at June 30, 2005
Cost 4,327 8,262 11,631 5,485 17,945 47,650Accumulated depreciation (752) (4,193) (5,571) (2,483) (6,930) (19,929)Net book value 3,575 4,069 6,060 3,002 11,015 27,721
Depreciation rate % per annum 20 20 20 10-20 20

International Accounting Standard (IAS) 16: "Property, Plant and Equipment (revised 2003)" is applicable to financial statements covering annual periods beginning on or after January 1, 2005. The revised IAS 16 requires a review of residual value of assets, useful lives and depreciation method at each financial year end. Accordingly, the management carried out a review of the residual values and useful lives of its fixed assets during the current year. Based on this review, the management has revised its estimate in respect of residual value of vehicles to 20 percent of cost. Previously, residual value of these assets was considered as nil. Had the accounting estimate not been revised the depreciation charge for the year would have been higher by Rs.964 thousand and the profit before tax for the year would have been lower by the same amount.
Cost and accumulated depreciation at the end of the year include Rs.12,146 thousand (2005: Rs. 8,375 thousand) and Rs. 11,753 thousand (2005: Rs. 8,375 thousand) respectively in respect of fully depreciated assets still in use.
Intangible assets Membership Non-
Description card and room competition Computer Totalof LSE (note agreement software
5.2.1) (note 5.2.2)------------------------------------------------- (Rupees in '000) ----------------------------------------------
As at July 1, 2005Cost 21,000 - 4,744 25,744Accumulated amortisation - - (1,431) (1,431)Net book value 21,000 - 3,313 24,313
Additions (at cost) - 30,000 1,588 31,588Amortisation charge for the year - (4,167) (1,020) (5,187)Closing net book value 21,000 25,833 3,881 50,714
As at June 30, 2006Cost 21,000 30,000 6,332 57,332Accumulated amortisation - (4,167) (2,451) (6,618)Net book value 21,000 25,833 3,881 50,714
Amortisation rate % per annum - 33.33 20
Membership Non-card and room competition Computer Total
of LSE agreement software------------------------------------------------- (Rupees in '000) ----------------------------------------------
As at July 1, 2004Cost - - 1,925 1,925Accumulated amortisation - - (982) (982)Net book value - - 943 943
Additions (at cost) 21,000 - 2,819 23,819Amortisation charge for the year - - (449) (449)Closing net book value 21,000 - 3,313 24,313
As at June 30, 2005Cost 21,000 - 4,744 25,744Accumulated amortisation - - (1,431) (1,431)Net book value 21,000 - 3,313 24,313
Amortisation rate % per annum - - 20

5.2.1 This represents consideration paid by INTERBANK to acquire the membershiprights and room in the Lahore Stock Exchange from a related party. Theacquisition was made after obtaining the approval of SECP in this regard.
5.2.2 This represents consideration in respect of a three year agreement with Mr.Ali Azam Shirazee (Ex-Director and Chief Executive Officer of Finex Securities)for not competing with INTERBANK in the financial brokerage business inPakistan. As mentioned in note 1 INTERBANK acquired 100% shareholdingof Finex Securities during the year.
5.2.3 Cost and accumulated amortisation as at the end of the year include Rs.784 thousand(2005: Rs.778 thousand) in respect of fully depreciated assets still in use.
5.3 Particulars of disposal of fixed assets
Particulars Original cost Accumulated Book Sale Gain / Mode of Particular of Purchaserdepreciation value proceeds/ (loss) on disposal
Insurance disposalclaim
------------------------------------------------------------ Rs in '000 ------------------------------------------------------------
Office equipment 70 40 30 - (30) Write off -
Vehicles 2,366 1,340 1,026 2,050 1,024 Tender Sardar Ahmed
550 440 110 412 302 Negotiation Wasim Irshad - Ex-employee
2,916 1,780 1,136 2,462 1,326
June 30, 2006 2,986 1,820 1,166 2,462 1,296
June 30, 2005 1,716 1,398 318 904 586
6 LONG-TERM INVESTMENTS
Particulars of investments - by type and segment
Note 2006 2005
------------Rs in '000-----------
Investment in subsidiaries (wholly owned) at cost Finex securities 6.1 152,571 -IGI Funds Limited 6.2 30,000 -
182,571 -
6.1 This represents investments (along with the related transaction cost amounting to Rs2,571 thousand) made during the year in Finex Securities (a corporate member ofthe Karachi Stock Exchange (Guarantee) Limited).
6.2 This represents investments made during the year by INTERBANK in IGI FundsLimited, an Asset Management Company.
6.3 Other details of subsidiary companies are as follows:
Name Country of Incorporation Year of Incorporation Finex Securities Limited Pakistan 1994 IGI Funds Limited Pakistan 2006

Note 2006 2005
------------Rs in '000-----------LONG-TERM LOANS AND ADVANCES - secured
Loans and advances to staff - considered good 7.1 2,556 5,103
Other loans and advances- Companies / organisations and individuals - considered good 543,998 404,446 - considered doubtful 8,978 4,763
7.2 552,976 409,209Less: Provision for doubtful loans and advances 7.3 8,978 4,763
546,554 409,549Less: Current maturity of long-term loans and advances 10 176,729 153,050
369,825 256,499Loans and advances to staff - considered good
Executives 7.1.1 & 7.1.2 1,760 3,758Other employees 7.1.1 796 1,345
2,556 5,103
Reconciliation of carrying amount of loans and advances to executives and other employees is as follows:
2006 2005 2006 2005 Executives Other employees
----------------------- Rs in '000 --------------------------
Opening balance 3,758 6,680 1,345 2,013Disbursements during the year - - - 900Repayments during the year (1,998) (2,922) (549) (1,568)
1,760 3,758 796 1,345
These represents loans and advances provided to executives for purchase of houses and for other purposes. These loans carry mark-up at 2.5% (2005: 2.5% to 5%) per annum and are extended for a period of 16 years. Repayment is made on a monthly basis. The maximum aggregate amount due at the end of any month during the year from executives was Rs.3,703 thousand (2005: Rs. 6,638 thousand). The loans are secured against mortgage of house properties and hypothecation of vehicles.

These loans carry mark-up at rates ranging from 7.25% to 25% (2005: 6.25% to 25%) per annum and are repayable over a period ranging from over 1 year to 7 years from the date of financing. Repayment terms vary from monthly basis to repayments at maturity.
Provision for doubtful loans and advances
2006 2005Specific General Total Specific General Total
--------------------------------- Rs in '000 ----------------------------------
Opening balance 1,713 3,050 4,763 4,923 2,013 6,936Charge for the year 1,453 3,139 4,592 790 1,037 1,827Reversal on recovery during the year (377) - (377) (4,000) - (4,000)Closing balance 2,789 6,189 8,978 1,713 3,050 4,763
The classified portfolio of INTERBANK as at June 30, 2006 aggregated to Rs. 9,688 thousand (2005: Rs. 6,852 thousand). INTERBANK has not recognised income on this balance.
Note 2006 2005
------------Rs in '000-----------
NET INVESTMENT IN LEASE FINANCE
Net investment in lease finance 8.1 1,929,202 1,670,899Less: Current maturity 10 695,624 514,395
1,233,578 1,156,504

Particulars of net investment in lease finance
2006 2005Later than Later than
Not later one year Later than Total Not later one year Later than Totalthan one but not five years than one but not five years
year later than year later thanfive years five years
----------------------------------------------------- Rs in '000 --------------------------------------------------
Lease rental receivable 819,572 1,036,950 185 1,856,707 619,540 980,323 1,285 1,601,148
Add: Residual value of leased assets 53,439 369,569 1,567 424,575 33,766 305,747 2,056 341,569
Gross investment in lease finance 873,01 1,406,519 1,752 2,281,282 653,306 1,286,070 3,341 1,942,717
Less: Unearned finance income 151,062 174,667 26 325,755 116,077 132,742 165 248,984
Net investment in lease finance - note 8.2, 8.3 & 8.4 721,949 1,231,852 1,726 1,955,527 537,229 1,153,328 3,176 1,693,733
Less: Provision for potential lease losses - note 8.5 26,325 - - 26,325 22,834 - - 22,834
Net investment in lease finance - net of provision - note 10 695,624 1,231,852 1,726 1,929,202 514,395 1,153,328 3,176 1,670,899
Net investment in lease finance includes Rs. 453 thousand (2005: Rs.Nil thousand) due from a related party. Maximum amount due from related parties at the end of any month during the year was Rs 598 thousand. (2005: Rs. 999 thousand).
The leases made by INTERBANK are for a term of 3 to 7 (2005: 3 to 7) years. Security deposits obtained at the time of disbursement of lease generally range from 0% to 79% (2005: 0% to 79%) of the lease amount. In addition, the lessees are also required to insure the leased assets in favour of INTERBANK and to maintain certain financial ratios. The rate of return implicit in the leases ranges from 1.94% to 20.35% (2005: 1.74% to 20.35%) per annum. Penalty is charged in case of delayed payments.

Minimum lease payments and net investment in lease finance include Rs. 824,687 thousand and Rs. 782,081 thousand (2005: Rs.361,390 thousand and Rs. 342,632 thousand) respectively in respect of floating rate leases. These leases have been entered into at State Bank of Pakistan's (SBP's) discount rate and KIBOR plus margins, ranging from 0.5% to 5% (2005: 0.5% to 5%) per annum, with floor ranging from 6.5% to 10% (2005: 6% to 15%) per annum and ceilings ranging from 7.5% to 12% (2005: 7.5% to 16.5%) per anum. Mark-up rates are revised periodically (every three to six months) in line with the changes to the SBP's discount and KIBOR rates.
8.5 Provisions for lease losses
2006 2005Specific General Total Specific General Total
--------------------------------- Rs in '000 ----------------------------------
Opening balance 5,897 16,937 22,834 1,902 11,622 13,524Charge for the year 1,631 2,550 4,181 4,735 5,315 10,050Reversal on recovery during the year (690) - (690) (740) - (740)Closing balance 6,838 19,487 26,325 5,897 16,937 22,834
The principal amount classified as per SECP's Regulations for NBFCsaggregates to Rs. 46,099 thousand (2005: Rs. 22,139 thousand) on whichincome has been suspended.
Note 2006 2005------------Rs in '000-----------
LONG-TERM DEPOSITS AND PREPAYMENTS
Security deposits 9.1 3,707 2,767Prepayments - 869
3,707 3,636
This includes deposit amounting to Rs. 900 thousand (2005: Rs. 400 thousand) placed with Lahore Stock Exchange in respect of exposure arising out of trading in securities.
CURRENT MATURITY OF NON-CURRENT ASSETS
Note 2006 2005
------------Rs in '000-----------Long-term loans and advances 7 176,729 153,050Net investment in lease finance 8 695,624 514,395
872,353 667,445
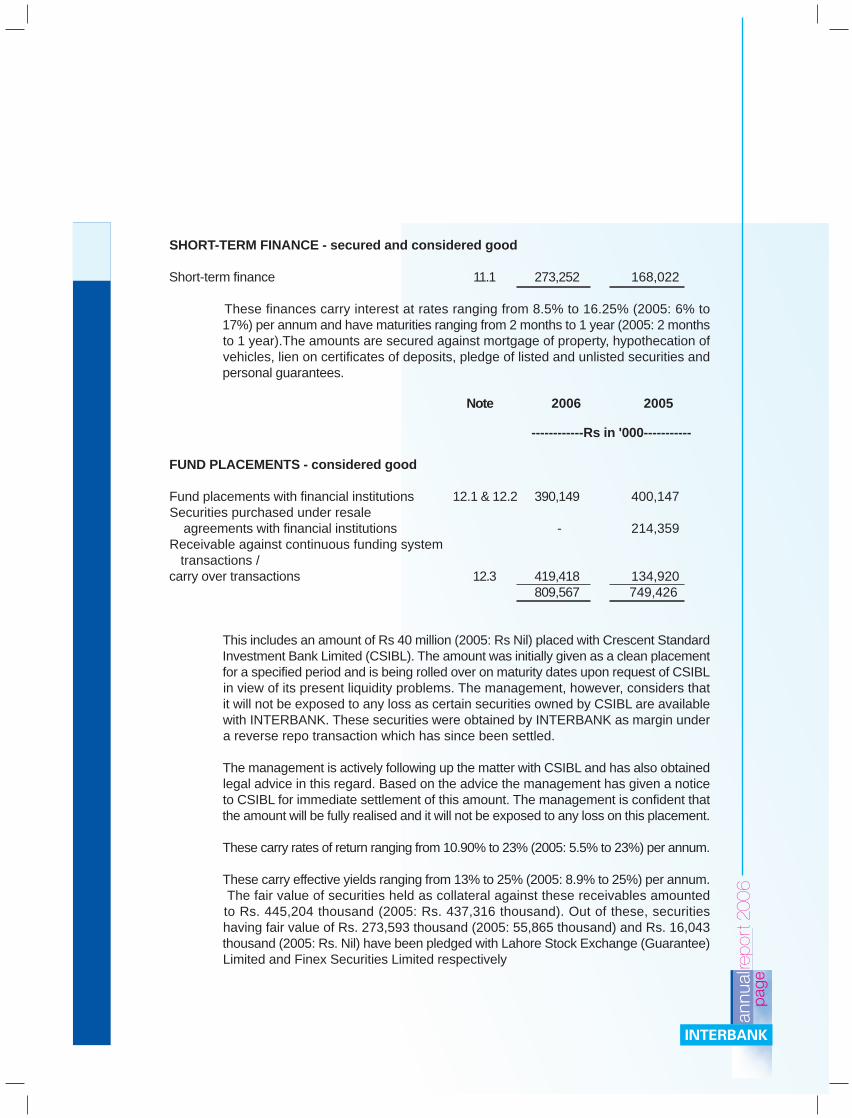
SHORT-TERM FINANCE - secured and considered good
Short-term finance 11.1 273,252 168,022
These finances carry interest at rates ranging from 8.5% to 16.25% (2005: 6% to 17%) per annum and have maturities ranging from 2 months to 1 year (2005: 2 months to 1 year).The amounts are secured against mortgage of property, hypothecation of vehicles, lien on certificates of deposits, pledge of listed and unlisted securities and personal guarantees.
Note 2006 2005
------------Rs in '000-----------
FUND PLACEMENTS - considered good
Fund placements with financial institutions 12.1 & 12.2 390,149 400,147Securities purchased under resale agreements with financial institutions - 214,359Receivable against continuous funding system transactions /carry over transactions 12.3 419,418 134,920
809,567 749,426
This includes an amount of Rs 40 million (2005: Rs Nil) placed with Crescent Standard Investment Bank Limited (CSIBL). The amount was initially given as a clean placement for a specified period and is being rolled over on maturity dates upon request of CSIBL in view of its present liquidity problems. The management, however, considers that it will not be exposed to any loss as certain securities owned by CSIBL are available with INTERBANK. These securities were obtained by INTERBANK as margin under a reverse repo transaction which has since been settled.
The management is actively following up the matter with CSIBL and has also obtained legal advice in this regard. Based on the advice the management has given a notice to CSIBL for immediate settlement of this amount. The management is confident that the amount will be fully realised and it will not be exposed to any loss on this placement.
These carry rates of return ranging from 10.90% to 23% (2005: 5.5% to 23%) per annum.
These carry effective yields ranging from 13% to 25% (2005: 8.9% to 25%) per annum. The fair value of securities held as collateral against these receivables amounted to Rs. 445,204 thousand (2005: Rs. 437,316 thousand). Out of these, securities having fair value of Rs. 273,593 thousand (2005: 55,865 thousand) and Rs. 16,043 thousand (2005: Rs. Nil) have been pledged with Lahore Stock Exchange (Guarantee) Limited and Finex Securities Limited respectively

SHORT-TERM INVESTMENTS
13.1 Particulars of investments by type
2006 2005
Held by Given as Total Held by Given as TotalINTERBANK collateral INTERBANK collateral
--------------------------------------------------------- Rs in '000 -------------------------------------------------------
Held for trading
Federal Investment Bonds 2,378 - 2,378 2,432 - 2,432Pakistan Investment Bonds 1,482 - 1,482 1,551 51,073 52,624Listed shares / certificates and - modaraba certificates - - - 191,150 - 191,150Market Treasury Bills - 97,372 97,372 - - -
3,860 97,372 101,232 195,133 51,073 246,206
Available-for-sale
Pakistan Investment Bonds - - - - 214,539 214,539Registered Special US Dollar Bonds - - - 71,697 - 71,697Listed term finance certificates (TFCs) 235,900 - 235,900 163,155 - 163,155Unlisted term finance certificates (TFCs) 14,445 - 14,445 7,778 - 7,778Mutual fund units (open ended) 95,859 - 95,859 28,127 - 28,127Listed shares / certificates and modaraba certificates 191,402 59,537 250,939 172,198 - 172,198Unlisted shares / certificates and modaraba certificates 62,782 - 62,782 52,782 - 52,782
600,388 59,537 659,925 495,737 214,539 710,276
604,248 156,909 761,157 690,870 265,612 956,482
Note 2006 2005------------Rs in '000-----------
Particulars of investments by segment
Investments in: Government securities 13.2.1 101,232 341,292 Listed TFCs 13.2.2 235,900 163,155 Unlisted TFCs 13.2.2 14,445 7,778 Mutual fund units (open ended) 13.2.3 95,859 28,127 Listed shares / certificates and modaraba certificates 13.2.4 250,939 363,348
Unlisted shares / certificates and modaraba certificates 13.2.4 62,782 52,782
761,157 956,482

These include:
Federal Investment Bonds (FIBs) having amortised cost of Rs.2,538 thousand (2005: Rs.2,747 thousand) and face value of Rs. 2,200 thousand (2005: Rs. 2,200 thousand) with income receivable semi-annually at 15% (2005: 15%) per annum and remaining terms of 1 to 2 years.
Pakistan Investment Bonds (PIBs) having amortised cost of Rs.1,759 thousand (2005: Rs. 304,228 thousand) and face value of Rs.1,400 thousand (2005: Rs.251,400 thousand) with income receivable semi-annually at 11% (2005: 8% to 12%) per annum and remaining term of 6 years.
Market Treasury Bills (T-Bills) having amortised cost of Rs. 97,390 thousand (2005: Rs. Nil) and face value of Rs. 100,000 thousand (2005: Rs. Nil) and remaining term of 4 months.
Particulars of TFCs: *
No. of certificates N a m e 2006 20052006 2005 --------------------------- Rs in '000 -------------------------------
Amortised Market Amortised MarketLISTED TFCs cost value cost valueInvestment banks and companies
- 2,940 Atlas Investment Bank Limited - - 2,448 2,5461,000 1,000 First Dawood Investment Bank Limited 5,059 5,075 5,601 5,062
Commercial banks
2,000 2,000 Union Bank Limited I 10,456 10,086 10,351 10,1154,587 4,587 Union Bank Limited II 22,917 21,771 22,575 20,7482,000 - Union Bank Limited III 10,000 10,000 - -6,352 6,352 United Bank Limited II 31,759 30,171 31,760 31,760
10,000 - Bank Alfalah 49,990 50,240 - -
Leasing
190 190 Al-Zamin Leasing Modaraba 950 912 950 950
Refinery
1,448 1,448 Chanda Oil & Gas Securitization Co. Limited 6,603 6,570 7,240 7,240Naimat Basal Oil & Gas Securitization
5,913 5,913 Company Limited 24,430 24,674 29,417 29,269
Miscellaneous
5,903 - Searle Pakistan Limited 29,515 29,588 - -897 897 Pakistan Services Limited 3,202 3,242 4,483 4,573
8,715 8,715 TeleCard Limited 43,557 39,202 43,575 43,5752,000 2,000 WorldCALL Telecom Limited 4,393 4,369 7,790 7,317
242,831 235,900 166,190 163,155UNLISTED TFCs
2,000 2,000 Development Securitisation Trust 4,445 4,445 7,778 7,7782,000 - Security Leasing Corporation 10,000 10,000 - -
257,276 250,345 173,968 170,933

Certificates Profit rate Profit Redemption
Particulars denomination per annum payment terms
Union Bank Limited (I)
Union Bank Limited (II)
Union Bank Limited (III)
United Bank Limited (II)
F i r s t D a w o o dI n v e s t m e n t B a n kLimited
A l -Zamin Leas ingModaraba
Chanda Oil & GasSecuritization CompanyLimited
Naimat Basal Oil & GasSecuritization CompanyLimited
Pak is tan Serv icesLimited
TeleCard Limited
WorldCALL TelecomLimited
Searle Pakistan
Bank- Alfalah
5,000
5,000
5,000
5,000
5,000
100,000
5,000
5,000
5,000
5,000
5,000
5,000
5,000
Cut off yield of latest auctionof 5-years PIB + 2.23% p.a.(floor 11.00%, cap 15.50%)
Floor 5%, cap 10.75%, cut offyield of 5-years PIB + 0.75%.
Six months KIBOR + 2%
1.35% p.a. + Trading yield 8year PIBs.
1.75% over SBP's discountrate with a floor of 12.25%and a ceiling of 16.25%.
Floor of 9.5% p.a. or profitexpected to be around 1.5%p.a.
Last 7 days average ask sideof 3 months KIBOR + 3.25 bpsfloor 8.95% cap 13%
Ask side of six-month KIBOR+ 2.5%, floor 7.5%, cap 13%
2.5% over SBP's discount rateper annum with a floor of9.75% and a cap of 13.75%.
Six-month KIBOR + 3.75%p.a.
1.75% over SBP's discountrate with a floor of 12.25%and a ceiling of 16.25%.
Average ask rate of six monthsKIBOR + 2.5%.
Average ask rate of six monthsKIBOR + 1.5%.
Semi-annually
Semi-annually
Semi-annually
Semi-annually
Semi-annually
Profit on half-yearlybasis, final profit
settled on the basisof annual audited
accounts.
Quarterly
Monthly
Semi-annually
Semi-annually
Semi-annually
Semi-annually
Semi-annually
Commencing from the 54th month of the issuedate.
Commencing from the 54th month of the issuedate.
Redemption of Rs. 1 in the first 8 semi-annualinstallments. Rest of the principal will beredeemed in six semi-annual installments.
Bullet redemption at the end of 8th year.
Perpetual with an embedded call and put optionexercisable with one months' prior notice forthe put option and two months' prior notice forthe call option from September 16, 2006 andevery five years thereafter.
3 installments at the end of 3rd, 4th & 5th year.
27 quarterly installments commencingimmediately after grace period of 6 months.
60 monthly installments. During 1st six monthsonly 3% of principal redeemed, 97% redeemedin 54 equal monthly installments after 6 months.
Principal redemption will take place in sevenequal semi annual installments and willcommence from the 24th month of the date ofpublic subscription after a grace period of 18months.
Ten equal semi-annual installments commencing18 months from issue date.
Redemption of Rs 1 in the first 3 semi annualinstallments. Rest of the principal will beredeemed in 7 equal semi annual installments.
Redemption of Rs 1 in the first two semi-annualinstallments. Rest of the principal will beredeemed in 8 equal semi-annual installments.
Redemption of Rs 0.96 in the first 13 semiannual installments. Rest of the principal willbe redeemed in 3 equal semi annualinstallments.

13.2.3 Particulars of mutual fund units (open ended)
No. of units Name 2006 20052006 2005 -------------------- Rs in '000 -----------------
Cost Market Cost Marketvalue value
9,002 10,000 Atlas Income Fund (Face value Rs. 500 each) 5,000 4,903 5,000 5,45920,000 20,000 Atlas Stock Market Funds (Face value Rs. 500 each) 10,000 13,096 10,000 11,26889,849 - Dawood Money Market Fund (Face value Rs. 100 each) 10,000 9,985 - -
1,962,709 - NAFA Cash Fund (Face value Rs. 10 each) 20,000 19,370 - -98,678 - KASB Liquid Fund (Face value Rs. 100 each) 10,000 10,006 - -
190,458 - Askari Income Fund ( Face value Rs. 100 each) 20,000 19,983 - -- 100,000 Faisal Balanced Growth Fund (Face value Rs. 100 each) - - 10,000 11,400- - Unit Trust of Pakistan (Face value Rs. 5,000 each) - - - -
423,714 - AKD Opportunity Fund ( Face value Rs. 50 each) 20,000 18,516 - -95,000 95,859 25,000 28,127
13.2.4 Particulars of shares / certificates and modaraba certificates
No. of ordinary shares / certificates of Rs. 10/- each LISTED SHARES / CERTIFICATES AND 2006 2005
2006 2005 MODARABA CERTIFICATES ------------------- Rs in '000 -------------------Cost Market Cost Market
value value
Mutual fund (closed ended)
- 1,052,000 ABAMCO Composite Fund - - 10,491 7,259- 112,500 BSJS Balance Fund - - 1,321 928
500,000 200,000 PICIC Investment Fund XD 9,311 7,300 3,260 3,000950,000 1,000,000 Atlas Fund of Funds 9,048 9,262 10,000 9,900
1,000,000 1,000,000 Meezan Balance Fund 10,000 10,050 10,000 8,200- 191,250 PICIC Growth Fund (Face value Rs. 40.174 each) - - 7,683 10,270
3,665,704 3,030,400 First Dawood Mutual Fund 35,446 34,091 30,304 30,3041,089,850 - AKD Index Tracker Fund 10,899 10,245 - -
500,226 - UTP Growth Fund 9,116 6,503 - -
Modarabas
- 11,500 B.R.R. International Modaraba - - 207 91
Leasing
78,200 68,000 ORIX Leasing Pakistan Limited 2,715 2,006 2,715 2,020
Investment Banks / Companies / Securities
29,000 - International Housing Finance 218 180 - -32,500 - P.I.C.I.C 1,681 1,705 - -

No. of ordinary shares / certificates of Rs. 10/- each LISTED SHARES / CERTIFICATES AND 2006 2005
2006 2005 MODARABA CERTIFICATES ------------------- Rs in '000 ------------------Cost Market Cost Market
value value
Commercial banks
6,000 - PICIC Commercial Bank 189 192 - -229,000 - Bank Of Punjab 19,027 19,087 - -
3,000 20,000 Askari Commercial Bank Limited 241 242 1,165 1,5601,000 175,000 Faysal Bank Limited 63 63 8,626 9,415
- 414 KASB Bank Limited - - 4 563,000 - Muslim Commercial Bank Limited 11,979 12,044 - -
355,500 50,000 National Bank of Pakistan 64,612 64,971 5,250 5,397
Textile spinning
1,200,326 1,737,826 Dewan Farooque Spinning Mills Limited 12,003 8,042 17,378 15,293- 1,000 Saitex Spinning Mills Limited - - 5 2
500,302 500,000 Zephyr Textile Mills Limited 5,003 3,502 5,000 5,000
Textile composite
- 2,200 Nishat Mills Limited - - 109 167201,410 183,100 Kohinoor Textile Mills Limited 10,887 6,395 10,887 6,958
Cement
54,500 40,000 DG Khan Cement Company Limited 4,112 4,134 2,235 2,230- 400,000 Maple Leaf Cement Factory Limited - - 12,373 8,720
Refinery
41,980 80,000 Attock Refinery Limited 6,106 3,640 9,010 12,764
Power generation and distribution
128,000 100,000 HUB Power Company Limited 4,867 2,955 4,217 2,640
Oil and gas marketing
8,000 100,000 Pakistan State Oil 2,406 2,411 38,413 38,600- 1,100 Shell Pakistan Limited - - 466 609
Oil and gas exploration
29 31,229 Oil and Gas Development Company Limited 3 4 2,426 3,28825,000 - Pakistan Oilfield Limited 8,607 8,391 - -
8,500 305,000 Pakistan Petroleum Limited 1,694 1,697 66,691 65,605361,500 275,000 Sui Southern Gas Co. 11,592 11,676 7,467 6,366

No. of ordinary shares / certificates of Rs. 10/- each LISTED SHARES / CERTIFICATES AND 2006 2005
2006 2005 MODARABA CERTIFICATES ------------------- Rs in '000 -----------------Cost Market Cost Market
value value
Automobile assemblers
- 20,000 Indus Motor Company Limited - - 1,988 1,800
Technology and communication
12,500 1,230,000 Pakistan Telecommunication Corporation Limited (A) 531 534 80,728 81,118
978,233 - Eye Television Network Limited 9,782 6,848 - -647,500 - Telecard 8,083 8,139 - -
316 - World call telecom 3 3 - -
Paper & Board
12,700 124,400 Packages Limited (a related party) 2,113 2,659 18,339 17,416
Fertilizer
10,500 - Engro Chemical Pakistan Limited 1,955 1,968 - -- 51,528 Fauji Fertilizer Company Limited - - 4,726 6,253
Vanaspati and allied
- 9,500 Wazir Ali Industries Limited (an associated undertaking) - - 239 170
274,292 250,939 373,723 363,348
UNLISTED SHARES
Miscellaneous
4,000,000 4,000,000 DHA Cogen Limited 40,000 40,000 40,000 40,000216,216 - System Ltd 10,000 10,000 - -
1,123,318 1,123,318 Techlogix Limited 12,782 12,782 12,782 12,78262,782 62,782 52,782 52,782
337,074 313,721 426,505 416,130

Note 2006 2005 --------------Rs in '000---------------
14 ADVANCES, DEPOSITS AND PREPAYMENTS
Advance against leases - considered good 14.1 18,545 37,422Short term deposits 14.2 115,000 19,414Prepayments 14.3 18,159 13,110
151,704 69,946
14.1 These represent advances paid to suppliers against assets to be leased out and carrymark-up at rates ranging from 12.5% to 15% (2005: 12.14% to 12.25%).
14.2 These represent deposits placed with Finex Securities Limited (subsidiary company) for trading in future and Continuous Funding System transactions at the Karachi Stock Exchange.
14.3 Prepayments include Rs. 8,495 thousand (2005: Rs. 5,686 thousand) in respect of advance rent of leased premises and Rs, 5,534 thousand (2005: Rs. 875 thousand)in respect of advance against suppliers.
Note 2006 2005 -------------Rs in '000--------------
15 INTEREST / MARK-UP / PROFIT ACCRUED
Investments - Government securities 160 6,013 - Registered Special US Dollar Bonds - 1,860 - Term finance certificates 5,935 3,221
6,095 11,094Finances 20,727 8,231Fund placements 1,443 1,208Deposits with banks 61 8
28,326 20,541
Note 2006 2005 ---------Rs in '000----------
16 TRADE DEBTS
Secured Considered good 72,865 41,250
16.1 Amount receivable from related parties at year end are as under:
Key management personnel - 4,574Associated undertakings 21,022 3,292
21,022 7,866

Note 2006 2005 ---------Rs in '000----------
17 OTHER RECEIVABLESOther receivables - considered good 17.1 & 17.2 24,190 9,268Positive fair value of derivative financial instruments 792 -
24,982 9,268
17.1 This includes an amount of Rs. 4,471 thousand (2005: Rs. 4,471 thousand) relatingto excise duty paid on behalf of customers against finances disbursed. The amountis secured against collaterals obtained from the customers.
Note 2006 2005 ---------Rs in '000----------
17.2 Amount due from related parties as at June 30, 2006 is as follows:
Packages Limited 963 963IGI Funds Limited 1,377 125International General Insurance Company of Pakistan Limited 1,067 -
3,407 1,088
18 CASH AND BANK BALANCES
In hand 91 5With banks - on current accounts with
- State Bank of Pakistan 649 460- Others local currency 104,188 4,610 foreign currencies 342 3,658
18.1 104,530 8,268With banks - on PLS saving accounts
local currency 91,708 33,192196,978 41,925
18.1 This includes book overdraft balance with an associated undertaking of Rs. 517thousand (2005: book overdraft of Rs. 196 thousand).

19 ISSUED, SUBSCRIBED AND PAID-UP CAPITAL
2006 2005 2006 2005-----No of shares------ -------Rs in '000-------
25,000,000 25,000,000 Ordinary shares of Rs. 10 each fully paid in cash 250,000 250,000
16,917,500 11,450,000 Ordinary shares of Rs. 10 each issued as 169,175 114,500 fully paid bonus shares at the beginning of the year
- 5,467,500 Add: Bonus shares issued during the year - 54,675Ordinary shares of Rs. 10 each issued as
16,917,500 16,917,500 fully paid bonus shares at the end of the year 169,175 169,175 41,917,500 41,917,500 419,175 419,175
Shares of INTERBANK held by associated undertakings amount to Rs. 146,670 thousand (14,667thousand shares of Rs. 10 each) [2005: 146,770 thousand (14,677 thousand shares of Rs. 10 each)].
Note 2006 2005 ---------Rs in '000----------
20 RESERVES
Capital reserves Special reserve 20.1 97,098 89,636
Revenue reserves General reserve 97,325 97,325 Unappropriated profit 30,969 59,806
128,294 157,131225,392 246,767
20.1 This represents statutory reserve created at 20% of the profit from ordinary activities after taxation in compliance with Regulation No. 2 of Part III of SECP's Regulations for NBFCs.
Note 2006 2005 ---------Rs in '000---------
21 (DEFICIT) / SURPLUS ON REVALUATION OF INVESTMENTS - NET
(Deficit) / surplus on revaluation of:- government securities - net (455) (37,380)- term finance certificates - net (6,931) (3,035)- mutual funds units (open ended) - net 859 3,127- quoted shares and certificates - net (23,353) (10,376)- forward sale of quoted shares and certificates - net 792 (1,121)
21.1 (29,088) (48,785)Deferred tax asset on revaluation of investments 42.3 159 16,510
(28,929) (32,275)

Note 2006 2005 ---------Rs in '000---------
21.1 Particulars of (deficit) / surplus on revaluation on investments - net
Opening balance (48,785) (34,567)Surplus / (Deficit) arising on revaluation of investments - current year 58,265 8,184Transferred to the profit and loss account on realisation (38,568) (22,402)Closing balance (29,088) (48,785)
22 PRE-IPO SUBSCRIPTION TOWARDS PROPOSED ISSUE OF TERM FINANCE CERTIFICATES
Liability in respect of term finance certificate to be issued by INTERBANK 22.1 375,000 -Less: Transaction cost 22.2 (5,050) -
369,950 -
22.1 This represents the pre IPO (private placement) amount received by Interbank in respect ofthe proposed issue of Term Finance Certificates (TFCs). The total issue amounts to Rs 500million out of which Rs 375 million has been received from institutional investors under pre-IPO. The remaining amount of Rs 125 million has been raised through the Initial Public Offer(IPO) subsequent to the year end. The TFCs are secured against all the present and futuremovable fixed assets (excluding land and builiding) and current assets of INTERBANK. Therate of mark-up on these TFCs is six months average KIBOR + 225 Basis Points (2.25%) withno floor and cap and is payable semi-annually with a grace period of one year. These TFCsare redeemable within 5 years of issue.
22.2 Transaction cost incurred on issue of Term Finance Certificates has been adjusted from therelated liability and is amortised over the term of TFCs using the effective interest method.
Note 2006 2005 ---------Rs in '000----------
23 LONG-TERM BORROWINGS - secured
Local currency - banking companies 23.1 1,308,333 1,033,3331,308,333 1,033,333
Less: Current portion of long-term borrowings 26 615,000 325,000693,333 708,333
23.1 This includes:
- Financing facility of Rs. 300,000 thousand obtained from a banking company in threetranches of Rs. 100,000 thousand each. The finance is repayable in four equal semi-annual installments commencing eighteen months after disbursement of each tranche
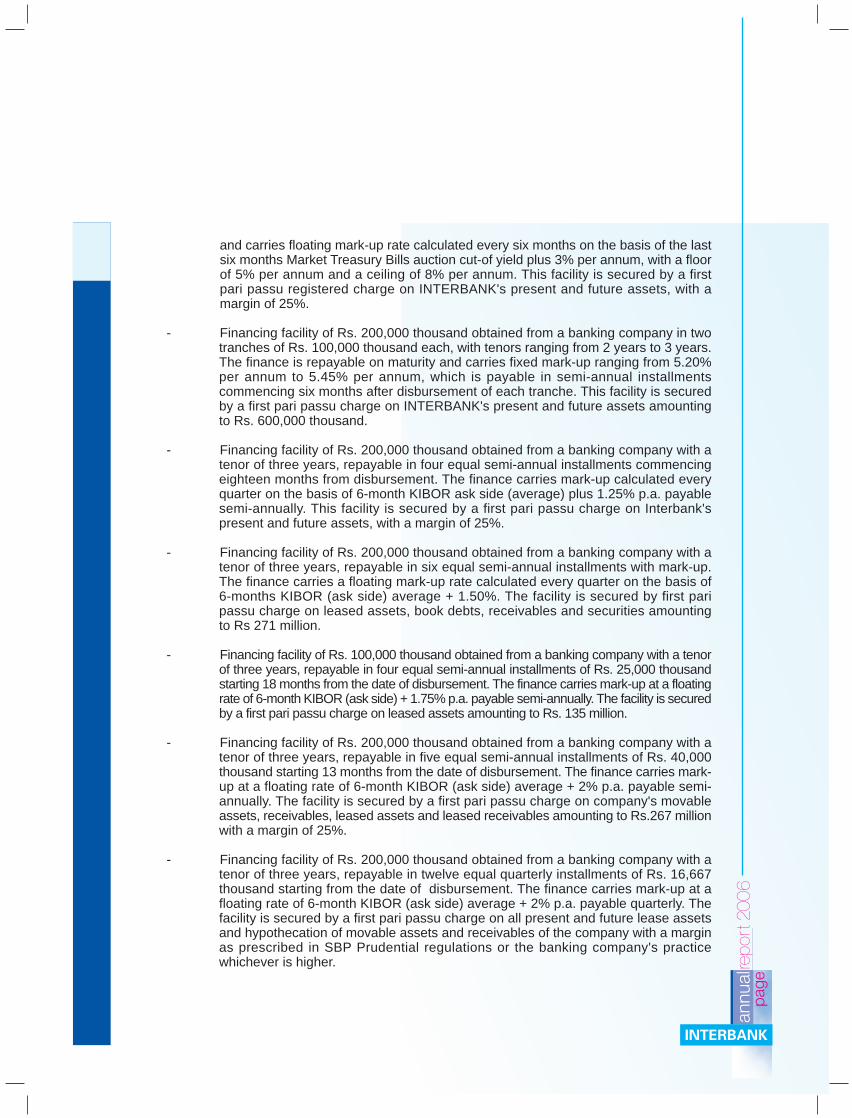
and carries floating mark-up rate calculated every six months on the basis of the lastsix months Market Treasury Bills auction cut-of yield plus 3% per annum, with a floorof 5% per annum and a ceiling of 8% per annum. This facility is secured by a firstpari passu registered charge on INTERBANK's present and future assets, with amargin of 25%.
- Financing facility of Rs. 200,000 thousand obtained from a banking company in twotranches of Rs. 100,000 thousand each, with tenors ranging from 2 years to 3 years.The finance is repayable on maturity and carries fixed mark-up ranging from 5.20%per annum to 5.45% per annum, which is payable in semi-annual installmentscommencing six months after disbursement of each tranche. This facility is securedby a first pari passu charge on INTERBANK's present and future assets amountingto Rs. 600,000 thousand.
- Financing facility of Rs. 200,000 thousand obtained from a banking company with atenor of three years, repayable in four equal semi-annual installments commencingeighteen months from disbursement. The finance carries mark-up calculated everyquarter on the basis of 6-month KIBOR ask side (average) plus 1.25% p.a. payablesemi-annually. This facility is secured by a first pari passu charge on Interbank'spresent and future assets, with a margin of 25%.
- Financing facility of Rs. 200,000 thousand obtained from a banking company with atenor of three years, repayable in six equal semi-annual installments with mark-up.The finance carries a floating mark-up rate calculated every quarter on the basis of6-months KIBOR (ask side) average + 1.50%. The facility is secured by first paripassu charge on leased assets, book debts, receivables and securities amountingto Rs 271 million.
- Financing facility of Rs. 100,000 thousand obtained from a banking company with a tenorof three years, repayable in four equal semi-annual installments of Rs. 25,000 thousandstarting 18 months from the date of disbursement. The finance carries mark-up at a floatingrate of 6-month KIBOR (ask side) + 1.75% p.a. payable semi-annually. The facility is securedby a first pari passu charge on leased assets amounting to Rs. 135 million.
- Financing facility of Rs. 200,000 thousand obtained from a banking company with atenor of three years, repayable in five equal semi-annual installments of Rs. 40,000thousand starting 13 months from the date of disbursement. The finance carries mark-up at a floating rate of 6-month KIBOR (ask side) average + 2% p.a. payable semi-annually. The facility is secured by a first pari passu charge on company's movableassets, receivables, leased assets and leased receivables amounting to Rs.267 millionwith a margin of 25%.
- Financing facility of Rs. 200,000 thousand obtained from a banking company with atenor of three years, repayable in twelve equal quarterly installments of Rs. 16,667thousand starting from the date of disbursement. The finance carries mark-up at afloating rate of 6-month KIBOR (ask side) average + 2% p.a. payable quarterly. Thefacility is secured by a first pari passu charge on all present and future lease assetsand hypothecation of movable assets and receivables of the company with a marginas prescribed in SBP Prudential regulations or the banking company's practicewhichever is higher.
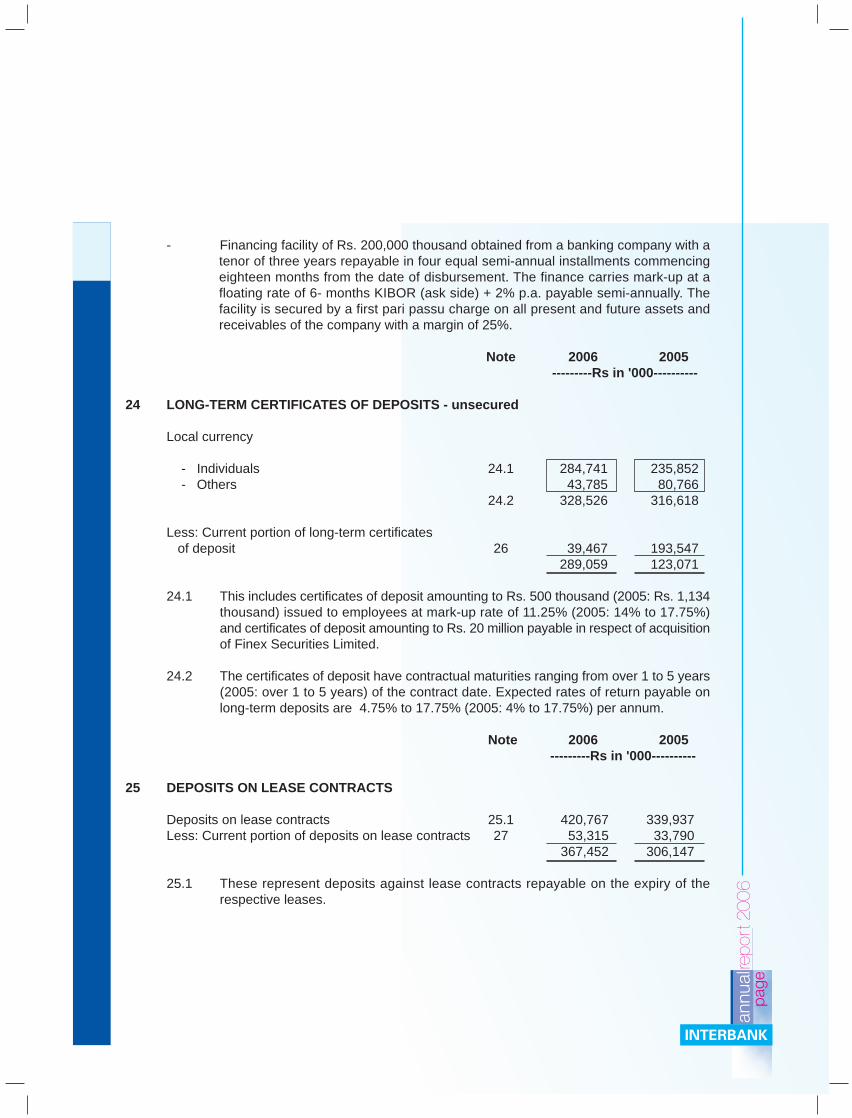
- Financing facility of Rs. 200,000 thousand obtained from a banking company with atenor of three years repayable in four equal semi-annual installments commencingeighteen months from the date of disbursement. The finance carries mark-up at afloating rate of 6- months KIBOR (ask side) + 2% p.a. payable semi-annually. Thefacility is secured by a first pari passu charge on all present and future assets andreceivables of the company with a margin of 25%.
Note 2006 2005 ---------Rs in '000----------
24 LONG-TERM CERTIFICATES OF DEPOSITS - unsecured
Local currency
- Individuals 24.1 284,741 235,852 - Others 43,785 80,766
24.2 328,526 316,618
Less: Current portion of long-term certificates of deposit 26 39,467 193,547
289,059 123,071
24.1 This includes certificates of deposit amounting to Rs. 500 thousand (2005: Rs. 1,134thousand) issued to employees at mark-up rate of 11.25% (2005: 14% to 17.75%)and certificates of deposit amounting to Rs. 20 million payable in respect of acquisitionof Finex Securities Limited.
24.2 The certificates of deposit have contractual maturities ranging from over 1 to 5 years(2005: over 1 to 5 years) of the contract date. Expected rates of return payable onlong-term deposits are 4.75% to 17.75% (2005: 4% to 17.75%) per annum.
Note 2006 2005 ---------Rs in '000----------
25 DEPOSITS ON LEASE CONTRACTS
Deposits on lease contracts 25.1 420,767 339,937Less: Current portion of deposits on lease contracts 27 53,315 33,790
367,452 306,147
25.1 These represent deposits against lease contracts repayable on the expiry of therespective leases.

Note 2006 2005 ---------Rs in '000----------
26 CURRENT MATURITY OF LONG TERM BORROWINGS
Long-term borrowings 23 615,000 325,000Long-term certificates of deposit 24 39,467 193,547
654,467 518,547
27 CURRENT MATURITY OF DEPOSITS ON LEASE CONTRACTS
Deposits on lease contracts 25 53,315 33,790
28 SHORT-TERM FINANCE - secured
Running finance 28.1 237 145,254
28.1 This represents amount borrowed against a running finance facility amounting to Rs.200,000 thousand (2005: Rs. 150,000 thousand). The amount is secured by a firstpari passu hypothecation on INTERBANK's present and future receivables and bookdebts. Return is payable monthly at 1-month KIBOR rate plus 1.5% per annum(2005: last 6-month Market Treasury Bill cut off yield plus 1.75% per annum).
Note 2006 2005 ---------Rs in '000----------
29 SHORT-TERM CERTIFICATES OF DEPOSIT - unsecured
Local currency - Financial institutions 1,250,000 825,000 - Individuals 183,155 54,904 - Others 276,559 290,166
29.1 1,709,714 1,170,070
29.1 Expected rates of return payable on short-term deposits range from 6.25% to 14.25%(2005: 3% to 14%) per annum for local currency deposits.
Note 2006 2 0 0 5 ---------Rs in '000----------
30 BORROWINGS FROM FINANCIAL INSTITUTIONS
Securities sold under repurchase agreement 97,347 324,618Unsecured borrowings 197,000 275,000
30.1 294,347 599,618

30.1 The above borrowings carry mark-up at rates ranging from 8.00% to 9.50% (2005: 8.1% to 10.75%) per annum and are due to mature within 4 days of the year-end.
Note 2006 2005 ---------Rs in '000----------
31 PAYABLE TO STAFF GRATUITY FUND 31.3 2,845 2,817
31.1 General description
As mentioned in note 4.17.2, INTERBANK operates an approved funded staff gratuityscheme. The scheme provides for terminal benefits for all permanent employees whohave completed their qualifying period of service with INTERBANK at varyingpercentages of last drawn basic salary. The percentage depends on the number ofservice years with INTERBANK.
Annual provision is based on actuarial valuation and the latest valuation was carriedout as at June 30, 2005 using the Projected Unit Credit Method.
31.2 Principal actuarial assumptions
The following principal actuarial assumptions were used for the valuation:
Per annum
Estimated rate of increase per annum in salary of the employees 9.52%Discount rate per annum 11.65%Expected rate of return on plan assets 11.65%
Note 2006 2005 ---------Rs in '000----------
31.3 Reconciliation of provision for gratuity scheme
Present value of defined benefit obligation 6,462 5,797Fair value of plan assets (4,755) (3,542)Unrecognised actuarial gain (net) 1,138 562
2,845 2,817
31.4 Gratuity scheme expense
Current service cost 1,379 756Interest cost 601 344Expected return on plan assets (423) (516)Actuarial gain recognised during the year (29) (39)
40 1,528 545

Note 2006 2005 ---------Rs in '000----------
31.5 Movement in defined benefit plan liability
Balance at the beginning of the year 2,817 3,372Expense for the year 31.4 1,528 545Contributions during the year (1,500) (1,100)Balance at the end of the year 2,845 2,817
31.6 Movement of fair value of plan assets
Balance at the beginning of the year 3,542 4,471Expected return on plan assets 423 516Contribution to the fund 1,500 1,100Benefits paid (1,315) (2,472)Acturial gain / (loss) on plan asssets 605 (73)Fair value of plan assets at the end of the year 4,755 3,542
31.7 Actual return on plan assets
Expected return on plan assets 423 516Actuarial gain / (loss) on plan assets 605 (73)Actual return on plan assets 1,028 443
32 MARK-UP ACCRUED
Secured- Long-term borrowings 7,732 9,361- Short-term finance 331 699- Borrowings from institutions 10 28
8,073 10,088Unsecured- TFCs 435 435- Certificates of deposit 51,429 32,870
51,864 33,30559,937 43,393

Note 2006 2005 ---------Rs in '000----------
33 ACCRUED EXPENSES AND OTHER LIABILITIES
Accrued expenses 13,130 8,929Payable to customers on account of excess recoveries 3,028 3,028Payable to Lahore Stock Exchange - 407Payable to customers in respect of brokerage business 33.1 84,377 45,153Unclaimed dividends 777 776Advances from lessees 7,617 9,505Payments from customers received on account 10,263 11,283Negative fair value of derivative financial Instruments - 1,121Payable in respect of non-competition fee 15,000 -Others 7,062 2,216
141,254 82,418
33.1 Amount due from related parties are as follows:
Key management personnel 4,573 4,573Associated undertakings 21,095 2,273Subsidiaries 2,480 -Other related parties 1,495 271
29,643 7,117
34 CONTINGENCIES AND COMMITMENTS
34.1 Contingencies
Contingencies relating to taxation have been disclosed in note 42.2
Note 2006 2005 ---------Rs in '000----------
34.2 Commitments
- Forward sale of shares 29,292 194,328 - Underwriting commitments 115,000 65,000 - Commitment in respect of capital acquisition 5,310 -

35 INCOME FROM INVESTMENTS
2006 2005
Held for Available Total Held for Available Total trading for sale trading for sale
-------------------------------------------------------- Rs in '000 --------------------------------------------------------
Interest / mark-up / profit from:
Government securities 3,805 2,023 5,828 14,133 18,332 32,465Registered Special US Dollar Bonds - 2,645 2,645 - 3,709 3,709TFCs - 20,781 20,781 106 10,187 10,293
3,805 25,449 29,254 14,239 32,228 46,467
Dividend income 523 12,854 13,377 131 9,795 9,926
Gain / (loss) on disposal of:
Government securities (17,617) (28,680) (46,297) 310 (14,637) (14,327)TFCs - 52 52 - - -Mutual fund units (open end) - 10,253 10,253 - - -Listed shares / certificates and modaraba certificates (166) 74,726 74,560 (145) 36,430 36,285
(17,783) 56,351 38,568 165 21,793 21,958(13,455) 94,654 81,199 14,535 63,816 78,351
2006 2005 -------Rs in '000-------
36 INCOME FROM FINANCE
Mark-up on finance 87,716 47,586Documentation charges and other finance related income 3,283 2,680
90,999 50,266
37 INCOME FROM LEASE FINANCE
Mark-up on lease finance 164,602 110,738Front-end fees, documentation charges and other lease related income 11,651 7,621
176,253 118,359
38 INCOME FROM FUND PLACEMENTS
Fund placements with financial institutions 53,627 22,234Securities purchased under resale agreements with financial institutions 29,563 28,192Income from continuous funding system 57,677 40,069
140,867 90,495

Note 2006 2005 ---------Rs in '000----------
39 FINANCE COSTS
Return on long term financing - term finance certificates - 9,801Return on long-term borrowings 93,854 41,971Return on certificate of deposits 215,117 91,247Mark-up on short-term finances 2,586 3,286Mark-up on borrowings from institutions 26,100 25,783Bank charges 313 651Amortisation of deferred costs - 149
337,970 172,888
40 ADMINISTRATION AND OPERATING EXPENSES
Salaries, allowances and benefits 65,262 42,880Contribution to provident fund 2,478 1,792Gratuity scheme expense 31.4 1,528 545Contribution to Employees' Old-Age Benefit Institution 176 132Depreciation on property, plant and equipment 5.1 7,930 5,464Amortisation on intangible assets 5.2 5,187 449Rent, rates and taxes 11,935 8,942Travelling and entertainment 3,387 1,815Telephone, telex and fax 4,078 3,153Printing, postage and stationery 4,167 3,249Insurance 1,373 1,147Lighting, heating and cooling 2,413 2,134Auditors' remuneration 40.1 942 590Repairs and maintenance 1,873 1,942Brokerage and commission 13,200 8,650Legal and professional fees 9,314 7,549Subscriptions 529 766Advertisement 1,701 1,122Fixed assets written off 30 -Provision against other assets 5,094 -Amortisation of deferred costs - 60Other expenses 5,134 1,562
147,731 93,943

Note 2006 2005 ---------Rs in '000----------
40.1 Auditors' remuneration
Statutory audit fee 425 425Half yearly review fee 100 100Other services 363 55Out-of-pocket expenses 54 10
942 590
41 OTHER OPERATING INCOME
Income from financial assetsIncome from deposits with banks 3,945 898Net exchange gain / (loss) (8) 935
Income from other than financial assetsGain on disposal of fixed assets 1,326 586Other income 429 -
5,692 2,419
Note 2006 2005 ---------Rs in '000----------
42 TAXATION
For the year - Current 9,404 5,902
- Deferred 42.3 (17,927) 11,742(8,523) 17,644
For prior years - (11,473)(8,523) 6,171

2006 2005 ---------Rs in '000----------
42.1 Relationship between tax expense and accounting profit
Profit for the year from ordinary activities before taxation 28,787 80,866
Tax at the applicable rate of 35% (2005: 35%) 10,075 28,303
Tax effect of income / expenses that are exempt / not allowed in determining taxable income (26,094) (13,374)
Tax effect on account of income taxed under Final Tax Regime 1,563 1,654
Adjustment in respect of current income tax of prior years - (11,473)
Tax effect of dividend income taxed at a lower rate (4,013) (2,977)
Minimum tax under section 113 of Income Tax Ordinance, 2001 5,092 4,038
Others 4,853 -Tax charge (8,523) 6,171
42.2 The provision for taxation has been computed by INTERBANK at the rate applicableto a public company. In the original assessments made by the Deputy Commissionerof Income Tax (DCIT), the rate for the assessment years 1991-1992 to 2000-2001and 2002-2003 applied in computing the tax liability was that applicable to a bankingcompany. However, in the appeals filed against the original assessments upto theassessment year 1997-1998, the Commissioner of Income Tax (Appeals) [CIT(A)]directed the DCIT to apply the rate applicable to a public company. The Income TaxDepartment then filed appeals before the Income Tax Appellate Tribunal (ITAT) againstthese directions. The ITAT, in its decision on the issue of application of bankingcompany tax rate in respect of assessment years 1991-1992 to 1997-1998 held thatinvestment banks are not banking companies and therefore the rate of tax applicableto a public company should be applied. However, the tax authorities have filed appealsagainst the ITAT orders in the Lahore High Court.

In the original assessment made by the DCIT for the assessment years 1995-96 to2000-2001, dividend income was taxed by applying the rate applicable to the businessincome of a banking company instead of applying the reduced rate of 5% as prescribedby law. The CIT (A) and the ITAT have confirmed that such income is taxable at thereduced rate of 5% in respect of assessment years 1995-96 to 1997-98. Howeverthe tax authorities have filed appeals against the ITAT orders in the Lahore High Courtfor assessment years 1995-96 and 1996-97. The ITAT has declined to refer thequestion of law proposed by the taxation authorities for assessment years 1997-98,regarding the taxation of dividend income, on the basis that Lahore High Court hasalready decided the matter against the taxation authorities. In addition, the taxationauthorities have also disallowed certain expenses / made addition to taxable incomein certain assessment years against which INTERBANK has filed appeals which arecurrently pending. Based on the previous decisions, INTERBANK is confident thatthe above matters would be decided in its favour and the possibility of any liabilityarising is considered remote.
If the provision for taxation were to be made at the rate applicable to a bankingcompany and disallowance of expenses / addbacks to income is decided againstINTERBANK, the additional provision for all assessment years upto the tax year 2005would approximately be Rs 166 million (2005: Rs 146 million). During the current yearINTERBANK has received a letter in which the Central Board of Revenue (CBR) hasgiven its consent to the proposal of Director General, LTU, Lahore to withdraw theappeals relating to the tax status of investment banks.
Income tax return for tax year 2003 was filed and deemed to be assessed undersection 120 of the Income Tax Ordinance, 2001. However, by resorting to the powersgiven under section 177 of the said Ordinance, the CIT had selected the case foraudit. Against the said selection, INTERBANK had filed a writ in the Lahore HighCourt and the court had held the selection to be defective on the basis that whilemaking this selection, the essentials required by the law were not followed. It wasalso mentioned in the order that the CIT could initiate fresh proceedings strictly inaccordance with law. The Income Tax Department had filed an appeal against thedecision of the Lahore High Court before the Supreme Court of Pakistan. The SupremeCourt in its decision dated March 1, 2006 has directed that the department shouldissue fresh notices to INTERBANK in terms of Section 177 of the Ordinance disclosingcriteria/reasons for selecting their cases for purpose of audit. Pursuant to this order,the company has received notice for selection of case for Tax Year 2003 for auditunder section 177 of the Ordinance.

Note 2006 2 0 0 5 ---------Rs in '000----------
42.3 Deferred
Deferred taxation comprises:
Deferred tax assets arising in respect of
- Provision for doubtful finance / potential lease losses (12,356) (14,512) - Carry forward of income tax loss 42.3.1 (102,670) (67,442) - Deficit on revaluation of investments 21 (159) (16,510)
(115,185) (98,464)Deferred tax liabilities arising due to
- Accelerated tax depreciation 154,411 141,034 - Transaction cost in respect of TFCs issued 42.4 1,768 -
40,994 42,570
42.3.1 As at June 30, 2006, INTERBANK had unabsorbed tax losses of Rs.293,343thousand (2005: Rs. 192,693 thousand) against which deferred tax asset ofRs. 102,670 thousand (2005: Rs. 67,442 thousand) has been recorded at thetax rates applicable to the periods in which these losses are expected to berealised based on INTERBANK's projection of future taxable profits whichwould offset these losses before their expiry.
2006 2 0 0 5 ---------Rs in '000----------
42.4 Movement in deferred tax liability
Opening provision 42,570 32,588Provision made / (reversal) during the year (17,927) 11,742
24,643 44,330
Deferred tax credit / (debit) on deficit on revaluation of investments 16,351 (1,760)
40,994 42,570

43 REMUNERATION OF CHIEF EXECUTIVE AND EXECUTIVES
Chief Executive Executives Total 2006 2005 2006 2005 2006 2005
------------------------------------------------------------------- Rs in '000 ---------------------------------------------------------------Managerial remuneration 4,224 2,977 14,685 7,119 18,909 10,096House rent - - 5,529 2,052 5,529 2,052Utilities 320 282 1,294 648 1,614 930Retirement benefits 586 451 2,075 789 2,661 1,240Medical expenses 354 282 619 327 973 609Conveyance 196 138 2,134 1,181 2,330 1,319Others 60 - 2,673 1,980 2,733 1,980
5,740 4,130 29,009 14,096 34,749 18,226
Number of persons 1 1 22 8 23 9
Certain executives are provided with free unfurnished accommodation in lieu of house rent allowance.Free use of INTERBANK's cars is provided to the chief executive and senior executives.
44 TRANSACTIONS WITH ASSOCIATED UNDERTAKINGS /RELATED PARTIES
2006DESCRIPTION Key
Subsidiaries Associated Other related Management TotalUndertakings parties personnel
--------------------------------------------- Rs in '000 -----------------------------------------------
Transactions entered during the periodCertificate of deposits issued - 1,480,143 241,765 - 1,721,908Insurance premium paid - 1,074 - - 1,074Finance provided 40,000 - - 6,386 46,386Payment to staff gratuity fund - - 1,500 - 1,500Balance outstanding as at the period endLoans and advances 40,000 - - 3,554 43,554Deposit against CFS trading 115,000 - - - 115,000Deposit accounts - (517) - - (517)Certificate of deposits - 100,000 48,295 - 148,295Trade debts - 21,022 - - 21,022Other receivable 1,377 2,030 - - 3,407Markup accrued - Certificate of deposits - 542 943 - 1,485Markup accrued- Finance 236 - - 4 240Trade creditors 2,480 21,095 1,495 4,573 29,643Profit / Expense for the periodIncome from finance 1,905 - - 249 2,154Brokerage, commission and fee income - 2,617 210 73 2,900Return on deposits - 24,668 5,001 - 29,669Rent expense - 2,882 - - 2,882Insurance expense - 1,155 - - 1,155Travelling and lodging - 664 57 - 721Charge for the year in respect of employee benefit and contribution plan - - 4,182 - 4,182Remuneration to key management personnel - - - 24,745 24,745Post employment benefit - - - 303 303

2005DESCRIPTION Key
Subsidiaries Associated Other related Management TotalUndertakings parties personnel
---------------------------------------------- Rs in '000 ----------------------------------------------
Transactions entered during the periodCertificate of deposits issued - 390,561 941,699 - 1,332,260Insurance premium paid - 1,064 - - 1,064Finance provided - - - 1,764 1,764Payment to staff gratuity fund - - 1,100 - 1,100Balance outstanding as at the period endLoans and advances - - - 4,296 4,296Prepaid insurance - 80 - - 80Deposit accounts - 196 - - 196Certificate of deposits - 50,000 38,320 - 88,320Trade debts - 3,292 - 4,574 7,866Other receivable - 968 - - 968Markup accrued - Certificate of deposits - 70 222 - 292Trade creditors - 2,273 271 4,573 7,117Profit / Expense for the periodIncome from finance - - - 497 497Brokerage, commission and fee income - 1,386 1,526 23 2,935Return on deposits - 2,351 8,334 - 10,685Rent expense - 2,573 - - 2,573Insurance expense - 984 - - 984Travelling and lodging - 321 - - 321Charge for the year in respect of employee benefit and contribution plan - - 2,469 - 2,469Remuneration to key management personnelPost employment benefit - - - 27,071 27,071
American Express Bank Limited, Ali Institute of Education, Arif Habib Investment ManagementLimited, Arif Habib Rupali Bank Limited, Aventis Limited, BOC Pakistan Ltd, Baber Ali Foundation,Bayer CropScience (Pvt) Limited, Coca Cola Beverages Pakistan Limited, Continental FurnishingCompany (Private) Limited, Gurmani Foundation, Haroon Oil Limited, Industrial Technical andEducation Institute, International Industries Limited, Mitchell's Fruit Farms Limited, New JublieeInsurance Co. Ltd, New Jubliee Life Insurance Co. Ltd, National Management Foundation,Nestle Pakistan Limited, Packages Limited, Packages Lanka (Private) Limited, Pak ArabFertilizer (Private) Limited, Pak Chemicals Ltd, Pakistan Cables Limited, Real Estate ModarabaManagement Company Limited, Rotocast Engineering (Private) Limited, Siemens PakistanEngineering Company Limited, Syed Maratib Ali Religious & Charitable Society, Tetra Pak(Pakistan) Limited, Tri-Pack Films Limited, Unilever Pakistan Limited were related partiesduring the year being companies under common directorship.
Atchison College, Bagh-e-Rehmat Trust, Businessman Hospital Trust, Indus Valley SchoolArts & Architecture, Kinnaired College, Lahore School of Economics, Layton Rehmat UllahBenevolent Trust, Mohatta Palace Gallery Trust, Pakistan Center For Philonthropy, Shell LiveWire International, Syed Ahsan Ali Gauhar Jee Foundation and World Wide Fund were relatedparties during the year due to certain directors being the member / trustee of the managingbody of these institutions.
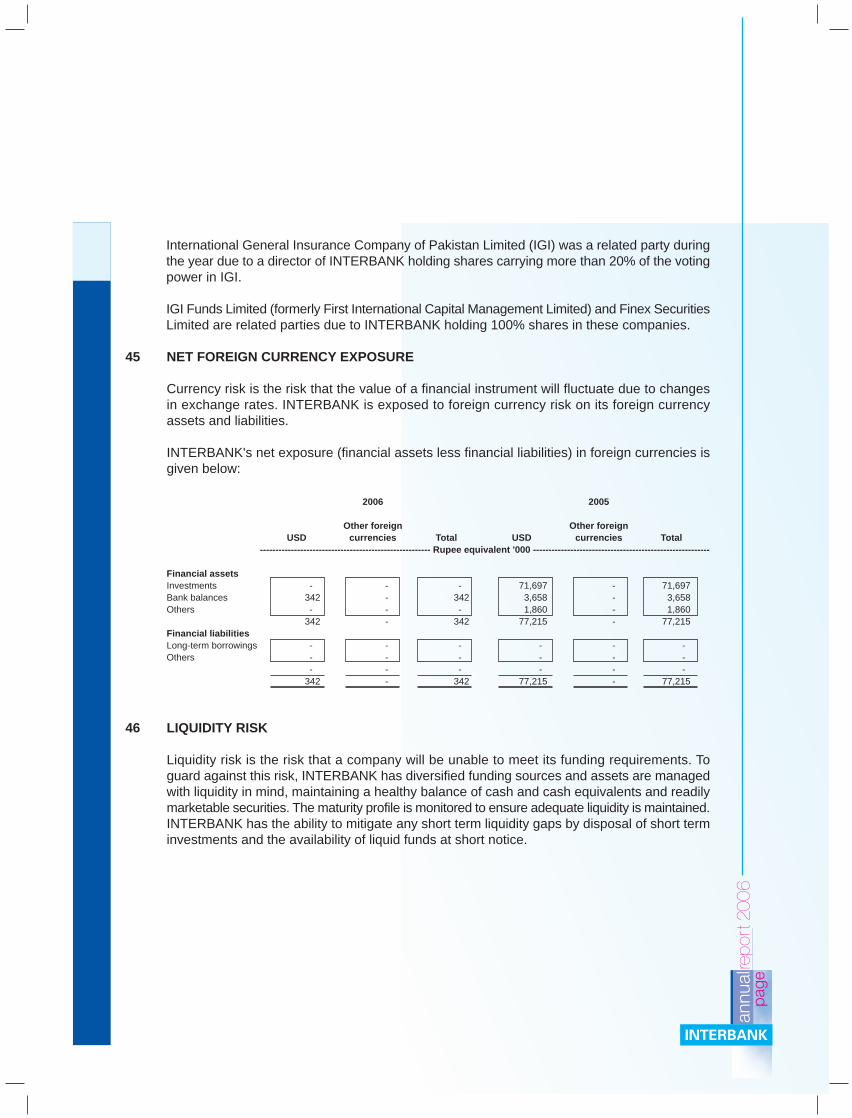
International General Insurance Company of Pakistan Limited (IGI) was a related party duringthe year due to a director of INTERBANK holding shares carrying more than 20% of the votingpower in IGI.
IGI Funds Limited (formerly First International Capital Management Limited) and Finex SecuritiesLimited are related parties due to INTERBANK holding 100% shares in these companies.
45 NET FOREIGN CURRENCY EXPOSURE
Currency risk is the risk that the value of a financial instrument will fluctuate due to changesin exchange rates. INTERBANK is exposed to foreign currency risk on its foreign currencyassets and liabilities.
INTERBANK's net exposure (financial assets less financial liabilities) in foreign currencies isgiven below:
2006 2005
Other foreign Other foreignUSD currencies Total USD currencies Total
------------------------------------------------------- Rupee equivalent '000 ---------------------------------------------------------
Financial assetsInvestments - - - 71,697 - 71,697Bank balances 342 - 342 3,658 - 3,658Others - - - 1,860 - 1,860
342 - 342 77,215 - 77,215Financial liabilitiesLong-term borrowings - - - - - -Others - - - - - -
- - - - - -342 - 342 77,215 - 77,215
46 LIQUIDITY RISK
Liquidity risk is the risk that a company will be unable to meet its funding requirements. Toguard against this risk, INTERBANK has diversified funding sources and assets are managedwith liquidity in mind, maintaining a healthy balance of cash and cash equivalents and readilymarketable securities. The maturity profile is monitored to ensure adequate liquidity is maintained.INTERBANK has the ability to mitigate any short term liquidity gaps by disposal of short terminvestments and the availability of liquid funds at short notice.

The table below summarises the maturity profile of INTERBANK's assets and liabilities. Thecontractual maturities of assets and liabilities at the year-end have been determined on thebasis of the remaining period at the balance sheet date to the contractual maturity date anddo not take account of the effective maturities as indicated by INTERBANK's deposit retentionhistory and the availability of liquid funds. Assets and liabilities not having a contractual maturityare assumed to mature on the expected date on which the assets / liabilities will be realised/ settled.
As at June 30, 2006 Total Within one More than More than
year one year five yearsand lessthan five
years------------------------------------------- Rs in '000 -----------------------------------------
AssetsFixed assets 91,083 20,501 49,582 21,000Long-term investments 182,571 - - 182,571Long-term loans and advances 546,554 176,729 367,000 2,825Net investment in lease finance 1,929,202 695,624 1,231,852 1,726Long-term deposits and prepayments 3,707 - - 3,707Short-term finance 273,252 273,252 - -Fund placements 809,567 809,567 - -Short-term investments 761,157 533,590 135,000 92,567Taxation - net 220,594 220,594 - -Advances, deposits and prepayments 151,704 151,704 - -Interest / mark-up / profit accrued 28,326 28,326 - -Trade debts 72,865 72,865 - -Other receivables 24,982 24,982 - -Cash and bank balances 196,978 196,978 - -
5,292,542 3,204,712 1,783,434 304,396
LiabilitiesPre-IPO subscription towards issue of term finance certificates 369,950 - - 369,950Long-term borrowings 1,308,333 615,000 693,333 -Certificates of deposit 2,038,240 1,749,181 289,059 -Deposits on lease contracts 420,767 53,315 365,885 1,567Payable to staff gratuity fund 2,845 2,845 - -Deferred tax liabilities- net 40,994 44,939 67,733 (71,678)Short term finance 237 237 - -Borrowings from financial institutions 294,347 294,347 - -Mark-up accrued 59,937 59,937 - -Accrued expenses and other liabilities 141,254 141,254 - -
4,676,904 2,961,055 1,416,010 299,839Net assets 615,638 243,657 367,424 4,557
Represented by:Share capital and reserves 644,567 Deficit on revaluation of investments - net (28,929)
615,638

As at June 30, 2005 Total Within one More than More than
year one year five yearsand lessthan five
years------------------------------------------- Rs in '000 -----------------------------------------
AssetsFixed assets 52,034 396 30,638 21,000Long-term loans and advances 409,549 153,050 250,023 6,476Net investment in lease finance 1,670,899 514,395 1,153,328 3,176Long-term deposits, prepayments 3,636 - 869 2,767Short-term finance 168,022 168,022 - -Fund placements 749,426 749,426 - -Short-term investments 956,482 446,803 234,362 275,317Taxation - net 216,717 216,717 - -Advances, deposits and prepayments 69,946 69,946 - -Interest / mark-up / profit accrued 20,541 20,541 - -Trade debts 41,250 41,250 - -Other receivables 9,268 9,268 - -Cash and bank balances 41,925 41,925 - -
4,409,695 2,431,739 1,669,220 308,736
LiabilitiesLong-term borrowings 1,033,333 325,000 708,333 -Certificates of deposit 1,486,688 1,363,617 123,071 -Deposits on lease contracts 339,937 33,790 304,031 2,116Payable to staff gratuity fund 2,817 2,817 - -Deferred tax liabilities- net 42,570 (44,401) 103,481 (16,510)Short term finance 145,254 145,254 - -Borrowings from financial institutions 599,618 599,618 - -Mark-up accrued 43,393 43,393 - -Accrued expenses and other liabilities 82,418 82,418 - -
3,776,028 2,551,506 1,238,916 (14,394)Net assets 633,667 (119,767) 430,304 323,130
Represented by:Share capital and reserves 665,942 Deficit on revaluation of investments - net (32,275)
633,667
47 YIELD / MARKET RATE RISK
Yield risk is the risk of decline in earnings due to adverse movements of the yield curve.Market rate risk arises from the possibility that changes in market rates of return will affectthe value of the financial instruments. A company is exposed to yield / market rate risk as aresult of mismatches or gaps in the amounts of financial assets and financial liabilities thatmature or reprice in a given period. INTERBANK manages this risk by matching the repricingof financial assets and liabilities through risk management strategies. The position for financialinstruments is based on earlier of contractual repricing date or maturity.

INTERBANK's exposure to yield / market rate risk and the effective rates on its financial assets andliabilities are summarised as follows :
As at June 30, 2006
Exposed to yield / market rate riskMore than Not
Effective Total Within one one year More than exposed torate year and less five years yield /
than five market rateyears risk
% ------------------------------------------------- Rs in '000 -------------------------------------------
FINANCIAL ASSETS
Long-term loans and advances 13.90% 546,554 176,729 367,000 2,825 -Net investment in lease finance 12.05% 1,929,202 695,624 1,231,852 1,726 - Long-term deposits - 3,707 - - - 3,707Short term finance 13.09% 273,252 273,252 - - -Fund placements 12.37% 809,567 809,567 - - -Short-term investments 9.78% 761,157 124,010 135,000 92,567 409,580Advances and deposits - 133,545 - - - 133,545Interest / mark-up / profit accrued - 28,326 - - - 28,326Trade debts - 72,865 - - - 72,865Other receivables - 24,982 - - - 24,982Cash and bank balances 2.86% 196,978 64,118 - - 132,860
4,780,135 2,143,300 1,733,852 97,118 805,865FINANCIAL LIABILITIES
Pre-IPO subscription towards issue of term finance certificates 11.90% 369,950 - - 369,950 - Long-term borrowings 10.22% 1,308,333 615,000 693,333 - - Certificates of deposit 10.18% 2,038,240 1,749,181 289,059 - - Deposits on lease contracts - 420,767 - - - 420,767Short-term finance 10.11% 237 237 - - - Borrowings from financial institutions 8.91% 294,347 294,347 - - - Mark-up accrued - 59,937 - - - 59,937Accrued expenses and other liabilities - 141,254 - - - 141,254
4,633,065 2,658,765 982,392 369,950 621,958
On-balance sheet gap 147,070 (515,465) 751,460 (272,832) 183,907
Total yield / market rate sensitivity gap (515,465) 751,460 (272,832)
Cumulative yield / market rate sensitivity gap (515,465) 235,995 (36,837)

As at June 30, 2005 Exposed to yield / market rate risk
More than NotEffective Total Within one one year More than exposed to
rate year and less five years yield /than five market rate
years risk
% ------------------------------------------------- Rs in '000 -------------------------------------------
FINANCIAL ASSETSLong-term loans and advances 11.01% 409,549 153,050 250,023 6,476 -Net investment in lease finance 7.93% 1,670,359 514,395 1,152,788 3,176 -Long-term deposits - 2,767 - - - 2,767Short-term finance 10.56% 168,022 168,022 - - -Fund placements 12.62% 749,426 749,426 - - -Short-term investments 7.50% 956,482 134,111 130,785 247,329 444,257
Advances and deposits - 56,836 - - - 56,836Interest / mark-up / profit accrued - 20,541 - - - 20,541Trade debts - 41,250 - - - 41,250Other receivables - 9,268 - - - 9,268Cash and bank balances 1.50% 41,925 33,192 - - 8,733
4,126,425 1,752,196 1,533,596 256,981 583,652
FINANCIAL LIABILITIESLong-term borrowings 7.85% 1,033,333 325,000 708,333 - -Certificates of deposit 9.01% 1,486,688 1,363,617 123,071 - -Deposits on lease contracts - 339,937 - - - 339,937Short term finance 8.36% 145,254 145,254 - - -Borrowings from financial institutions 9.34% 599,618 599,618 - - -Mark-up accrued - 43,393 - - - 43,393Accrued expenses and other liabilities - 82,418 - - - 82,418
3,730,641 2,433,489 831,404 - 465,748
On-balance sheet gap 395,784 (681,293) 702,192 256,981 117,904
Off-balance sheet gap 9.23% - - - 191,843
Total yield / market rate sensitivity gap (681,293) 702,192 256,981Cumulative yield / market rate sensitivity gap (681,293) 20,899 277,880

48 CREDIT RISK AND CONCENTRATIONS OF CREDIT RISK
Credit risk is the risk that one party to a financial instrument will fail to discharge an obligationand cause the other party to incur a financial loss. INTERBANK attempts to control credit riskby monitoring credit exposures, limiting transactions to specific counterparties and continuallyassessing the credit worthiness of counterparties.
Concentrations of credit risk arise when a number of counterparties are engaged in similarbusiness activities, or have similar economic features that would cause their ability to meetcontractual obligations to be similarly affected by changes in economic, political or otherconditions. Concentrations of credit risk indicate the relative sensitivity of a company'sperformance to developments affecting a particular industry.
INTERBANK follows two sets of guidelines. It has its own operating policy and also adheresto the regulations issued by the SECP. The operating policy defines the extent of fund andnon-fund based exposures with reference to a particular sector or group.
INTERBANK seeks to manage its credit risk through diversification of financing activities toavoid undue concentrations of credit risk with individuals or groups of customers in specificlocations or businesses. It also obtains securities when appropriate. Details of the compositionof finance and lease portfolios of INTERBANK are given below:
2006 2005Rs in '000 % Rs in '000 %
Finance and leases
Dairy and poultry 3,722 0.14 1,209 0.05Cement 5,999 0.22 3,143 0.14Health 20,685 0.75 3,975 0.18Glass and ceramics 8,012 0.29 13,360 0.59Leather 29,419 1.07 19,452 0.87Paper and board 55,360 2.01 20,405 0.91Construction 39,360 1.43 35,812 1.59Energy, oil and gas 65,333 2.38 37,715 1.68Financial institutions 79,260 2.88 40,000 1.78Electric and electric goods 55,811 2.03 71,755 3.19Chemicals / fertilizers / pharmaceuticals 75,707 2.75 71,893 3.20Food, tobacco and beverages 91,607 3.33 96,769 4.30Steel, engineering and automobiles 131,366 4.78 134,578 5.99Transport 261,333 9.50 241,866 10.76Textile / textile composite 515,900 18.77 390,529 17.37Miscellaneous (including individuals) 1,310,234 47.67 1,066,009 47.41
2,749,008 100.00 2,248,470 100.00
Sector-wise concentration of fund placements and investments has been included in notes 6,12 and 13 to the financial statements.

49 FAIR VALUE OF FINANCIAL INSTRUMENTS
Fair value is an amount for which an asset could be exchanged, or a liability settled, betweenknowledgeable willing parties in an arm's length transaction. Consequently, differences mayarise between the carrying amounts and the fair value estimates.
Underlying the definition of fair value is the presumption that INTERBANK is a going concernwithout any intention or requirement to curtail materially the scale of its operations or toundertake a transaction on adverse terms.
2006 2005 Carrying Fair Carrying Fair amount value amount value--------------------------------- Rs in '000------------------------------------
FINANCIAL ASSETS
Long-term loans and advances 546,554 546,544 409,549 409,549
Net investment in lease finance 1,929,202 1,929,202 1,670,359 1,670,359
Long-term deposits 3,707 3,707 2,767 2,767
Short-term finance 273,252 273,252 168,022 168,022
Fund placements 809,567 809,567 749,426 749,426
Short-term investments 761,157 761,157 956,482 956,482
Advances and deposits 133,545 133,545 56,836 56,836
Interest / mark-up / profit accrued 28,326 28,326 20,541 20,541
Trade debts 72,865 72,865 41,250 41,250
Other receivables 24,982 24,982 9,268 9,268
Cash and bank balances 196,978 196,978 41,925 41,925
4,780,135 4,780,135 4,126,425 4,126,425
FINANCIAL LIABILITIES
Long term financing - term finance certificates 369,950 369,950 - -
Long-term borrowings 1,308,333 1,308,333 1,033,333 1,033,333
Certificates of deposit 2,038,240 2,038,240 1,486,688 1,486,688
Deposits on lease contracts 420,767 420,767 339,937 339,937
Short-term finance 237 237 145,254 145,254
Borrowings from financial institutions 294,347 294,347 599,618 599,618
Mark-up accrued 59,937 59,937 43,393 43,393
Accrued expenses and other liabilities 141,254 141,254 82,418 82,418
4,633,065 4,633,065 3,730,641 3,730,641
OFF BALANCE SHEET
FINANCIAL INSTRUMENTS - - 191,843 191,843

49.1 As at June 30, 2005, the fair values of all financial instruments are based on the valuation methodology outlined below:
(a) Finances and certificates of deposit
For all finances, including leases, and certificates of deposit, the fair valueshave been taken at carrying amounts as these are not considered materiallydifferent from their fair values based on the current yields / market rates andrepricing profiles of similar finance and deposit portfolios.
(b) Investments
The fair values of quoted investments are based on quoted market pricesor average of quotations received from the brokers. Unquoted local currencyinvestments are stated at cost less impairment, if any, which approximatestheir fair value in the absence of an active market. Fair value of unquotedforeign currency bonds which carry a floating rate of return is considered tobe the same as their carrying amount as these can only be redeemed at theircarrying amount from designated banks.
(c) Other financial instruments
The fair values of all other financial instruments are considered to approximatetheir carrying amounts.
50 EARNINGS PER SHARE
50.1 Basic
Basic earnings per share are calculated by dividing the profit for the year from ordinaryactivities after taxation by the weighted average number of shares outstanding duringthe year as follows:
2006 2005
Profit for the year from ordinary activities after taxation - Rupees in thousands 37,310 74,695
Weighted average number of shares outstanding during the year - in thousands 41,917,500 41,917,500
Basic earnings per share - Rupees 0.89 1.78
50.2 Diluted
No figure for diluted earnings per share has been presented as INTERBANK has notissued any instrument which would have a dilutive impact on its earnings per sharewhen exercised.

51 SEGMENTAL ANALYSIS
INTERBANK's activities may be broadly categorised into three primary business segmentsnamely financing activities, investment activities and brokerage activities within Pakistan.
Financing activities
Financing activities include providing long-term and short-term financing facilities to corporateand individual customers including lease financing.
Investment activities
Investment activities include money market activities, investment in government securities,advisory services, capital market activities and the management of INTERBANK's liquidity.
Brokerage activities
Brokerage activities include brokerage services offered to retail and institutional clients throughINTERBANK's seat at the Lahore Stock Exchange and through its subsidiary Finex Securities.
Note Financing Investment Brokerage Totalactivities activities activities
-------------------------------- Rs in '000---------------------------
Segmental information for
the year ended June 30, 2006
Segment revenue 268,578 232,859 20,757 522,194
Segment result / profit before tax (8,419) 41,641 (4,435) 28,787
Taxation (8,523)
Profit for the year from ordinary activities
after taxation 37,310
Segment assets 2,804,272 1,764,126 279,457 4,847,855
Unallocated assets 444,687
Segment liabilities 428,384 99,377 527,761
Unallocated liabilities 4,149,143 4,149,143
Unallocated capital expenditure -Tangible 21,744
Capital expenditure - Intangible 30,000 30,000
Unallocated capital expenditure -Intangible 1,588
Segment depreciation and
amortisation of fixed assets 4,603 3,991 4,523 13,117

Segmental information for the
year ended June 30, 2005
Segment revenue 169,324 176,837 8,673 354,834
Segment result / profit before tax 38,507 41,838 521 80,866
Taxation 6,171
Profit for the year from ordinary
activities after taxation 74,695
Segment assets 2,256,701 1,755,633 77,487 4,089,821
Unallocated assets 319,874
Segment liabilities 349,442 45,153 394,595
Unallocated liabilities 3,381,433
Capital expenditure - Tangible 13,340 13,340
Unallocated capital expenditure -Tangible 4,955
Capital expenditure - Intangible 21,000 21,000
Unallocated capital expenditure -Intangible 2,819
Segmented depreciation and
amortisation of fixed assets 51.1 2,271 2,372 1,270 5,913
51.1 Depreciation and amortisation has been allocated in the proportion of segment revenueas fixed assets are shown under unallocated assets.
52 CRITICAL ACCOUNTING ESTIMATES AND JUDGMENTS
The preparation of financial statements in conformity with approved accounting standardsrequires the use of certain critical accounting estimates. It also requires the management toexercise its judgment in the process of applying the company's accounting policies. Estimatesand judgments are continually evaluated and are based on historical experience, includingexpectations of future events that are believed to be reasonable under the circumstances. Theareas where various assumptions and estimates are significant to the company's financialstatements or where judgment was exercised in application of accounting policies are asfollows:
i) Classification and valuations of investments (note 13)
ii) Income taxes (note 42)
iii) Staff retirement benefits (note 31)
53 NUMBER OF EMPLOYEES
The total number of employees at year-end was 140 (2005: 89).

54 NON-ADJUSTING EVENTS AFTER THE BALANCE SHEET DATE
The Board of Directors in its meeting held on October 06, 2006 has proposed a stock dividendof one share for every ten share i.e. 10 % in respect of the year ended June 30, 2006 (2005:cash dividend @ Rs 1.4 per share). The proposed stock dividend will be approved in theforthcoming Annual General Meeting. The financial statements for the year ended June 30,2006 do not include the effect of this stock dividend which will be accounted for in the financialstatements for the year ended June 30, 2007.
55 CORRESPONDING FIGURES
Corresponding figures have been rearranged and reclassified, wherever necessary, for thepurpose of comparison. Significant reclassifications are as follows:
- Receivable against continuous funding system transactions / carry over transactionsamounting to Rs. 134,920 thousand was included under the head "securities purchasedunder resale agreements with financial institutions" in the comparative year. It hasnow been separately disclosed as a line item in the current year.
- Income from continuous funding system transactions / carry over transactionsamounting to Rs. 40,069 thousand was included under the head " income fromsecurities purchased under resale agreements with financial institutions" in thecomparative year. It has now been separately disclosed as a line item in the currentyear.
56 DATE OF AUTHORISATION FOR ISSUE
These financial statements were authorised for issue by the Board of Directors on October 06, 2006.
57 GENERAL
Figures have been rounded off to the nearest thousand of rupees.
SYED BABAR ALI SAMIR AHMED Chairman Managing Director & Chief Executive