1 JPSS Proving Ground and Risk Reduction Mitch Goldberg, JPSS Program Scientist (NOAA) John...
43
1 JPSS Proving Ground and Risk Reduction Mitch Goldberg, JPSS Program Scientist (NOAA) John Furgerson, JPSS User Liaison (NOAA) Ingrid Guch, STAR JPSS PGRR Co-Chair January 12, 2012 - NOAA AQ Proving Ground
-
Upload
jacoby-cranfield -
Category
Documents
-
view
224 -
download
0
Transcript of 1 JPSS Proving Ground and Risk Reduction Mitch Goldberg, JPSS Program Scientist (NOAA) John...

1
JPSS Proving Ground and Risk Reduction
Mitch Goldberg, JPSS Program Scientist (NOAA)John Furgerson, JPSS User Liaison (NOAA)
Ingrid Guch, STAR JPSS PGRR Co-Chair
January 12, 2012 - NOAA AQ Proving Ground

2
TOPICS
Overview of JPSS
Compare JPSS Products with GOES-R
Scope of JPSS PGRR Program
Overview of VIIRS and examples of early imagery
Joint Polar Satellite System 2

3
JPSS Program Overview
JPSS-1 Satellite
(NPP-clone)
Benefits
• Maintains continuity of weather/climate observations and critical environmental data from the polar orbit
• NOAA – JPSS provides improved continuity for POES
• HIRS > CrIS
• AMSU > ATMS
• AVHRR > VIIRS
• SBUV2 > OMPS
• NASA – JPSS provides continuity for EOS
• AIRS > CrIS
• AMSU > ATMS
• MODIS > VIIRS
• OMI > OMPS
• CERES > CERES
• AMSR-E > AMSR2 (JAXA-GCOM-W)

4
System Description(Space Segment)
4Joint Polar Satellite System
NOAA Heritage
NASA Heritage
JPSS Instrument Measurement
AMSU AMSU ATMSATMS and CrIS together provide profiles of atmospheric temperature, moisture, and pressure
HIRS AIRS CrIS
AVHRR MODIS VIIRSProvides daily high-resolution imagery and radiometry across the visible to long-wave infrared spectrum
SBUV-2 OMI OMPS Spectrometers with UV and IR bands for ozone total column measurements
ERBE CERES CERES Scanning radiometer which supports studies of Earth Radiation Budget

5
Schedule
5Joint Polar Satellite System
2011 2012 2013 2014 2015 2016 2017 2018 2019 2020 2021 2022 2023 2024 2025 2026
MetOp-A
MetOp-B
MetOp-C
EPS-SG
NOAA-19
NPP
JPSS-1
JPSS-2
GCOM W-1
Free-Flyer

6
2 < 6 >
JPSS System Architecture
•Algorithm Support• Integrated Support Facility•Algorithm Support• Integrated Support Facility
Offline SupportOffline Support•Calibration/Validation•Calibration/Validation
NPOESSPreparatoryProject
DWSS1730
GPSSupporting Space
White SandsComplex
JPSS1330
TDRSS
NAVO
NESDIS
Command, Control & Communication Segment
Field Terminal Segment
Mission DataMission Data
15 Globally Distributed Receptor sitesInterconnected by Commercial Fiber
SpaceSegment
AlternateMMC
FNMOC
AFWA
MissionManagement
Center (MMC)
HRDLRD
EELV
LaunchSupportSegment
VAFBVAFB
CLASSCLASS SDSSDS
FNMOCFNMOC AFWAAFWA
Ingest Ingest Ingest
Weather Centrals
Processing Processing Processing Processing
NAVONAVO
Processing
Ingest
Data Delivery
DataManagement
NESDISNESDIS
DQM
Data Delivery Data Delivery Data Delivery
Interface Data Processing Segment
DataManagement
DataManagement
DataManagement
SvalbardPrimary T&C
TDRSS Weather / Climate Products
NDE
Functional Scope: The NESDIS Central
xDRs
NPPStatus
NOAA Satellite Operations Facility (NSOF) Suitland, MD
NOAA Environmental Satellite Processing
Center (ESPC)
JPSSMission
Management Center (MMC)
JPSSMission
Management Center (MMC)
NOAA
End-users(NWS, NOS,
OAR, & external users)
End-users(NWS, NOS,
OAR, & external users)
xDRs
NOAA-UniqueProducts
Tailored Products
Long-TermArchive (CLASS)
Long-TermArchive (CLASS)
NOAA-UniqueProducts
ProductProcessing
Components
UserServicesRequest/Response
xDRs
xDR SubscriptionRequests
Data Delivery Reports
Algorithm DevelopmentJPSS
InterfaceData
ProcessingSegment(IDPS)
JPSSInterface
Data ProcessingSegment(IDPS)
WorkRequest/
Status
NOAANPPData
Exploitation(NDE)
NASAScience
Data Segment
(SDS)
NASAScience
Data Segment
(SDS)
xDRs
Office of Satellite & Product Operations (OSPO) will provide common services:
• Data Center Operations
• Telecommunications
• User Services (Help Desk)
• Config. Management
• Security Controls
• Distribution
• Ingest

NDEDirect Readout Stations using Xband

9
IDPS EDRs
9Joint Polar Satellite System
CLOUD LIQUID WATERPRECIPITATION TYPE/RATEPRECIPITABLE WATERSEA SURFACE WINDS SPEEDSOIL MOISTURESNOW WATER EQUIVALENT
IMAGERYSEA ICE CHARACTERIZATIONSNOW COVER/DEPTHSEA SURFACE TEMPERATURESURFACE TYPE
GCOM AMSR-2 (11)
VIIRS (22)
ALBEDO (SURFACE)CLOUD BASE HEIGHTCLOUD COVER/LAYERSCLOUD EFFECTIVE PART SIZECLOUD OPTICAL THICKNESSCLOUD TOP HEIGHTCLOUD TOP PRESSURECLOUD TOP TEMPERATUREICE SURFACE TEMPERATURENET HEAT FLUX OCEAN COLOR/CHLOROPHYLL
SUSPENDED MATTERVEGETATION INDEXAEROSOL OPTICAL THICKNESSAEROSOL PARTICLE SIZEACTIVE FIRES
IMAGERYSEA ICE CHARACTERIZATIONSNOW COVERSEA SURFACE TEMPERATURELAND SURFACE TEMPSURFACE TYPE
CrIS/ATMS (3)ATM VERT MOIST PROFILEATM VERT TEMP PROFILEPRESSURE (SURFACE/PROFILE)
OMPS (2)O3 TOTAL COLUMNO3 NADIR PROFILE
CERES (4)DOWN LW RADIATION (SFC)DOWN SW RADIATION (SFC)NET SOLAR RADIATION (TOA)OUTGOING LW RADIATION (TOA)
TSIS (1)SOLAR IRRADIANCE
SARR &SARP
A-DCS
KEYEDRs with Key Performance Parameters
JPSS-1
GCOMJPSS Program(Host TBD)
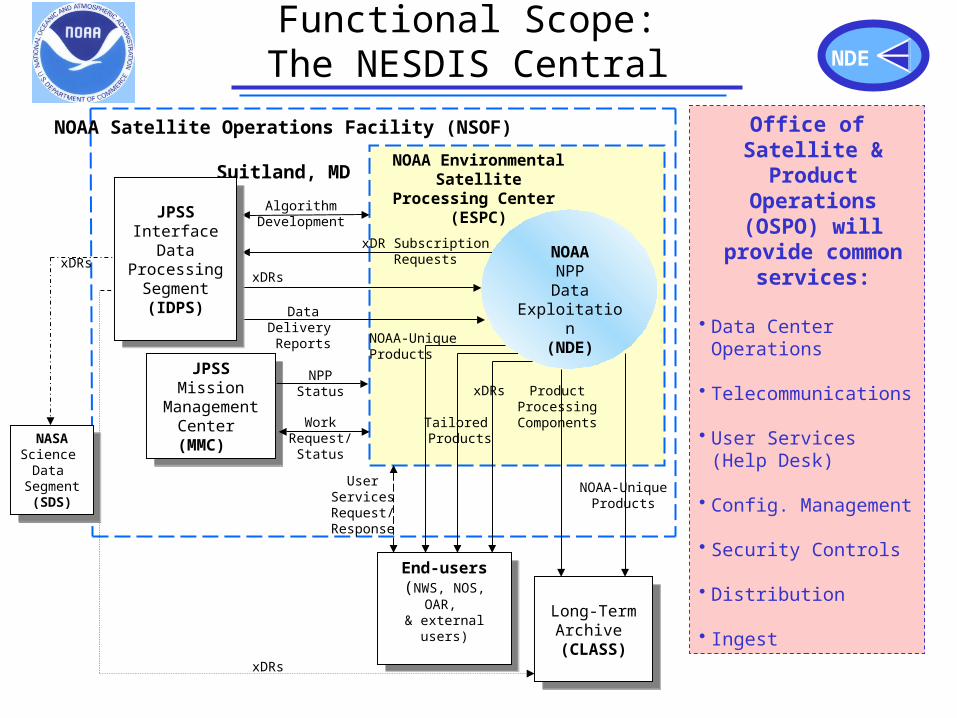
NDEJul 2012 Product Suite
• Products with NDE Operations Planning Dates• Assumes Oct 25, 2011 launch
10
ATMS Radiances Jul-12
ATMS Radiances (BUFR) Jul-12
CrIS Radiances Jul-12
CrIS Radiances (BUFR) Jul-12
VIIRS Radiances Jul-12
VIIRS Radiances (BUFR) Jul-12
VIIRS Imagery Jul-12
Blue – IDPSYellow - NDE

NDESep – Dec 2012 Product Suite
• Products with NDE Operations Planning Dates
11
OMPS Radiances Sep-12
Polar Winds (VIIRS BUFR) Oct-12
Rainfall Rate (ATMS) Oct-12
Total Precipitable Water (ATMS) Oct-12
Snow Cover (ATMS) Oct-12
Land Surface Emissivity (ATMS) Oct-12
Temperature Profiles (ATMS) Oct-12
Moisture Profiles (ATMS) Oct-12
Cloud Liquid Water (ATMS) Oct-12
Sea Ice Concentration (ATMS) Oct-12
Snow Water Equivalent (ATMS) Oct-12
Ice Water Path (ATMS) Oct-12
Land Surface Temperature (ATMS) Oct-12
Rain Water Path (ATMS) Oct-12
Green Vegetation Fraction Dec-12
Ozone Limb Profile Radiances Dec-12

NDEJan – Feb 2013 Product Suite
12
Aerosol Optical Depth (AVHRR-like) Jan-13Atmospheric Moisture Profile (CrIS/ATMS) Jan-13Atmospheric Temperature Profile (CrIS/ATMS) Jan-13Clear Sky Brightness Temperatures Jan-13Cloud Top Fraction (CrIS) Jan-13Cloud Top Pressure (CrIS) Jan-13CO2 Slicing Derived Cloud Top Pressure (CrIS) [New]
Jan-13
CrIS Cloud Cleared Radiances Jan-13Ocean Optimized Cloud Mask Jan-13Ozone (CrIS) Jan-13Sea Surface Temperature (SST) Jan-13Sea Surface Temperature (SST) (BUFR) Jan-13SST (AVHRR-like) Jan-13Stability Products (CrIS) Jan-13Trace Gases (Carbon Dioxide, Methane, Sulfur Dioxide)
Jan-13
Blended Rain Rate Feb-13Blended SST (Imagery) Feb-13Blended Total Precipitable Water Feb-13Blended Total Precipitable Water Anomaly Feb-13Coral Reef Bleaching Indices/Alerts Feb-13SST Anomalies Feb-13SST Degree Heating Weeks Feb-13SST Hot Spots Feb-13

NDEApril 2013 Product Suite
13
Active Fires Apr-13Aerosol Optical Thickness Apr-13Aerosol Optical Thickness (BUFR) Apr-13Aerosol Particle Size Apr-13Atmospheric Moisture Profile Apr-13Atmospheric Pressure Profile [New] Apr-13Atmospheric Temperature Profile Apr-13Cloud Base Height [New] Apr-13Cloud Cover/Layers Apr-13Cloud Effective Particle Size Apr-13Cloud Mask Apr-13Cloud Optical Thickness Apr-13Cloud Top Height (VIIRS) Apr-13Cloud Top Pressure Apr-13Cloud Top Temperature Apr-13Ice Surface Temperature [New] Apr-13Land Surface Temperature (VIIRS) [New] Apr-13Land Surface Type Apr-13Nadir Profile Ozone Apr-13Ocean Color/Chlorophyll Apr-13
Ozone (BUFR) Apr-13
Ozone Total Column Apr-13
Quarterly Surface Type Gridded [New] Apr-13
Sea Ice Characterization (VIIRS) Apr-13
Snow Cover Apr-13
Surface Albedo Apr-13
Suspended Matter [New] Apr-13
Vegetation Index Apr-13

NDEJun 2013 – Sep 2014 Product Suite
14
Aerosol Optical Depth (OMPS LP) Jun-13Blended Ozone Jun-13Blended Snow Cover Jun-13Ozone Profile (OMPS LP) Jul-13Tropical Cyclone Intensity Aug-13AMSR-2 Radiances [New] Sep-13AMSR-2 SDR [New] Sep-13Fire & Smoke Analysis Sep-13Precipitable Water (GCOM) [New] Sep-13Precipitation (Type/Rate) GCOM [New] Sep-13Sea Ice Characterization (GCOM) [New] Sep-13Sea Surface Temperature (GCOM) [New] Sep-13Sea Surface Wind Speed (GCOM) [New] Sep-13Snow Cover/Depth (GCOM) [New] Sep-13Snow Water Equivalent (GCOM) [New] Sep-13Soil Moisture GCOM [New] Sep-13Surface Type (GCOM) [New] Sep-13Volcanic Ash [New] Sep-13
AMSR-2 Radiances (BUFR) [New] Dec-13
Chesapeake Bay Ocean Color [New] Mar-14
Chlorophyll a (5 tailored regions) [New] Mar-14
Emiliania huxleyi Bloom [New] Mar-14
Harmful Algal Bloom Anomaly [New] Mar-14
Near Coast Ocean Color (SWIR) [New] Mar-14
Normalized Water Leaving Radiances [New] Mar-14
Outgoing Longwave Radiation (CrIS) Jun-14
Blended Rain Rate (GCOM) [New] Sep-14
Blended Soil Moisture (GCOM) Sep-14
Blended SST (GCOM) [New] Sep-14
Blended Total Precipitable Water (GCOM) [New]
Sep-14
Blended Total Precipitable Water Anomaly (GCOM) [New]
Sep-14
Tropical Cyclone Intensity (GCOM) [New] Sep-14
Tropical Rainfall Potential Sep-14
Tropical Rainfall Potential (GCOM) [New] Sep-14

GOES-R vs JPSS IDPS Products• Aerosol Detection (including Smoke and
Dust) • Aerosol Particle Size• Suspended Matter / Optical Depth• Volcanic Ash Detection and Height• Aircraft Icing Threat • Cloud & Moisture Imagery (KPPs)• Cloud Layers / Heights & Thickness• Cloud Ice Water Path • Cloud Liquid Water• Cloud Optical Depth • Cloud Particle Size Distribution • Cloud Top Phase • Cloud Top Height• Cloud Top Pressure • Cloud Top Temperature • Cloud Type • Clear Sky Masks • Fire / Hot Spot Characterization • (red = baseline)
• Aerosol Optical Thickness• Aerosol Particle Size• Imagery • Cloud Base Height • Cloud Coverage/Layers• Cloud Effective Particle Size• Cloud Ice Water Path • Cloud Liquid Water• Cloud Mask (IP) • Cloud Optical Thickness• Cloud Top Height • Cloud Top Pressure • Cloud Top Temperature• Active Fires
Joint Polar Satellite System 15
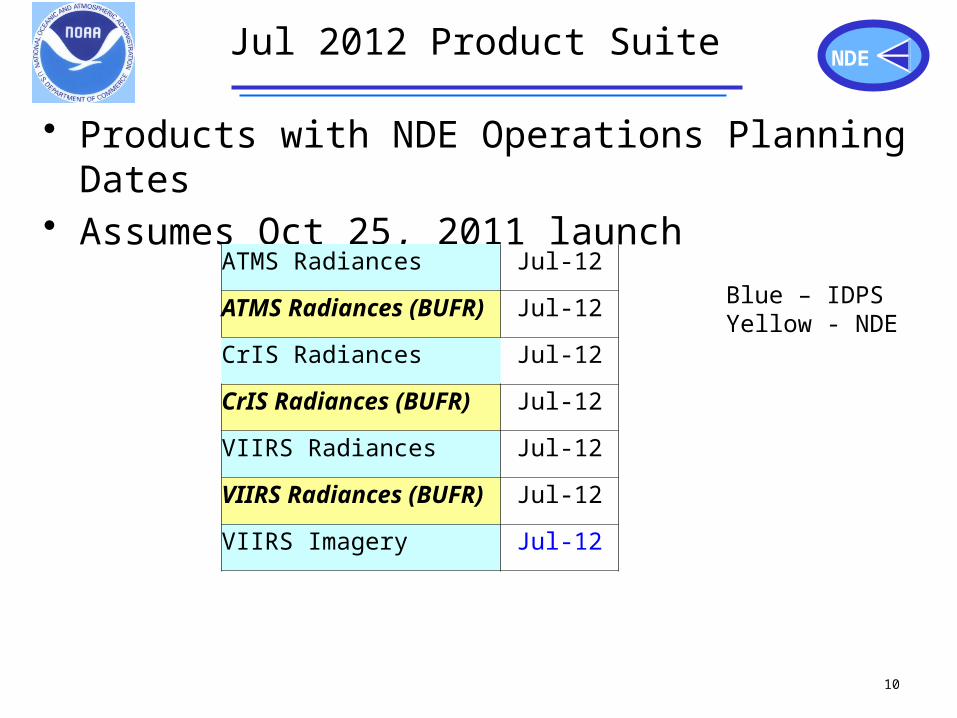
GOES-R vs JPSS Products• Probability of Rainfall• Rainfall Potential• Rainfall Rate / QPE• Legacy Atm. Vertical Moisture Profile • Legacy Atm. Vertical Temperature• Profile Derived Stability Indices (5)• Total Precipitable Water• Land Surface (Skin) Temperature• Surface Albedo• Surface Emissivity • Vegetation Fraction• Green Vegetation Index • Sea & Lake Ice / Age• Sea & Lake Ice / Concentration• Sea & Lake Ice / Extent • Sea & Lake Ice / Motion• Ice Cover / Landlocked: Hemispheric
Snow Cover • Snow Depth (Over Plains)• Sea Surface Temps
• Atmospheric Vertical Moisture Profile• Atmospheric Vertical Temperature Profile • Ozone Total • Column Ozone Profile • Land Surface Temperature • Albedo (Surface)• Vegetation Index• Sea Ice Concentration • Ice Surface Temperature • Snow Cover • Sea Surface Temperature• Ocean Color• Suspended Matter
Joint Polar Satellite System 16
17
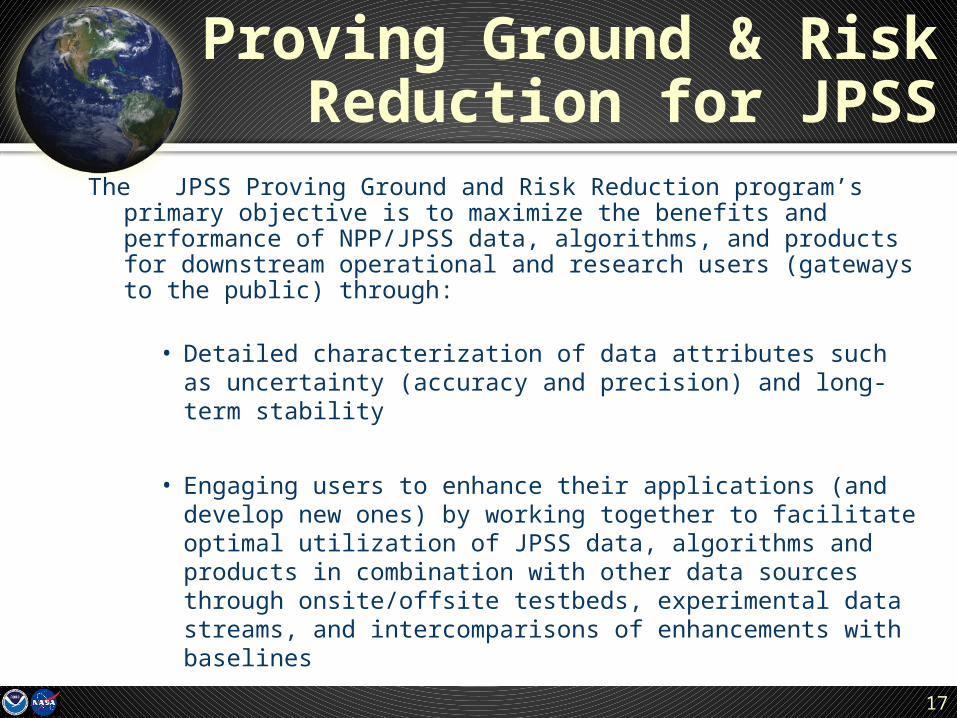
The JPSS Proving Ground and Risk Reduction program’s primary objective is to maximize the benefits and performance of NPP/JPSS data, algorithms, and products for downstream operational and research users (gateways to the public) through:
• Detailed characterization of data attributes such as uncertainty (accuracy and precision) and long-term stability
• Engaging users to enhance their applications (and develop new ones) by working together to facilitate optimal utilization of JPSS data, algorithms and products in combination with other data sources through onsite/offsite testbeds, experimental data streams, and intercomparisons of enhancements with baselines
• Education, Training and Outreach
• Facilitating transition of improvements (new algorithms/applications) to operations.
Proving Ground & Risk Reduction for JPSS

18
Call for proposals due Jan 20, 2012
Introduction Identify and describe end user application(s) and importance, and the benefit JPSS data can provide
Identify and describe any current limitation(s), requiring additional research and/or feedback to further realize this benefit.
Identify a user that will be engaged, and describe how you will engage the user, regularly, to understand JPSS products, provide test datasets and to obtain feedback.
Proposed Work and Technical Approach Describe methodology to use JPSS data (and other data sources, if necessary) to improve the identified user application.
Milestones and deliverables

19
Projects need to be supportive of NOAA Goals
20
21
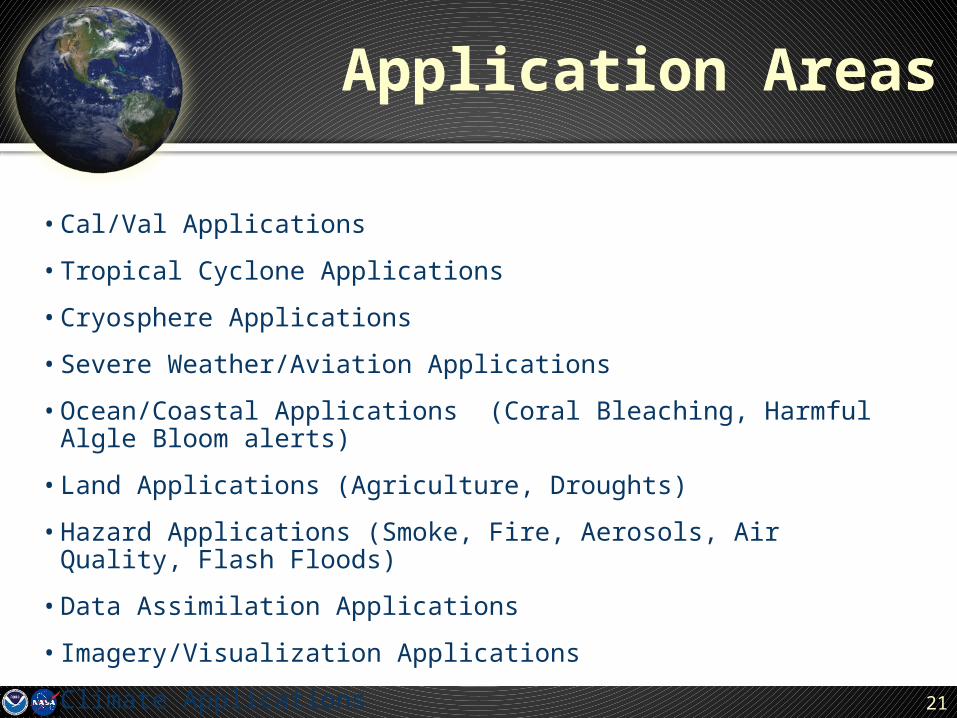
Application Areas
• Cal/Val Applications
• Tropical Cyclone Applications
• Cryosphere Applications
• Severe Weather/Aviation Applications
• Ocean/Coastal Applications (Coral Bleaching, Harmful Algle Bloom alerts)
• Land Applications (Agriculture, Droughts)
• Hazard Applications (Smoke, Fire, Aerosols, Air Quality, Flash Floods)
• Data Assimilation Applications
• Imagery/Visualization Applications
• Climate Applications
22
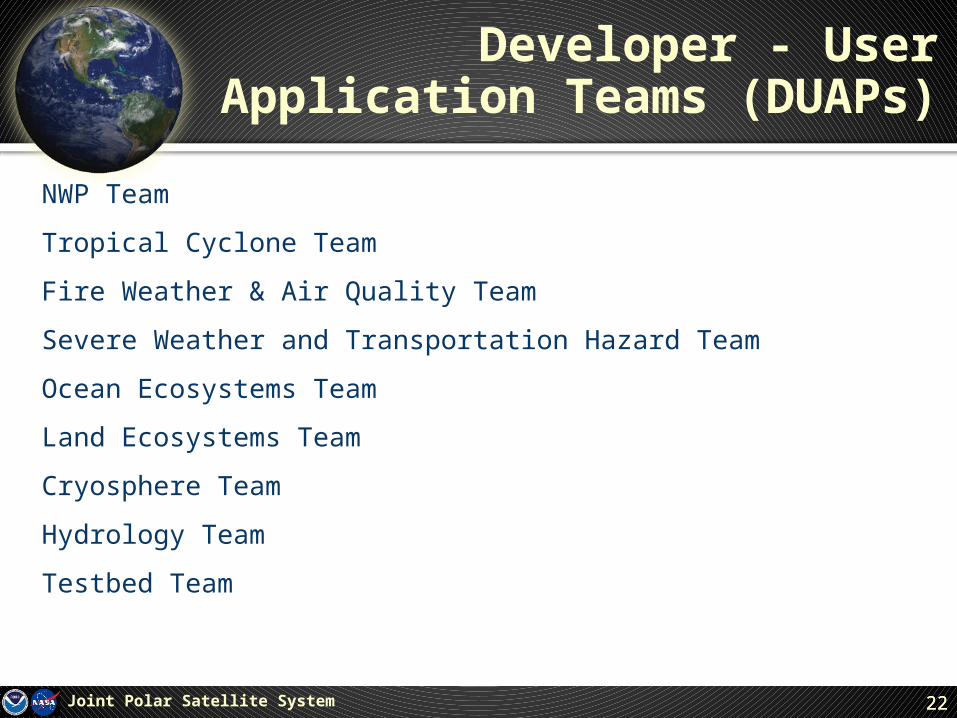
Developer - User Application Teams (DUAPs)
NWP Team
Tropical Cyclone Team
Fire Weather & Air Quality Team
Severe Weather and Transportation Hazard Team
Ocean Ecosystems Team
Land Ecosystems Team
Cryosphere Team
Hydrology Team
Testbed Team
Joint Polar Satellite System 22

23
Current Projects
Joint Polar Satellite System 23

24
JPSS Current Portfolio of User Engagement activities
• JCSDA CrIS/ATMS Radiance Assimilation Experiments
• POCs – Sid Boukabara (NOAA), Nancy Baker(NRL)• Outcome - Impact assessments and improved utilization of
radiances
• Alaska High Latitude Proving Ground• POC – Gary Hufford/Tom Heinrich• Outcome - Upgrade X-band receiver, generate NPP products,
forecaster training, product evaluation and feedback, compare operational products with alternative products using CSPP.
• Community Satellite Processing Package (CSPP)
• POC – Allen Huang/Liam Gumley• Outcome - Software package/testbed containing IDPS
algorithms and capability of alternative algorithms for intercomparisons
Joint Polar Satellite System 24
25
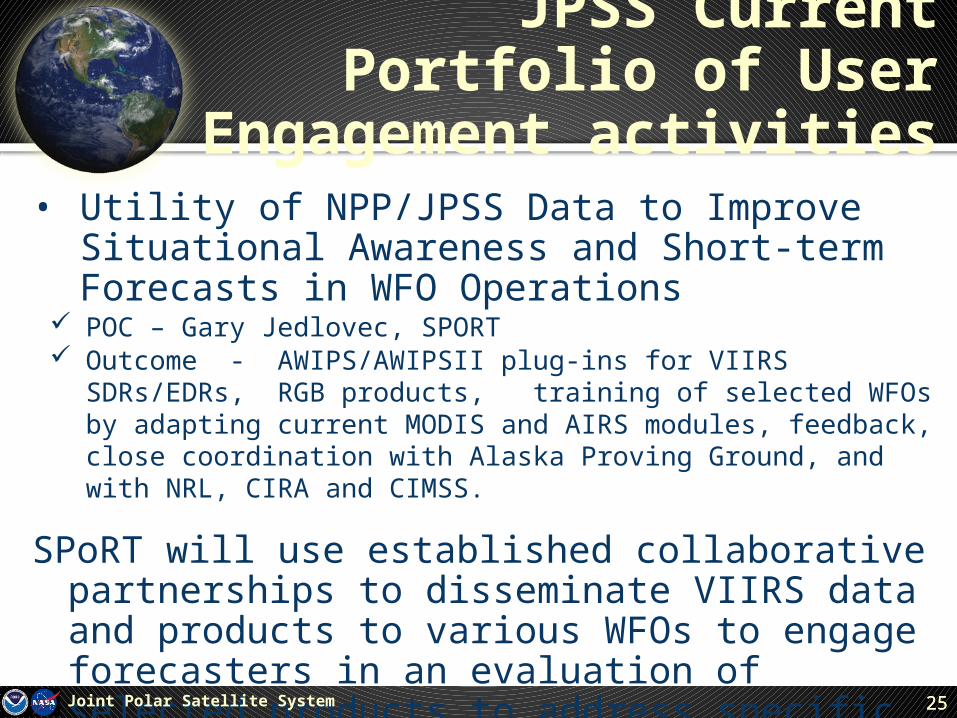
JPSS Current Portfolio of User Engagement activities
• Utility of NPP/JPSS Data to Improve Situational Awareness and Short-term Forecasts in WFO Operations
POC – Gary Jedlovec, SPORT Outcome - AWIPS/AWIPSII plug-ins for VIIRS SDRs/EDRs, RGB
products, training of selected WFOs by adapting current MODIS and AIRS modules, feedback, close coordination with Alaska Proving Ground, and with NRL, CIRA and CIMSS.
SPoRT will use established collaborative partnerships to disseminate VIIRS data and products to various WFOs to engage forecasters in an evaluation of selected products to address specific forecast challenges. Joint Polar Satellite System 25

26
JPSS Current Portfolio of User Engagement activities
• Application of JPSS Imagers and Sounders to Tropical Cyclone Track & Intensity Forecasting
• POC – Mark DeMaria, John Knaff, Steve Miller• Users – Brennan, Beven (NHC), Fukada (JTWC)
• Outcome - VIIRS will improve center location, Soundings from CrIS and ATMS to improve intensity forecasting. Information used in existing operational statistical-dynamical intensity forecast model. Strong user engagement with forecasters at NHC and JTWC.
• NRL/CIRA NEXSAT VIIRS Imagery DemonstrationsJoint Polar Satellite System 26

27
Visible Infrared Imaging Radiometer SuiteRaytheon SAS El Segundo, Ca
Description
•Purpose: Global observations of land, ocean, & atmosphere parameters at high temporal resolution (~ daily)
•Predecessor Instruments: AVHRR, OLS, MODIS, SeaWiFS
•Approach: Multi-spectral scanning radiometer (22 bands between 0.4 µm and 12 µm) 12-bit quantization
•Swath width: 3000 km
Spatial Resolution
• 16 bands at 750m
• 5 bands at 325m
• DNB
VIIRS on NPP

28
VIIRS Data Products
Land• Active Fire • Land Surface Albedo• Land Surface Temperature• Ice Surface Temperature• Sea Ice Characterization• Snow Cover/Depth• Vegetation Index• Surface Type
Ocean• Sea Surface Temperature• Ocean Color/Chlorophyll
Imagery & Cloud• Imagery• Cloud Mask • Cloud Optical Thickness• Cloud Effective Particle Size
Parameter• Cloud Top Parameters• Cloud Base Height• Cloud Cover/Layers
Aerosol• Aerosol Optical Thickness• Aerosol Particle Size Parameter• Suspended Matter
29
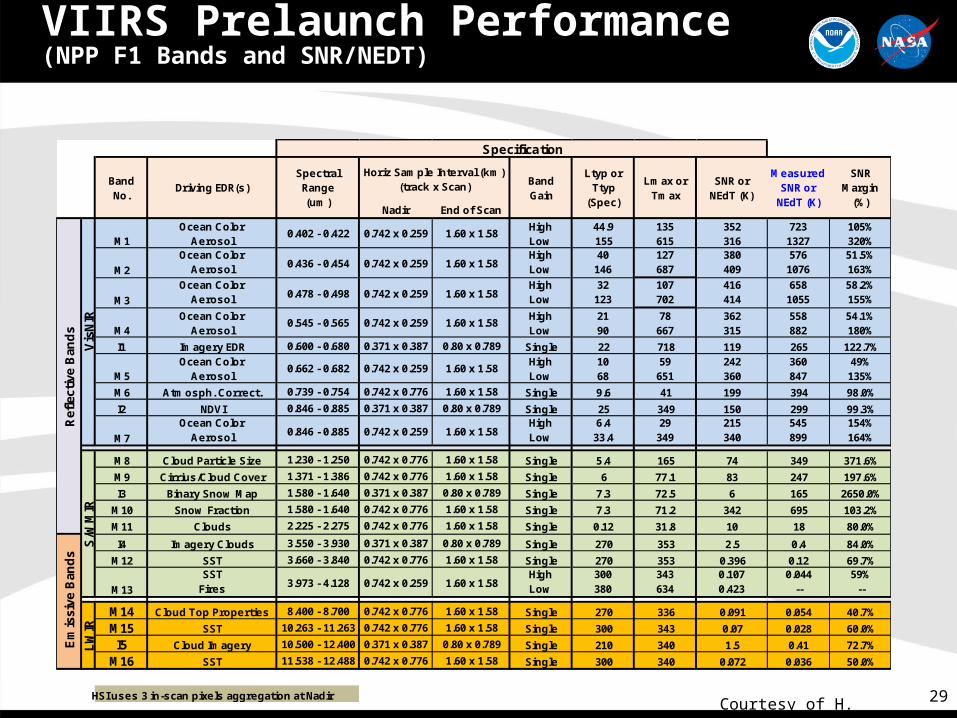
VIIRS Prelaunch Performance(NPP F1 Bands and SNR/NEDT)
Nadir End of Scan
M1Ocean Color
Aerosol0.402 - 0.422 0.742 x 0.259 1.60 x 1.58
HighLow
44.9155
135615
352316
7231327
105%320%
M2
Ocean ColorAerosol 0.436 - 0.454 0.742 x 0.259 1.60 x 1.58
HighLow
40146
127687
380409
5761076
51.5%163%
M3
Ocean ColorAerosol 0.478 - 0.498 0.742 x 0.259 1.60 x 1.58
HighLow
32123
107702
416414
6581055
58.2%155%
M4Ocean Color
Aerosol0.545 - 0.565 0.742 x 0.259 1.60 x 1.58
HighLow
2190
78667
362315
558882
54.1%180%
I1 Imagery EDR 0.600 - 0.680 0.371 x 0.387 0.80 x 0.789 Single 22 718 119 265 122.7%
M5Ocean Color
Aerosol0.662 - 0.682 0.742 x 0.259 1.60 x 1.58
HighLow
1068
59651
242360
360847
49%135%
M6 Atmosph. Correct. 0.739 - 0.754 0.742 x 0.776 1.60 x 1.58 Single 9.6 41 199 394 98.0%
I2 NDVI 0.846 - 0.885 0.371 x 0.387 0.80 x 0.789 Single 25 349 150 299 99.3%
M7
Ocean ColorAerosol 0.846 - 0.885 0.742 x 0.259 1.60 x 1.58
HighLow
6.433.4
29349
215340
545899
154%164%
M8 Cloud Particle Size 1.230 - 1.250 0.742 x 0.776 1.60 x 1.58 Single 5.4 165 74 349 371.6%
M9 Cirrius/Cloud Cover 1.371 - 1.386 0.742 x 0.776 1.60 x 1.58 Single 6 77.1 83 247 197.6%
I3 Binary Snow Map 1.580 - 1.640 0.371 x 0.387 0.80 x 0.789 Single 7.3 72.5 6 165 2650.0%
M10 Snow Fraction 1.580 - 1.640 0.742 x 0.776 1.60 x 1.58 Single 7.3 71.2 342 695 103.2%
M11 Clouds 2.225 - 2.275 0.742 x 0.776 1.60 x 1.58 Single 0.12 31.8 10 18 80.0%
I4 Imagery Clouds 3.550 - 3.930 0.371 x 0.387 0.80 x 0.789 Single 270 353 2.5 0.4 84.0%
M12 SST 3.660 - 3.840 0.742 x 0.776 1.60 x 1.58 Single 270 353 0.396 0.12 69.7%
M13
SSTFires 3.973 - 4.128 0.742 x 0.259 1.60 x 1.58
HighLow
300380
343634
0.1070.423
0.044--
59%--
M14 Cloud Top Properties 8.400 - 8.700 0.742 x 0.776 1.60 x 1.58 Single 270 336 0.091 0.054 40.7%
M15 SST 10.263 - 11.263 0.742 x 0.776 1.60 x 1.58 Single 300 343 0.07 0.028 60.0%
I5 Cloud Imagery 10.500 - 12.400 0.371 x 0.387 0.80 x 0.789 Single 210 340 1.5 0.41 72.7%
M16 SST 11.538 - 12.488 0.742 x 0.776 1.60 x 1.58 Single 300 340 0.072 0.036 50.0%
HSI uses 3 in-scan pixels aggregation at Nadir
Specification
Vis
NIR
S/W
MIR
LW
IR
Ref
lect
ive
Ban
ds
Em
issi
ve B
and
s
Horiz Sample Interval (km)(track x Scan)Band
No.
SpectralRange(um)
Driving EDR(s)SNR or
NEdT (K)BandGain
Ltyp orTtyp
(Spec)
Lmax orTmax
MeasuredSNR or
NEdT (K)
SNR Margin
(%)
Courtesy of H. Oudrari

30
Band Range (um) HSR (m) Band Range HSR Band Range HSR Band Range HSR
DNB 0.500 - 0.900 750HRD PMT
0.580 - 0.910 0.510 - 0.860
550 2700
M1 0.402 - 0.422 750 8 0.405 - 0.420 1000
M2 0.436 - 0.454 750 9 0.438 - 0.448 1000
M3 0.478 - 0.498 7503
100.459 - 0.479 0.483 - 0.493
500 1000
M4 0.545 - 0.565 750 4 120.545 - 0.565 0.546 - 0.556
500 1000
I1 0.600 - 0.680 375 1 0.620 - 0.670 250 1 0.572 - 0.703 1100
M5 0.662 - 0.682 75013 14
0.662 - 0.672 0.673 - 0.683
1000 1000 1 0.572 - 0.703 1100
M6 0.739 - 0.754 750 15 0.743 - 0.753 1000
I2 0.846 - 0.885 375 2 0.841 - 0.876 250 2 0.720 - 1.000 1100
M7 0.846 - 0.885 750 16 0.862 - 0.877 1000 2 0.720 - 1.000 1100
M8 1.230 - 1.250 750 5 SAME 500
M9 1.371 - 1.386 750 26 1.360 - 1.390 1000
I3 1.580 - 1.640 375 6 1.628 - 1.652 500
M10 1.580 - 1.640 750 6 1.628 - 1.652 500 3a SAME 1100
M11 2.225 - 2.275 750 7 2.105 - 2.155 500
I4 3.550 - 3.930 375 20 3.660 - 3.840 1000 3b SAME 1100
M12 3.660 - 3.840 750 20 SAME 1000 3b 3.550 - 3.930 1100
M13 3.973 - 4.128 75021 22
23
3.929 - 3.989 3.929 - 3.989 4.020 - 4.080
1000 1000 1000
M14 8.400 - 8.700 750 29 SAME 1000
M15 10.263 - 11.263 750 31 10.780 - 11.280 1000 4 10.300 - 11.300 1100
I5 10.500 - 12.400 375 31 3210.780 - 11.280 11.770 - 12.270
1000 10004 5
10.300 - 11.300 11.500 - 12.500
1100 1100
HRD 10.300 - 12.900 550
M16 11.538 - 12.488 750 32 11.770 - 12.270 1000 5 11.500 - 12.500 1100
OLS EquivalentMODIS Equivalent AVHRR-3 Equivalent
Ocean Color, Aerosol
Thin Cirrus
Atm Correction
Cloud Particle Size
Snow Map
Cloud
SST, Fire
Cloud Top Propoerties
Low light capabilities
VIIRS
VIIRS Improvements From AVHRR: Radiometric properties
Greater spectral coverage with increased radiometric quality

31
AVHRR
1 580 - 6802 840 - 9403 3.55 - 3.934 10.3 - 11.35 11.5 - 12.5
MODIS8 405 - 4209 438 - 44810 483 - 49312 546 - 5561 620 - 67013 662 - 67215 743 - 75316 862 - 8772 841 - 8775 1.23 - 1.25 26 1.36 - 1.396 1.63 - 1.657 2.11 - 2.1620 3.66 - 3.8423 4.02 - 4.0829 8.40 - 8.7031 10.78 - 11.2832 11.77 - 12.2733 13.2 – 13.534 13.5 – 13.835 13.8 – 14.136 14.1 – 14.4
VIIRSM1 402 – 422 (750m)M2 436 - 464M3 478 - 498 M4 545 - 565 I1 580 – 680 (375m)M5 662 - 682M6 744 - 758M7 845 - 885I2 845 - 885M8 1.23 - 1.25M9 1.371 - 1.385M10 1.58 - 1.64I3 1.58 - 1.64M11 2.235 - 2.285M12 3.61 - 3.79I4 3.55 - 3.93M13 3.97 - 4.13M14 8.40 - 8.7M15 10.3 - 11.3M16 11.5 - 12.5I5 10.6 - 12.5
Spectral bands
of polar imagers(nm or
um)
ABI1 450 – 490 (1km)2 590 – 690 (.5)3 846 – 885 (1)4 1.37-1.39 (2)5 1.58 - 1.64 (1)6 2.23 – 2.28 (2)7 3.8 – 4.08 5.77 – 6.69 6.75 – 7.1510 7.24 – 7.4411 8.3 – 8.712 9.42 – 9.813 10.1 – 10.614 10.8 – 11.615 11.8 – 12.816 13.0 – 13.6

DNB M1 M2 M3 M4 I1 M5 M6 M7 I2 M8 M9 M10 I3 M11 M12 I4 M13 M14 M15 I5 M16 Wavelength (um) 0.7 0.412 0.445 0.488 0.555 0.64 0.672 0.746 0.865 0.865 1.24 1.378 1.61 1.61 2.25 3.7 3.74 4.05 8.55 10.76 11.45 12.01
1 Imagery x x x x x x x x x x x x x x x x x x x x x2 Sea Surface Temp x x x3 Soil Moisture Uses VCM, VIIRS LST and several CMIS products, but no SDRs4 Cloud Base Height x x x x x x x x5 Cloud cover/Layers x x x x x x x x6 Cloud Optical Part Size x x x x x x x7 Cloud Thickness x x x x x x x8 Cloud Top Height x x x x x x x x9 Cloud Top Pressure x x x x x x x x10 Cloud Top Temp x x x x x x x x11 Land Surface Temp. x x x x12 Active Fires x x x x x x13 Vegetation Index x x x14 Snow Cover (Binary) x x x x x x15 Snow Cover (Fraction) x x x x x x x16 Surface Type x x x x x x x x x x x x x x x x17 Surface Albedo x x x x x x x x x18 Ice Surface Temp. x x19 Net Heat Flux Uses VCM and other VIIRS EDRs, but no SDRs20 Surface Temperature (IP) x x x21 Ocean Color / Chloro x x x x x x x22 Sea Ice Age x x x x x23 Aer Opt Thick (Ocean) x x x x x x x x x x24 Aer Opt Thick (Land) x x x x x x x x x25 Aer Part Size (Ocean) Uses AOT, but no SDRs26 Aer Part Size (Land) Uses AOT, but no SDRs27 Suspended Matter x x x28 Total Prec Water x x x x x29 Cloud Mask (IP) x x x x x x x x x x x x x x x30 Ice Location/Conc. (IP) Imagery Application is not required to be delivered.x x x x x31 Sfc Reflectance (IP) x x x x x x x x x x x x
Ocean Dual Gain Bands: M1-M5, M7, M13 VIS NIR SWIR MWIR LWIRLand
AerosolClouds
Ice and Snow x Denotes bands that are Not primary inputs into algorithm. Used as internal check for algorithm.
33
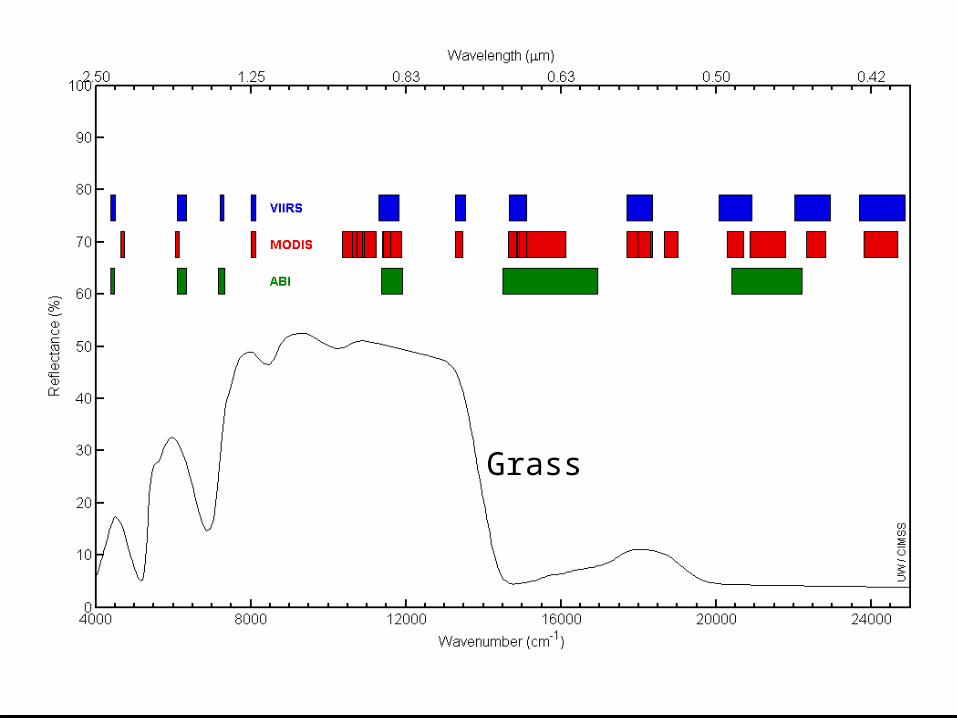
Grass

34

35
First Global VIIRS Image
VIIRS

VIIRS has a very large cross track and near constant spatial resolution

Colorado11.24.2011 1845 Z, Near Edge of Scan 11.24.2011 2028 UTC, Near Nadir
VIIRS maintains similar spatial resolution quality at edge of 3000 km swath
NPP VIIRS True Color Examples

Edge of Scan Intercomparisons
NPP VIIRS True Color Examples
Aqua MODIS 11-24-11 1840Z
NOAA-19 AVHRR 11-24-11 2000Z
NPP VIIRS 11-24-11 1845Z
NOAA-19 AVHRR 11-24-11 2000Z
NPP VIIRS 11-24-11 1845Z

NPP VIIRS DNB Example

Simulated Satellite Orbits
Gray Shading = solar zenith angle, Red Line = solar terminatorBlue Shading = lunar zenith angle, Blue Line = lunar terminator
~ 40% of nighttime observations offer lunar illumination sufficient to enable many environmental applications, including the following...
Moonlight Availability5-Year (2011-2015) Statistics
(Example)

Actively Burning Wild Fires
41
Conventional 3.9 µm tells us where hot spots are located, but including low-light visible tells us the subset of those areas that are actively flaming (discriminating from smoldering areas).
Witch CreekFire
HarrisFire
Buckweed FireRanch Fire
Ensenada Fire
10/22/2007California
Mexico
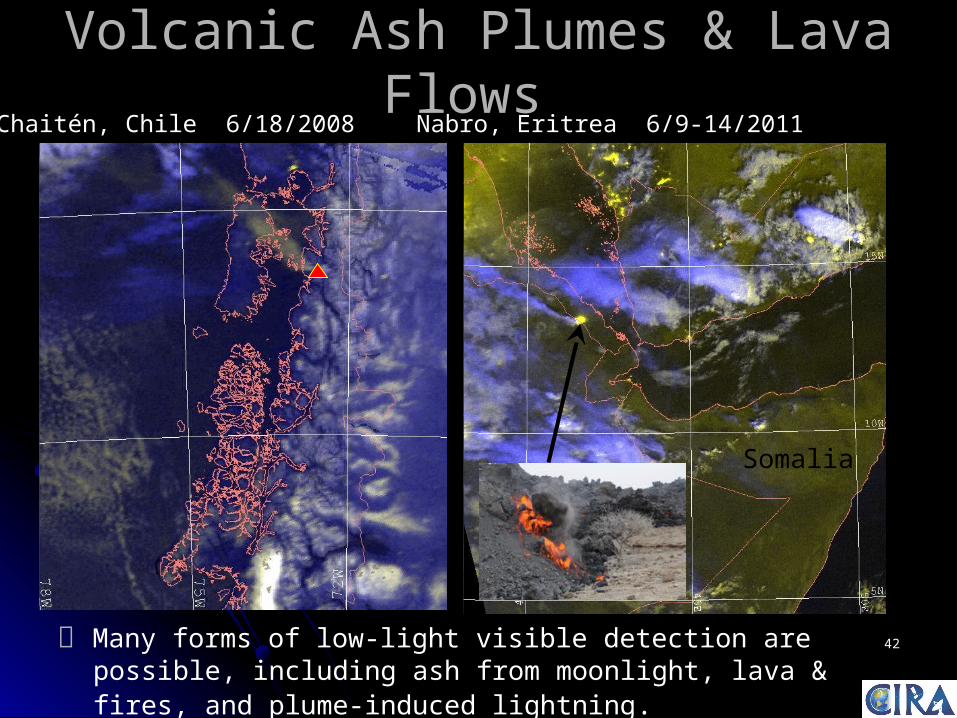
Volcanic Ash Plumes & Lava Flows
Many forms of low-light visible detection are possible, including ash from moonlight, lava & fires, and plume-induced lightning.
Nabro, Eritrea 6/9-14/2011
Somalia
Chaitén, Chile 6/18/2008
42

43
Conclusions
JPSS Mission will provide:
Input Observations for Weather Forecast ModelsCrIS, ATMS, VIIRS, OMPS & GCOM
Short term Environmental Observations (Events)VIIRS, OMPS, CrIS, ATMS & GCOM
Long term Environmental Observations (Climate Change Detection)CERES, TSIS, VIIRS, OMPS, CrIS, ATMS & GCOM
User Engagement is critical for ultimate mission success