1 Introduction - SciELO · of car, and buying the same brand of washing powder are typical examples...
16
SAJEMS NS 11 (2008) No 1 69 A STUDY OF CUSTOMER COMMITMENT THROUGH THE USE OF THE CONVERSION MODEL IN THE SOUTH AFRICAN MOTOR VEHICLE INDUSTRY Nic S Terblanche Dept of Business Management, University of Stellenbosch Abstract Consumer markets have become increasingly competitive. Numerous measures to gauge and predict loyalty and commitment have been developed to assist management in this respect. The marketing literature contains many examples illustrating that longer relationships achieve customer retention, and have been rewarded with a considerable increase in customer net present value. Customer retention is undoubtedly a major contributor to profitability in the long term. Research shows that the most successful measures for achieving customer retention are customer delight, customer satisfaction and customer commitment. This study makes a closer exploration of customer commitment, as measured by the Conversion Model, in the South African motor vehicle industry. The findings highlight the commitment segments of the most popular motor vehicle brands in South Africa, as well the typical marketing strategies for managing the different commitment segments. JEL D12 1 Introduction Peter Drucker once declared that the customer is the one who determines what a business is, what it produces, and whether it will prosper (1973). In recent years, a great deal of research has been undertaken in the field of customer management. The research mentioned above focused on the assessment of approaches that can be used by firms to manage customers as key assets (Kumar, Lemon & Parasuraman, 2006: 87). Customer retention has become so important for businesses that it has been labeled the “Holy grail” of businesses (Coyles & Gokey, 2005: 101). The renewed interest in customer retention could have been triggered by the work of Dawkins and Reichheld (1990), who reported that a small increase in customer retention led to an increase in customer net present value of between 25-95 per cent across a broad spectrum of different business environments. However, other authors argue that the revenue growth and cost savings benefits of customer retention is industry-specific and is not available to firms that typically have a high turnover of customers and low exit barriers in highly competitive markets (Egan, 2000: 381-382; Pressey & Mathews, 2001: 280). Recently, Ang and Buttle presented a view contrary to that of these authors, namely that the focus on customer retention has led to a growing recognition that customers, like products, have a life-cycle that companies can attempt to manage. Customers are acquired, retained and can be grown in value over time (2006: 83). The importance of customer retention has become decisive for firms’ financial performance and survival. They have therefore been trying to understand customers’ “unpredictable behaviour” as far as longer-term relationships are concerned. Knox and Denison (2000), for instance, have suggested that the transition to impersonal, self-service systems may encourage consumers to become more fickle in their shopping behaviour.
Transcript of 1 Introduction - SciELO · of car, and buying the same brand of washing powder are typical examples...

SAJEMS NS 11 (2008) No 1 69
A study of customer commitment through the use of the conversion model in the south AfricAn
motor vehicle industry
Nic S Terblanche
Dept of Business Management, University of Stellenbosch
Abstract
Consumer markets have become increasingly competitive. Numerous measures to gauge and predict loyalty and commitment have been developed to assist management in this respect. The marketing literature contains many examples illustrating that longer relationships achieve customer retention, and have been rewarded with a considerable increase in customer net present value. Customer retention is undoubtedly a major contributor to profitability in the long term. Research shows that the most successful measures for achieving customer retention are customer delight, customer satisfaction and customer commitment. This study makes a closer exploration of customer commitment, as measured by the Conversion Model, in the South African motor vehicle industry. The findings highlight the commitment segments of the most popular motor vehicle brands in South Africa, as well the typical marketing strategies for managing the different commitment segments.
JEL D12
1 Introduction
Peter Drucker once declared that the customer is the one who determines what a business is, what it produces, and whether it will prosper (1973). In recent years, a great deal of research has been undertaken in the field of customer management. The research mentioned above focused on the assessment of approaches that can be used by firms to manage customers as key assets (Kumar, Lemon & Parasuraman, 2006: 87). Customer retention has become so important for businesses that it has been labeled the “Holy grail” of businesses (Coyles & Gokey, 2005: 101). The renewed interest in customer retention could have been triggered by the work of Dawkins and Reichheld (1990), who reported that a small increase in customer retention led to an increase in customer net present value of between 25-95 per cent across a broad spectrum of different business environments. However, other authors argue that the revenue growth
and cost savings benefits of customer retention is industry-specific and is not available to firms that typically have a high turnover of customers and low exit barriers in highly competitive markets (Egan, 2000: 381-382; Pressey & Mathews, 2001: 280). Recently, Ang and Buttle presented a view contrary to that of these authors, namely that the focus on customer retention has led to a growing recognition that customers, like products, have a life-cycle that companies can attempt to manage. Customers are acquired, retained and can be grown in value over time (2006: 83).
The importance of customer retention has become decisive for firms’ financial performance and survival. They have therefore been trying to understand customers’ “unpredictable behaviour” as far as longer-term relationships are concerned. Knox and Denison (2000), for instance, have suggested that the transition to impersonal, self-service systems may encourage consumers to become more fickle in their shopping behaviour.
70 SAJEMS NS 11 (2008) No 1
2 Structure of the article
The rest of the article consists of nine major sections. The first section presents an overview of the advantages of customer retention. This is followed by a brief discussion of customer delight, customer satisfaction and customer commitment as means of achieving customer retention. Thereafter, customer commitment, the focus of the article, is examined in more detail. The next two sections deal with the purpose and objectives of the study and the theory and practical application of the Conversion Model to assess and manage customer commitment. Then follow sections on the methodology and the empirical findings. The article concludes with managerial implications and limitations of the study.
3 Advantages of customer retention
Several streams of research have focused on customer retention. These suggest that customer retention leads to reduced sales and marketing costs on the one hand, and an increase in the opportunities for cross-selling of products and services and positive word of mouth by customers on the other (Grönroos, 1990; Reichheld, 1996; Kent & Löfmarck Vaghult, 2000; Wirtz & Lihotzky, 2003). Various studies specifically focused on customer retention as a very important contributor to profitability in the long term (Anderson & Sullivan, 1993; Fornell, 1992; Iniesta & Sánchez, 2002; Heskett, Sasser & Schlesinger, 1997; Heskett, 2002; Dick & Basu, 1994; Anderson, Fornell & Lehmann, 1994).
The advantages of longer relationships to enhancing customer retention and marketing productivity have been addressed by various authors. These longer relationships create interdependencies that result in reduced transaction costs and produce higher quality, while keeping governance costs lower than exchange marketing (Sheth & Sisodia, 1995; Heide & John, 1992; Williamson, 1985; Heskett, Sasser & Schlesinger, 1997; Palmatier, Dant, Grewal & Evans, 2006). The creation of long-
term relationships has also prompted a certain degree of deliberation amongst academics and practitioners. Customer delight, customer satisfaction and customer commitment are some of the strategies that have been regarded as essential to the creation of extended-term relationships with the eventual aim of achieving customer retention and loyalty.
4 Customer delight, customer satisfaction and customer
commitment as means of achieving customer retention
The strategies of customer delight, customer satisfaction and customer commitment have been discussed at length in the academic literature (Rust & Oliver, 2000; Szymanski & Henard, 2001; Gounaris, 2005; Bansal, Irving & Taylor, 2004; Auh & Johnson, 2005). What constitutes the best measure of customer retention is still open to deliberation. Three constructs related to customer retention, namely, satisfaction, loyalty and commitment, have enjoyed wide coverage in academic journals during the past fifteen years (Oliver, 1999; Auh & Johnson, 2005; Wetzels, de Ruyter & van Birgelen, 1998). The relationships between satisfaction and loyalty and between satisfaction and commitment, in particular, have received a great deal of attention in academic literature (Oliver, 1999; Clerfeuille & Poubanne, 2003). Various authors have also conceptualised and operationalised customer retention as a dimension of the loyalty construct (Boulding, Kalra, Staelin & Zeithaml, 1993; Zeithaml, Berry & Parasuraman, 1996).
Customer delight is not suitable as a long-term strategy for retaining customers. The reason for this is obvious. Each time a customer experiences delight, there is a higher expectation of the next experience. Later expectations reach levels impossible for a firm to satisfy. Not all high satisfaction levels necessarily convert into continuous future patronage (Jones & Sasser, 1995). Hall (2001) presented some compelling statistics showing that it is possible for current high satisfaction levels in the motor vehicle industry to be experienced as the opposite

SAJEMS NS 11 (2008) No 1 71
when a new motor vehicle is purchased. McCarthy (1997: 13) reported a similar finding concerning Xerox customers; highly satisfied Xerox customers did not always buy again from Xerox. It has been stated that “satisfaction alone provides scant information about how customers will respond to competitive offers, product availability, price competition, or even product failure” (Hess & Story, 2005: 313). Nevertheless, Hess and Story (2005: 315) conclude that satisfaction provides the conditions necessary for commitment. Ganeson (1994) and Abdul-Muhmin (2002: 645) maintain that satisfaction leads to commitment. Similarly, Dimitriades (2006: 796) and Wetzels, de Ruyter and van Birgelen (1998: 416-418) confirm that satisfaction has a direct and positive effect on commitment. The conclusion to be drawn from this is that satisfaction is an antecedent of commitment. In its role as an antecedent of commitment, satisfaction thus has an indirect positive effect on customer retention. This article focuses on the measurement of customer commitment as a means of assessing customer retention. It also deals with the measurement of customer commitment as a means of assessing customer retention. The Conversion Model (CM) is used to measure customer commitment.
5 Customer commitment
There have been numerous attempts to define commitment. It is relevant to consider some of these definitions, as they allow insight into the complexity and the various features of commitment. In earlier research, Scanzoni (1979: 87) identified commitment as the fourth phase in relationship building, and observed that it consisted of three measurable conditions, namely, inputs, durability and consistency. Inputs consist of important resources being exchanged; desirability refers to association over time between the parties concerned, whilst consistency means the extent of inputs made to maintain the association. Dwyer, Schurr and Oh (1987: 19) defined commitment as “an implicit or explicit pledge of relational continuity between exchange partners”. According to
Dwyer et al. (1987: 23), commitment implies a willingness to make short-term sacrifices to realise longer-term benefits. Commitment embodies the highest stage of relational bonding, and conforms to Scanzoni’s three criteria for defining commitment.
In their seminal work of 1994, Morgan and Hunt found that commitment is central to all the relational exchanges between a firm and its partners (1994: 23). Following an extensive literature review and an empirical study, they also determined (1994: 25) that co-operation arises directly from relationship commitment.
It has also been observed that commitment is comprised of the following three components: an input or instrumental component (which represents some form of investment), an attitudinal component (which suggests a behavioural intention) and a temporal dimension (Gundlach et al., 1995: 79). The temporal dimension refers to the time-scale of relationships or the partners’ desire for relationships to continue over time.
Morgan and Hunt (1994: 23) defined commitment as “the belief of an exchange partner that the ongoing relationship with another is so important as to warrant maximum efforts at maintaining it”. This definition has much in common with that of Moorman, Zaltman and Despande (1992: 316), who define commitment as “an enduring desire to maintain a valued relationship”. It can thus be concluded that the words “enduring desire to maintain” point to the shared conviction that a committed partner would prefer the relationship to last for an indefinite period and would therefore be willing to put in some effort to nurture the relationship. The “valued relationship” concept argues that commitment will exist only if partners are of the same opinion concerning the importance of the relationship.
While Gounaris defined commitment as “the desire for continuity manifested by the willingness to invest resources into a relationship”, he also highlighted the existence of two types of commitment, namely affective and calculative commitment (2005: 127-128). The difference between affective and calculative commitment, originally identified by Mathieu and Zajac in 1990, stems from different
72 SAJEMS NS 11 (2008) No 1
motivations for maintaining a relationship. The motive for affective commitment appears to be a generalised sense of positive regard for and attachment to the other party. Calculative commitment, on the other hand, follows from an anticipation of high termination or switching costs associated with ending the relationship (Gounaris, 2005: 128).
The above-mentioned definitions of commit-ment share the following characteristics:
• All parties involved provide inputs.
• Commitment has a long-term orientation.
• Commitment has a psychological dimen-sion.
• The relationship is important to the parties, so they make efforts to maintain it.
To avoid possible confusion, there must be a distinction between loyalty and commitment at this point. Loyalty is, in essence, behavioural. Ceurvorst and Kitaeff (1996: 56) define loyalty as the continuous use or purchase of a brand, product or service. Continuing as a customer of a bank or airline, repurchasing the same brand of car, and buying the same brand of washing powder are typical examples of loyal behaviour. However, repetition of such behaviour does not automatically point to strong, absolute loyalty. Commitment, on the other hand, is psychological in nature. It is the power of the relationship between the individual and a brand, product, or service. The importance of the measurement of commitment to signify retention can be found in the fact that commitment can cease to exist long before it becomes evident in an individual's behaviour. In other words, a customer can become uncommitted to a brand of car long before being in the market for a new car. Similarly, a client can become uncommitted to a bank long before making a change.
Hofmeyr and Rice (2000: 80) identify the following three conditions as essential if an individual or customer is to be perfectly committed to something:
(1) They must be satisfied with a product or service;
(2) They must care about the relationship and see it as important;
(3) There is nothing else that appeals to them.
6 Purpose and objectives of the study
Very few studies on the effect of commitment on customer retention have been published to date (Bansal, Irving & Taylor, 2004; Garbarino & Johnson, 1999; Pritchard, Havitz & Howard, 1999; Bettencourt, 1997). This article hopes to make a contribution in this respect. During 2005 and 2006, the CM was used in a study of the fast food and motor vehicle industries in South Africa. The rationale for the selection of these two industries was that both are extremely competitive, while their products represent the two boundaries of low-involvement products (fast food) and high involvement products (motor vehicles). This article focuses on the application of the CM in the motor vehicle industry.
The primary objective of this study is to explore customer commitment, as measured by the CM, in the South African motor vehicle industry. A secondary purpose of the study is to report on the empirical findings in respect of the customer commitment segments for motor vehicle brands in South Africa. The latter will enable us to suggest and discuss the typical marketing strategies that could be followed in the different commitment segments.
7 The conversion model
This section deals with the theory underlying the CM, as well as how a practical application of the CM identifies various categories of consumers in terms of their commitment to a particular product or brand.
7.1 The theory underlying the CM
Shifts in attitudes, generally speaking, precede shifts in behaviour. A customer’s commitment level can therefore be recorded as an indicator of changes in behaviour. The CM theory initially emanated from three sources, namely cognitive and social psychology, catastrophe theory and religious conversion (Ceurvorst & Kitaeff, 1996: 58). Cognitive and social psychology theory serve as the basic foundation for the
SAJEMS NS 11 (2008) No 1 73
assumptions about the customers’ consumption decision-making behaviour. Customers are motivated by a wide range and intricate network of needs, values, hopes and desires. A further assumption is that consumer decision-making is driven by a consumer’s synthesis of assessments; that is, although consumers may contemplate numerous issues during the decision-making process, in the end they act in accordance “with a generalized impression about what is best”, and “it is usually easier for someone to provide a global rating of a product than to elucidate specific reasons for buying it” (Ceurvorst & Kitaeff, 1996: 58). Catastrophe theory provides the theoretical structure for the multifaceted relationships among the forces that create commitment. Catastrophe theory enables the explanation of the transformation of a system’s dynamic structure (in this instance, the interaction of various elements of a consumer). Ceurvorst & Kitaeff (1996: 60) point out that, in physics, as well as in mathematics and sociology, catastrophe theory describes “how and when equilibrium breaks down” because it is capable of coping with complex, discontinuous relationships between causes and effects. Brand-switching is a perfect example of discontinuity in consumers’ behaviour because they change their minds. The CM makes use of catastrophe theory to assess a customer’s “equilibrium” or stability with a brand, product, or service and to detect at what points that stability breaks down.
The CM measures the power of the psycho-logical relationship between individuals and all their choices about a brand in a market (Hofmeyr & Rice, 1995). Current users of a product/service are classified in terms of how committed they are to continued use of the brand, while non-users are graded in terms of their readiness to convert to a particular product/service. The allocation of the consumers to different commitment segments (illustrated in Figure 1) is done with an algorithm based on the mathematics of catastrophe theory (more specifically the butterfly cusp) (Rice & Bennett, 1998: 62). The allocation algorithm classifies respondents according to their responses on the four dimensions of satisfaction with the brand, the importance of the brand, the perception of alternatives and a respondents’
degree of ambivalence. Positive and negative outranking are applied to the responses to the items representing the four dimensions. The following example illustrates a customer in the entrenched segment: If the brand used by the respondent was ideal, the choice of that brand was extremely important (this means the respondent was involved in both the category and the brand), the respondent perceived the brand to be significantly better than any other brand on the market, and was very certain (that is, not ambivalent at all) about his or her brand choice, then the respondent would be classified as “entrenched” (Rice & Bennett, 1998: 62). In the extreme opposite position is the strongly unavailable segment consisting of non-users of a brand whose preference is unequivocally for their current choice. This is because either they are entrenched in their current brands, or, if they are open to others, the brand under study is not among them. It is not possible to provide all the possible permutations of the CM dimensions in this article, as the CM is a proprietary technique. It constructs a full overview of the psychological strength of a brand in its market and also produces a specific profile for a respondent. For each respondent, the CM produces a profile of the strength of the respondent’s psychological relationship with each brand in the market.
7.2 The CM categorisation of consumers in terms of their commitment
The CM measures the extent of a consumer’s level of commitment to a brand to make predictions about future brand loyalty. The CM employs four dimensions to measure levels of commitment. The first dimension of CM is the customer’s satisfaction with the brand. As discussed in section 4 and based on evidence provided by many researchers, satisfaction correlates poorly with future behaviour (Keaveney, 1995; Mittal & Lassar, 1998; Miranda, Kónya & Havrila, 2005; Andreassen & Lindestad, 1998). Understanding satisfaction enables us to understand consumers’ behaviour to some extent. Customer satisfaction falls short in two important areas. Firstly, it does not provide for the identification of customers who are at risk, and, secondly, it is unable to provide

74 SAJEMS NS 11 (2008) No 1
any light on non-customers (Richards, 1996: 52). Satisfaction remains, however, an essential element in our understanding of the relationship between customers and brands, and thus of customer retention. The second dimension is the way customers perceive alternative brands. The evaluation of a brand does not happen in isolation. It amounts to a comparison with all competing brands. However, a high satisfaction score does not indicate that the relationship between the customer and the brand is secure. The third dimension of CM is how important a particular brand is to a consumer. Where brand choice is not important, it will be hard to achieve commitment. Commitment can be achieved only if both the product category, as well as brand choice, is important to a customer. The underlying assumption is that the more important the brand choice is to the customer, the more time and effort will be needed before a brand is chosen. The fourth CM dimension is the degree of the consumer’s ambivalence about competing brands. The more ambivalent the customer, the greater the likelihood of the choice being delayed. Ambivalent consumers are influenced by point-of-purchase marketing stimuli, as they often decide on a particular brand only once they have reached the shop shelf.
The CM categorises consumers according to their level of commitment to a particular brand. Consequently, a consumer’s relationship with every brand in the market is identified. This information enables us to identify the relative attraction of all other brands when compared with those currently being used by consumers. Respondents are then divided into users and non-users, each according to the four segments (Hofmeyr & Rice, 2000: 25-26).
8 The methodology of the study
There are two parts to this section of the article. The first deals with the sample and data collection of the empirical study. The second part accounts for the ways used for measuring a consumer’s commitment, as well as the basis on which consumers are allocated to the different commitment segments.
8.1 Sample and data collection of the empirical study
A structured questionnaire was used to collect data and was administered by means of personal interviews. The interviews were conducted with respondents during June 2005, using random suburb sampling to obtain a representative national sample. Suburbs were drawn from the 2001 South African census and five interviews were conducted in each selected suburb to ensure that a demographically representative sample was realised across suburbs and geographic areas. The total sample for this study was 2000 interviews, conducted in the following seven major metropolitan areas of South Africa:
• Johannesburg
• Pretoria
• Cape Town
• Durban
• Bloemfontein
• East London
• Port Elizabeth
The sample is proportionate to the South African population in terms of both ethnic group and gender. The geographical and racial dimensions of the sample are set out in Table 1.
Table 1 The geographical and racial dimensions of the sample
Area Race Black White Coloured Indian
JHB/Pretoria 64% 60% 17% 26%
Durban 16% 10% 4% 65%
East London 3% 3% 2% –

SAJEMS NS 11 (2008) No 1 75
Port Elizabeth 6% 5% 10% –
Bloemfontein 2% 3% – –
Cape Town 9% 19% 67% 9%
Number of respondents 1 260 385 240 115
Respondents were interviewed at home and had to be 18 years or older to qualify for the interview. Fully-trained interviewers working under the supervision of field managers collected the data. The respondents were interviewed by interviewers of the same race group in their home language. In order to ensure honesty and reliability, a minimum 20 per cent check-back was conducted on the total sample, with at least 10 per cent on any one interviewer’s work. A total of 34 motor vehicle brands were included in the study. Annexure A contains the names of the brands.
8.2 Measurement of consumers’ commit- ment and allocation of consumers to commitment segments
The questionnaire to measure commitment to a particular brand with the CM is comprised of four items (Rice & Bennett, 1998; Hofmeyr & Rice, 2000). These four items and how they are measured are as follows:
• Need satisfaction: this is the extent to which consumers’ needs are satisfied by a parti-cular brand, measured on a 10-point Likert scale.
• Involvement in the category: this expresses the importance of the brand choice in the category to the consumer, measured on a 7-point Likert scale.
• Attitude to alternatives: this reflects the levels of commitment of the consumer to the brands currently being used, measured on a 7-point Likert scale.
• Intensity of ambivalence: this is the degree to which the consumer is uncertain about the brands on offer, measured on a 3-point scale.
The allocation of the consumers to different commitment segments (illustrated in Figure 1) is done with the algorithm based on the
mathematics of catastrophe theory (more specifically the butterfly cusp), which is discussed in section 7.1 (Rice & Bennett, 1998: 62). The allocation algorithm classifies respondents according to their responses on the four dimensions of satisfaction with the brand, the importance of the brand, the attitude to alternatives and a respondent’s degree of ambivalence. The four items used to measure customer commitment produce 1470 possible responses. The individual responses to all the brands that are part of a respondent’s evoked set are captured. Positive and negative outranking is applied to the responses to the items representing the four dimensions. The end value after positive and negative outranking has been applied assigns the respondent to a particular commitment segment. Figure 1 is an illustration of all the segments identified by the CM.
The CM divides current users of a brand into one of four segments (Hofmeyr & Rice, 2000: 25):
Entrenched: users of a brand who are unlikely to switch to other brands in the near future;
Average: users of a brand who are unlikely to change in the short term, but might do so in the medium term;
Shallow: these users’ commitment is below average and some of them are already actively considering alternative brands;
Convertible: it is highly likely that this group of users will defect to other brands.
Non-users of a brand, like users, can also be placed in one of four segments (Hofmeyr & Rice, 2000: 26):
Available: these non-users of the brand prefer a particular brand to their current one, and, although they have not yet switched over, they are psychologically ready for the change;
Ambivalent: the brand under study and the user’s current brand are equally attractive to

76 SAJEMS NS 11 (2008) No 1
this segment of non-users, so in essence they are available to the brand under consideration;
Weakly unavailable: non-users whose first choice lies with their current brands, though not firmly;
Strongly unavailable: this group of non-users strongly prefers their current brand and will adhere to it, in the short term at least.
Figure 1 Segments of the conversion model
Source: Hofmeyr and Rice, 2000: 26.
9 Empirical findings
Figure 2 illustrates the findings for all the brands included in the study. The graph clearly illustrates that commitment is rather low in the motor vehicle industry. The number of observations in Figure 2 is the total of all the responses of all 2000 respondents to all the brands they own or would consider buying according to the four items used for measuring commitment.
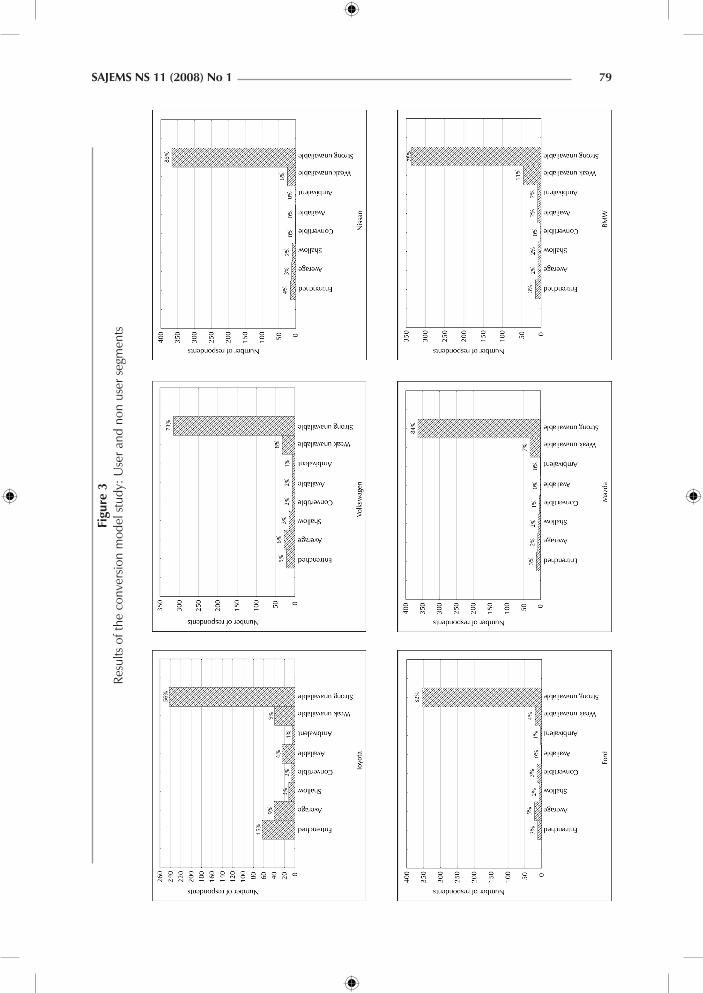
Figure 3 illustrates the eight segments pro-duced by the analysis of the data of the six most strongly-supported brands. The number of respondents for each of the six brands is set out in Table 2.
USERS
COMMITTED UNCOMMITTED
ENTRENCHED SHALLOWAVERAGE CONVERTIBLE
NON-USERS
OPEN UNAVAILABLE
AVAILABLE WEAKLY UNAVAILABLE
AMBIVALENT STRONGLY UNAVAILABLE

SAJEMS NS 11 (2008) No 1 77
Figure 2 Commitment categories of the conversion model for the motor vehicle
brands included in the study
Table 2 Number of respondents for best supported brands
Brands Number of respondents
Toyota 123
Volkswagen 72
Nissan 39
Ford 55
Mazda 34
BMW 33
Figure 3 reveals the commitment strengths of the six most popular of the 34 brands studied. It also presents the percentage of current non-users of the brands studied who might convert to a particular brand, as well as those who are not available to a particular brand. It is clear from Figure 3 that Toyota is by far the strongest motor vehicle brand in South Africa, because 24 per cent of the brand’s customers are entrenched, while the second strongest brand, Volkswagen, has only 5 per cent entrenched customers. The
remaining brands have 4 per cent or fewer entrenched customers. Entrenched customers are the prime customers of a brand, as they are unlikely to switch brands in the near future. These customers serve as advocates for the brand and they are likely to recommend it to others. This in turn endows the brand with valuable goodwill (Ceurvorst & Kitaeff, 1996: 60).
Table 3 is a summary of the committed, uncommitted, open and available customers of the six best supported brands.

78 SAJEMS NS 11 (2008) No 1
Table 3 Percentage of consumers in the different CM segments
USERS NON USERS
Brand Committed Uncommitted Sub-total Open Unavailable Sub-total Total
Toyota 24% 5% 29% 7% 65% 72% 100%
Volkswagen 11% 5% 16% 3% 81% 84% 100%
Nissan 7% 2% 9% 0% 91% 91% 100%
Ford 8% 5% 13% 1% 86% 87% 100%
Mazda 5% 3% 8% 0% 91% 91% 100%
BMW 5% 2% 7% 4% 89% 93% 100%
Table 3 shows that 83 per cent of Toyota users are committed [(24÷29)(100)]. Toyota has the strongest brand strength of the brands studied. Ford and Mazda, on the other hand, have the weakest brand strength of the six best supported brands, namely 62 per cent (that is [(8÷13)/100]) and 63 per cent [(5÷8)/100 = 63 per cent]) committed users respectively.
The most suitable way of managing rela-tionships with customers varies from segment to segment. Essentially, customers who use the brand can be divided into committed (entrenched or average) or uncommitted (shallow or convertible), while non-users of the brand can be divided into those who are open to the brand (available or ambivalent) or unavailable (weakly or strongly unavailable). The non-users constitute the largest segment in this study.
Relationships with committed customers are, generally speaking, the easiest to manage (Rice & Bennett, 1998:61). This segment of customers prefers the brand and is actually fond of it, believes the advertising about it and is, on the whole, not price-sensitive. Despite this favourable attitude towards the brand, it is imperative for these customers to be continuously reminded and re-assured that they have made the right choice. When customer commitment is neglected, their relationship with the brand can deteriorate. This is especially relevant for brands like Ford and Mazda, as their committed customers constitute only 62 per cent and 63 per cent respectively of their users. A drop of 1 per cent in committed
consumers of Ford, for instance, means a drop of 8 per cent of the committed share of their users (that is [(8÷13)(100)] = 62 per cent and [(7÷13)(100)] = 54 per cent). Advertising is a very functional means of nurturing committed consumers, because advertising reassures consumers, and increases their awareness of the consumption experience. Enduring commitment thus demands preservation of the brand. Brand faithfulness amongst committed consumers makes brand switching a very difficult matter. The latter is especially true of the most favoured brand on a customer’s list. Most markets for consumer goods tend to be fairly stable, with substantial adjustments taking place only when new channels of distribution are introduced into the market-place (such as internet transactions) or when new significant changes are made to product categories (such as hybrid engines in motor vehicles). These “substantial” or “significant” changes result in consumers reconsidering realistic alternatives to the brands they use (Hofmeyr & Rice, 2000: 36-37).
There are many reasons for lack of user-commitment to a brand (Hofmeyr & Rice, 2000: 38). Typical sources are lack of involvement in the category or dissatisfaction with the product or service. Lack of commitment can also result from exceptionally heavy involvement with the category, as this can lead to experimenting with brands and ongoing assessments of new brands. Uncommitted consumers select the brand they can purchase with the least effort, so convenience and price are their main selection criteria.
SAJEMS NS 11 (2008) No 1 79
Figu
re 3
Re
sults
of t
he c
onve
rsio
n m
odel
stu
dy: U
ser a
nd n
on u
ser s
egm
ents

80 SAJEMS NS 11 (2008) No 1
Advertising does not reach these consumers, as they belong to the group running the least chance of being influenced by any advertising for the category. They block advertising, so marketing efforts should focus on point of sale and promotion activities that increase the visibility of the brand.
When consumers are uncommitted but brand choice does matter to them, the marketer faces an intimidating task. Perhaps the customer has experienced difficulties in the past. The challenge, therefore, is to establish the exact nature of the problem experienced previously and the most suitable action to be taken. The “promiscuous” consumer also belongs to this segment of consumers. A case in point is the consumers who, on a regular basis, qualify for a new company car. Brand choice is very important to such consumers, but they also experiment frequently with other brands. Experimentation is integral to the behaviour of these consumers. They read advertisements diligently, so the more information they can be given about a brand, the better.
Available non-users are not currently using a particular brand, but they are immediately available for acquisition. The extent of this segment matters when new items like microwave ovens and cell phones, for instance, are launched. Hofmeyr and Rice (2000: 39) report on a study in which the size of the non-user segment available to all brands of cell phones was so large that any focus on competition between brands was irrelevant. The fact that non-users were available to the category meant that the most accessible brand came to mind first and, if competitively priced, would be selected.
The reason that ambivalent consumers are not using a particular brand is simply because they are undecided about the brand (Ceurvorst & Kitaeff, 1996: 60). The brand about which this segment is ambivalent is not regarded as better or worse than the brand they are currently using. Only worthwhile incentives will win these consumers over to a brand. Reduced prices, very favourable financing options or a spectacular promotion (such as the chance to get a free motor vehicle or attend a course in advanced driving) are typical incentives in this regard. Thorough research among these consumers is
necessary to understand what would make them use another brand.
As indicated earlier, uncommitted users of competitor brands are non-users who are available to or ambivalent about a brand. Marketers are frequently tempted to focus more on the unavailable than on the available and ambivalent segments, because, for most brands, the unavailable segment is usually the largest segment. This is also the case with the six brands reported in Table 3. The unavailable segment constitutes 65 per cent or more respondents for all the brands studied. The reason(s) for a consumer being unavailable to a particular brand could be one or more of the following (Hofmeyr & Rice, 2000: 40):
• They know of the brand, and may even have tried it, but see no reason to switch;
• They are committed to the brands they use;
• They are aware of the brand, but have a poor impression of it;
• They are unaware that the brand exists.
The latter reason for unavailability can be easily rectified. The brand must be exposed to this segment through advertising or other promotion means to encourage trial.
As far as established mature brands are concerned, the most common reason for un-availability to a brand is that consumers are satisfied with their current choice (Ceurvorst & Kitaeff, 1996: 60) and see no reason for switching from their present preference. They can see nothing wrong with a competing brand, but are pleased with what their current brand offers them.
Advertising has no effect on the unavailable segment of consumers and therefore does not persuade or influence its members (Hofmeyr & Rice, 2000: 158 & 173; Rice & Bennett, 1998: 63). The major means of persuading unavailable consumers to consider purchasing a brand is by trial. Some motor vehicle retailers send personal invitations to test–drive a new model or attend its launch. The segments recognised by the CM enable us to work out why consumers are unavailable to a brand. It enables us to take decisions and actions to acquire the unavailable segment for a particular brand in the near future.

SAJEMS NS 11 (2008) No 1 81
10 Managerial implications for the
motor vehicle industry
Customer retention, now accepted as a vital contributor to long-term profitability, has undoubtedly become a major challenge for firms. The daunting challenge for managers is that, although customers might claim to be highly satisfied, they often change to competing brands. It is an undeniable fact that satisfied customers are not necessarily loyal customers. The CM’s major advantage is that it takes into account satisfaction, the psychological significance of the brand choice to the consumer, and a comparative measure of the customer’s preferred brand against the competition to measure commitment. Apart from its ability to measure retention, the CM is also effective in revealing possible sources of future business.
The tasks for managing individual segments can be summarised as follows:
• Committed customers need to be continually reassured about the choice they have made. To put consumers’ minds at rest and enhance the consumption experience, frequent advertising for maintenance of the brand is imperative. When independent road tests have been undertaken by journalists or authoritative bodies, the results or the broadcasting times of such tests should be brought to customers’ attention as soon as possible.
• When uncommitted customers with no particular brand preference are involved, sales staff should be trained in both technical and other knowledge about the vehicles.
• There should be ample opportunities for uncommitted customers for whom brand choice is important to lodge com-plaints and/or make suggestions. The “promiscuous” type in this segment requires regular advertising and websites should be updated regularly with new information. Furthermore, efforts should be made to include such customers on mailing lists.
• Available non-users are important when new models are launched. Accessibility,
price and prominence in the mind are important if business is to be done with this segment.
• To attract ambivalent consumers there must be a worthwhile incentive. Recent examples of this are fixed interest rates over the period of payment, deferred payments and the inclusion of a range of accessories with standard models. The message is clear: it takes an unusual or extraordinary promotion campaign to win over ambivalent consumers to a brand.
• Unavailable segments require substantial market research to establish whether any marketing activity (strategy or tactic) could be meaningful in persuading consumers from this segment.
11 Limitations of the study
The interpretation and utilisation of the results demand a great deal of caution. The major reason for this is that, although the sample is representative of the entire South African population, it does not necessarily mean that the respondents are representative of typical motor vehicle consumers. In other words, the typical owners of the various motor vehicle brands might be under-represented in the sample. Motor vehicle ownership is low for the whole sample, namely 35 per cent. When researching commitment to a particular brand, it is likely that the sample would include many more than 35 per cent respondents who own a motor vehicle.
References
1 ABDUL-MUHMIN, A.G. (2002) “Effects of suppliers’ marketing program variables on industrial buyers’ relationship satisfaction and commitment,” Journal of Business & Industrial Marketing, 17(7): 637-651.
2 ANDERSON, E.W.; FORNELL, C. & LEHMANN, D.R. (1994) “Customer satisfaction, market share, and profitability: Findings from Sweden,” Journal of Marketing, 58(3): 53-66.
3 ANDERSON, E.W. & SULLIVAN, M.W. (1993) “The antecedents and consequences of customer
82 SAJEMS NS 11 (2008) No 1
satisfaction for firms,” Marketing Science, 12(2): 125-43.
4 ANDREASSEN, T.W. & LINDESTAD, B. (1998) “Customer loyalty and complex services,” International Journal of Service Industry Management, 9(1): 7-23.
5 ANG, L. & BUTTLE, F. (2006) “Customer retention management processes: A quantitative study”, European Journal of Marketing, 40(1/2): 83-99.
6 AUH, S. & JOHNSON, M.D. (2005) “Compatibility effects in evaluations of satisfaction and loyalty”, Journal of Economic Psychology, 26(1): 35-57.
7 BANSAL, H.S.; IRVING, P.G. & TAYLOR, S.F. (2004) “A three-component model of customer commitment to service providers”, Journal of the Academy of Marketing Science, 32(3): 234-250.
8 BERRY, L.L. & PARASURAMAN, A. (1991) Marketing services, Free Press: New York.
9 BETTENCOURT, L.A. (1997) “Customer voluntary performance: Customers as partners in service delivery”, Journal of Retailing, 73(3): 383-406.
10 BOULDING, W.; KALRA, A.; STAELIN, R. & ZEITHAML, V.A. (1993) “A dynamic process model of service quality: From expectations to behavioral intentions, Journal of Marketing Research, 30(1): 7-27.
11 CEURVORST, R.W. & KITAEFF, R. (1996) “Customer taxonomy”, Electric Perspectives, 21(6): 56-61.
12 CLERFEUILLE, F. & POUBANNE, Y. (2003) “Differences in the contributions of elements of service to satisfaction, commitment and consumers’ share of purchase: A study from the tetraclass model”, Journal of Targeting, Measurement and Analysis for Marketing, 12(1): 66-81.
13 COYLES, S. & GOKEY, T.C. (2005) “Customer retention is not enough”, Journal of Consumer Marketing, 22(2): 101-105.
14 DAWKINS, P.M. & REICHHELD, F.F. (1990) “Customer retention as a competitive weapon”, Directors and Boards, 14(Summer): 42-47.
15 DICK, A.S. & BASU, K. (1994) “Customer loyalty: Towards an integrated framework”, Journal of the Academy of Marketing Science, 22(2): 99-113.
16 DIMITRIADES, Z.S. (2006) “Customer satisfaction, loyalty and commitment in service organizations: Some evidence from Greece”, Management Research News, 29(12): 782-800.
17 DRUCKER, P.F. (1973) Management: Tasks, responsibilities, practices, New York: Harper & Row.
18 DWYER, F.R.; SCHURR, P.H. & OH, S. (1987) “Developing buyer-seller relationships”, Journal of Marketing, 51(2): 11-27.
19 EGAN, J. (2000) “Drivers to relational strategies in retailing”, International Journal of Retail & Distribution Management, 28(8): 379-386.
20 FORNELL, C. (1992) “A national customer satisfaction barometer: The Swedish experience”, Journal of Marketing, 55(1): 1–21.
21 GANESON, S. (1994) “Determinants of long-term orientation in buyer-seller relationships”, Journal of Marketing, 58(2): 1-19.
22 GARBARINO, E. & JOHNSON, M.S. (1999) “The different roles of satisfaction, trust and commitment in customer relationships”, Journal of Marketing, 63(2): 70-87.
23 GOUNARIS, S.P. (2005) “Trust and commitment influences on customer retention: Insights from business-to-business services”, Journal of Business Research, 58(2): 126-140.
24 GRÖNROOS, C. (1990) “Services Management and Marketing: Managing The Moments of Truth in Service Competition”, Lexington Books: Lexington, M.A.
25 GUNDLACH, G.T.; ACHROL, R.S. & MENTZER, J.T. (1995) “The structure of commitment in exchange“, Journal of Marketing, (59)1: 78-92.
26 HALL, D. (2001) “The great customer satisfaction con” Paper read at the National Conference of the New Zealand Market Research Society. Te Papa, Wellington (October 3-5).
27 HEIDE, J.B. & JOHN, G. (1992) “Do norms matter in marketing relationships”, Journal of Marketing, 56(2): 32-44.
28 HESKETT, J.L. (2002) “Beyond customer loyalty”, Managing Service Quality, 12(6): 355-357.
29 HESKETT, J.L.; SASSER, W.E. (Jr) & SCHLESINGER, L.A. (1997) The Service Profit Chain: How Leading Companies Link Profit and Growth to Loyalty, Satisfaction and Value”, The Free Press: New York.
30 HESS, J. & STORY, J. (2005) “Trust-based commitment: Multidimensional consumer-brand relationships”, Journal of Consumer Marketing, 22(6): 313-322.
31 HOFMEYR, J. & RICE, B. (2000) Commitment-Led Marketing, John Wiley: Chichester.
32 HOFMEYR, J. & RICE, J. (1995) “Integrating the psychological conversion model with database information to measure and manage customer equity”, The Journal of Database Marketing, 3(1): 39-52.
33 HOFMEYR, J. & RICE, J. (1999) “A method for using psychological commitment as a window

SAJEMS NS 11 (2008) No 1 83
to the motivations that lie behind behaviour in a database”, The Journal of Database Marketing, 7(1): 9-21.
34 INIESTA, M.A. & SÁNCHEZ, M. (2002) “Retail-consumer commitment and market segmentation”, The International Review of Retail, Distribution and Consumer Research, 12(3): 261-279.
35 JONES, T.O. & SASSER, E.W. (Jr). (1995) “Why satisfied customers defect”, Harvard Business Review, 73(6): 88-101.
36 KEAVENEY, S.M. (1995) “Customer switching behavior in service industries: An exploratory study”, Journal of Marketing, 59(2): 71-82.
37 KENT, E. & LÖFMARCK VAGHULT, A. (2000) “Customer retention, purchasing behavior and relationship substance in professional services”, Industrial Marketing Management, 29(4): 363-372.
38 KNOX, S.D. & DENISON, T.J. (2000) “Store loyalty: Its impact on retail revenue: An empirical study of purchasing behavior in the UK”, Journal of Retailing and Consumer Services, 7(1): 33–45.
39 KUMAR, V.; LEMON, K.N. & PARASURAMAN, A. (2006) “Managing customers for value: An overview and research agenda”, Journal of Service Research, 9(2): 87-94.
40 MATHIEU, J.E. & ZAJAC, D.M. (1990) “A review and meta-analysis of the antecedents, correlates and consequences of organizational commitment”, Psychological Bulletin, 108(2): 171-194.
41 McCARTHY, D.G. (1997) The Loyalty Link: How Loyal Employees Create Loyal Customers, John Wiley & Sons: New York.
42 MIRANDA, M.J.; KÓNYA, L. & HAVRILA, I. (2005) “Shoppers’ satisfaction levels are not the only key to store loyalty”, Marketing Intelligence and Planning, 23(2): 220-232.
43 MITTAL, B. & LASSAR, W.M. (1998) “Why do customers switch? The dynamics of satisfaction versus loyalty”, The Journal of Services Marketing, 12(3): 177-194.
44 MOORMAN, C.; ZALTMAN, G. & DESHPANDE, R. (1992) “Relationships between providers and users of marketing research: The dynamics of trust within and between organizations”, Journal of Marketing Research, 29(3): 314-329.
45 MORGAN, R.M. & HUNT, S.D. (1994) “The commitment trust theory of relationship marketing”, Journal of Marketing, 58(3): 20-38.
46 OLIVER, R.L. (1999) “Whence consumer loyalty?”, Journal of Marketing, 63(4): 33-44.
47 PALMATIER, R.W.; DANT, R.J.; GREWAL, D. & EVANS, K.R. (2006) “Factors influencing the effectiveness of relationship marketing: A meta-analysis”, Journal of Marketing, 70(4): 136-153.
48 PRESSEY, A.D. & MATHEWS, B.P. (2000) “Barriers to relationship marketing in consumer retailing”, Journal of Services Marketing, 14(3): 272-286.
49 PRITCHARD, M.P.; HAVITZ, M.E. & HOWARD, D.E. (1999) “Analyzing the commitment-loyalty link in service contexts”, Journal of the Academy of Marketing Science, 27(3): 333-348.
50 REICHHELD, F. (1996) The Loyalty Effect: The Hidden Force Behind Growth, Profit and Lasting Value, Harvard Business School Press: Boston.
51 RICE, B. & BENNETT, R. (1998) “The relationship between brand usage and advertising tracking measurements: International findings”, Journal of Advertising Research, 38(3): 58-66.
52 RICHARDS, T. (1996) “Using the conversion model to optimize customer retention”, Managing Service Quality, 6(4): 48-52.
53 RUST, R.T. & OLIVER, R.L. (2000) “Should we delight the customer?”, Journal of the Academy of Marketing Science, 28(1): 86-94.
54 SCANZONI, J. (1979) “Social exchange and behavioral interdependence”. In Burgess, R.L. and Huston, T.L. (eds.) Social Exchange in Developing Relationships, Academic Press: New York
55 SHETH, J.N. & SISODIA, R. (1995) “Improving the marketing productivity”, in Encyclopedia of Marketing for the Year 2000, Chicago: American Marketing Association.
56 SZYMANSKI, D.M. & HENARD, D.H. (2001) “Customer satisfaction”, Journal of the Academy of Marketing Science, 29(1): 16-35.
57 WETZELS, M.; DE RUYTER, K. & VAN BIRGELEN, M. (1998) “Marketing service relationships: the role of commitment”, Journal of Business & Industrial Marketing, 13(4/5): 406-423.
58 WILLIAMSON, O.E. (1985) The Economic Institutions of Capitalism, The Free Press: New York.
59 WIRTZ,B. W. & LIHOTZKY, N. (2003) “Customer retention management in the B2C electronic business”, Long Range Planning, 36(6): 517–532.
60 ZEITHAML, V.A.; BERRY, L.L. & PARASURAMAN, A. (1996) “The behavioural consequences of service quality”, Journal of Marketing, 60(2): 31-46.

84 SAJEMS NS 11 (2008) No 1
Annexure A
MOTOR VEHICLE BRANDS INCLUDED IN THE STUDY
Alfa Romeo Lexus
Audi Mazda
BMW Mercedes-Benz
Chevrolet Mini
Chrysler Mitsubishi
Citroen Nissan
Colt Opel
Daewoo Peugeot
Daihatsu Renault
Fiat Rover
Ford SAAB
Honda Suzuki
Hyundai Subaru
Isuzu Toyota
Jaguar Volkswagen
Jeep Volvo
Kia Other (Respondent had to specify)
Land Rover None