1. Introduction - Department of Energy BAKKEN...Washington, DC 20585 1 U.S. Department of Energy...
20
1 U.S. Department of Energy Washington, DC 20585 Date: August 8, 2014 To: Members of the Public From: Quadrennial Energy Review Task Force Secretariat and Energy Policy and Systems Analysis Staff, United States Department of Energy Re: QER Public Stakeholder Meeting: Infrastructure Constraints in the Bakken 1. Introduction On January 9, 2014, President Obama issued a Presidential Memorandum establishing a Quadrennial Energy Review (QER). The Secretary of Energy provides support to the QER Task Force, including coordination of activities related to the preparation of the QER report, policy analysis and modeling, and stakeholder engagement. On Friday, August 8, 2014, at 11:00 AM CDT at the Bismarck State College, National Energy Center of Excellence, Bavendick Stateroom (No. 415), located at 1200 Schafer Street, in Bismarck, North Dakota, the U.S. Department of Energy (DOE), acting as the Secretariat for the QER Task Force, will hold a public meeting to discuss and receive comments on issues surrounding the infrastructure constraints in further developing shale resources in the Bakken region. There will be an opportunity for public comment via an open microphone session following panel discussions. Written comments can be submitted to [email protected]. The session will also be webcast at www.energy.gov/live. 2. Background Over the past decade, the energy profile of the United States has undergone a dramatic transformation. A major component of this shift has been the ability to unlock fossil fuel resources from diverse shale formations around the country. America’s economy and infrastructure will continue to adapt to the abundance of accessible shale and natural gas resources and the decreased carbon emissions, lower imports, and enhanced industrial competitiveness. The effects of the shale revolution are already rippling through the natural gas industry and the broader economy, reducing overseas imports and adding substantially to supplies from the U.S. interior and Canada. 2.1 Production Overview Since 2008, U.S. oil production has grown rapidly, reaching more than 8.4 million barrels per day (MMBbl/d) in April of 2014. 1 The domestic oil boom is due primarily to new production of light sweet crude from unconventional tight-oil formations in North Dakota (Bakken) and Texas (Eagle Ford and Permian Basin), using the same technologies that propelled U.S. shale gas production from 3.5 billion 1 U.S. Energy Information Administration (EIA), “Petroleum Supply Monthly – Daily Average,” April 2014, http://www.eia.gov/dnav/pet/pet_sum_snd_d_nus_mbblpd_m_cur.htm.
Transcript of 1. Introduction - Department of Energy BAKKEN...Washington, DC 20585 1 U.S. Department of Energy...
1
U.S. Department of Energy
Washington, DC 20585
Date: August 8, 2014
To: Members of the Public
From: Quadrennial Energy Review Task Force Secretariat and Energy Policy and Systems
Analysis Staff, United States Department of Energy
Re: QER Public Stakeholder Meeting: Infrastructure Constraints in the Bakken
1. Introduction
On January 9, 2014, President Obama issued a Presidential Memorandum establishing a Quadrennial
Energy Review (QER). The Secretary of Energy provides support to the QER Task Force, including
coordination of activities related to the preparation of the QER report, policy analysis and modeling, and
stakeholder engagement.
On Friday, August 8, 2014, at 11:00 AM CDT at the Bismarck State College, National Energy Center of
Excellence, Bavendick Stateroom (No. 415), located at 1200 Schafer Street, in Bismarck, North Dakota,
the U.S. Department of Energy (DOE), acting as the Secretariat for the QER Task Force, will hold a
public meeting to discuss and receive comments on issues surrounding the infrastructure constraints in
further developing shale resources in the Bakken region. There will be an opportunity for public comment
via an open microphone session following panel discussions. Written comments can be submitted to
[email protected]. The session will also be webcast at www.energy.gov/live.
2. Background
Over the past decade, the energy profile of the United States has undergone a dramatic transformation. A
major component of this shift has been the ability to unlock fossil fuel resources from diverse shale
formations around the country. America’s economy and infrastructure will continue to adapt to the
abundance of accessible shale and natural gas resources and the decreased carbon emissions, lower
imports, and enhanced industrial competitiveness. The effects of the shale revolution are already rippling
through the natural gas industry and the broader economy, reducing overseas imports and adding
substantially to supplies from the U.S. interior and Canada.
2.1 Production Overview
Since 2008, U.S. oil production has grown rapidly, reaching more than 8.4 million barrels per day
(MMBbl/d) in April of 2014.1 The domestic oil boom is due primarily to new production of light sweet
crude from unconventional tight-oil formations in North Dakota (Bakken) and Texas (Eagle Ford and
Permian Basin), using the same technologies that propelled U.S. shale gas production from 3.5 billion
1 U.S. Energy Information Administration (EIA), “Petroleum Supply Monthly – Daily Average,” April 2014,
http://www.eia.gov/dnav/pet/pet_sum_snd_d_nus_mbblpd_m_cur.htm.
2
U.S. Department of Energy
Washington, DC 20585
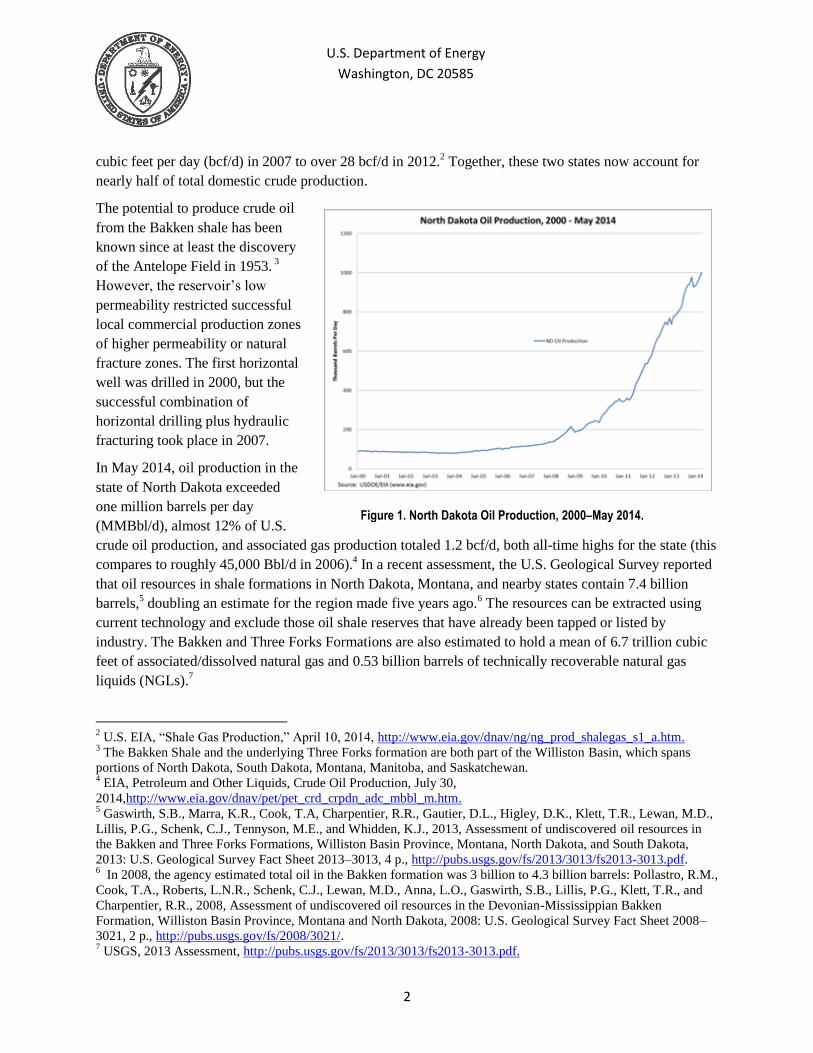
Figure 1. North Dakota Oil Production, 2000–May 2014.
cubic feet per day (bcf/d) in 2007 to over 28 bcf/d in 2012.2 Together, these two states now account for
nearly half of total domestic crude production.
The potential to produce crude oil
from the Bakken shale has been
known since at least the discovery
of the Antelope Field in 1953. 3
However, the reservoir’s low
permeability restricted successful
local commercial production zones
of higher permeability or natural
fracture zones. The first horizontal
well was drilled in 2000, but the
successful combination of
horizontal drilling plus hydraulic
fracturing took place in 2007.
In May 2014, oil production in the
state of North Dakota exceeded
one million barrels per day
(MMBbl/d), almost 12% of U.S.
crude oil production, and associated gas production totaled 1.2 bcf/d, both all-time highs for the state (this
compares to roughly 45,000 Bbl/d in 2006).4 In a recent assessment, the U.S. Geological Survey reported
that oil resources in shale formations in North Dakota, Montana, and nearby states contain 7.4 billion
barrels,5 doubling an estimate for the region made five years ago.
6 The resources can be extracted using
current technology and exclude those oil shale reserves that have already been tapped or listed by
industry. The Bakken and Three Forks Formations are also estimated to hold a mean of 6.7 trillion cubic
feet of associated/dissolved natural gas and 0.53 billion barrels of technically recoverable natural gas
liquids (NGLs).7
2 U.S. EIA, “Shale Gas Production,” April 10, 2014, http://www.eia.gov/dnav/ng/ng_prod_shalegas_s1_a.htm.
3 The Bakken Shale and the underlying Three Forks formation are both part of the Williston Basin, which spans
portions of North Dakota, South Dakota, Montana, Manitoba, and Saskatchewan. 4 EIA, Petroleum and Other Liquids, Crude Oil Production, July 30,
2014,http://www.eia.gov/dnav/pet/pet_crd_crpdn_adc_mbbl_m.htm. 5 Gaswirth, S.B., Marra, K.R., Cook, T.A, Charpentier, R.R., Gautier, D.L., Higley, D.K., Klett, T.R., Lewan, M.D.,
Lillis, P.G., Schenk, C.J., Tennyson, M.E., and Whidden, K.J., 2013, Assessment of undiscovered oil resources in
the Bakken and Three Forks Formations, Williston Basin Province, Montana, North Dakota, and South Dakota,
2013: U.S. Geological Survey Fact Sheet 2013–3013, 4 p., http://pubs.usgs.gov/fs/2013/3013/fs2013-3013.pdf. 6 In 2008, the agency estimated total oil in the Bakken formation was 3 billion to 4.3 billion barrels: Pollastro, R.M.,
Cook, T.A., Roberts, L.N.R., Schenk, C.J., Lewan, M.D., Anna, L.O., Gaswirth, S.B., Lillis, P.G., Klett, T.R., and
Charpentier, R.R., 2008, Assessment of undiscovered oil resources in the Devonian-Mississippian Bakken
Formation, Williston Basin Province, Montana and North Dakota, 2008: U.S. Geological Survey Fact Sheet 2008–
3021, 2 p., http://pubs.usgs.gov/fs/2008/3021/. 7 USGS, 2013 Assessment, http://pubs.usgs.gov/fs/2013/3013/fs2013-3013.pdf.
3
U.S. Department of Energy
Washington, DC 20585
2.2 Bakken Crude Characteristics
Crude oil from the Bakken is primarily light sweet crude, as compared to heavier crudes produced from
conventional domestic reservoirs, Canadian syncrudes, and crude oil imported from other countries.
Bakken crude has low density and is relatively volatile, with typically 38°–42° American Petroleum
Institute (API) gravity and 0.13 % sulfur. This is a high-value crude with a high gasoline yield.
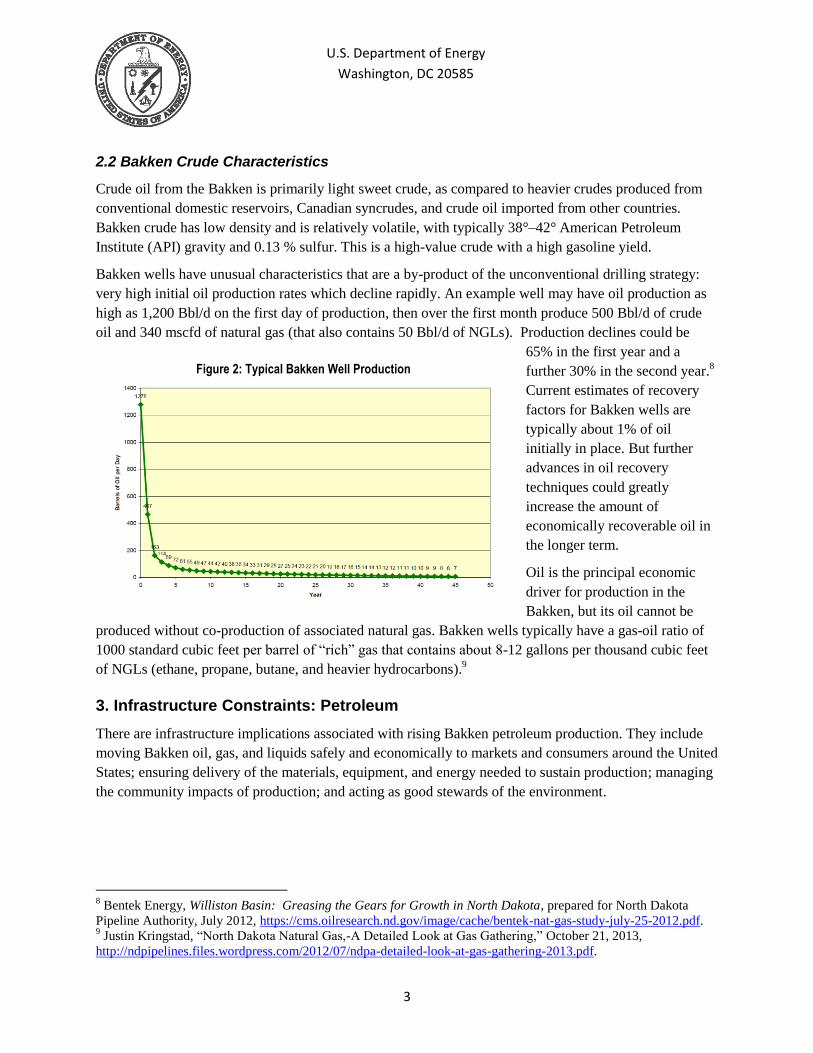
Bakken wells have unusual characteristics that are a by-product of the unconventional drilling strategy:
very high initial oil production rates which decline rapidly. An example well may have oil production as
high as 1,200 Bbl/d on the first day of production, then over the first month produce 500 Bbl/d of crude
oil and 340 mscfd of natural gas (that also contains 50 Bbl/d of NGLs). Production declines could be
65% in the first year and a
further 30% in the second year.8
Current estimates of recovery
factors for Bakken wells are
typically about 1% of oil
initially in place. But further
advances in oil recovery
techniques could greatly
increase the amount of
economically recoverable oil in
the longer term.
Oil is the principal economic
driver for production in the
Bakken, but its oil cannot be
produced without co-production of associated natural gas. Bakken wells typically have a gas-oil ratio of
1000 standard cubic feet per barrel of “rich” gas that contains about 8-12 gallons per thousand cubic feet
of NGLs (ethane, propane, butane, and heavier hydrocarbons).9
3. Infrastructure Constraints: Petroleum
There are infrastructure implications associated with rising Bakken petroleum production. They include
moving Bakken oil, gas, and liquids safely and economically to markets and consumers around the United
States; ensuring delivery of the materials, equipment, and energy needed to sustain production; managing
the community impacts of production; and acting as good stewards of the environment.
8 Bentek Energy, Williston Basin: Greasing the Gears for Growth in North Dakota, prepared for North Dakota
Pipeline Authority, July 2012, https://cms.oilresearch.nd.gov/image/cache/bentek-nat-gas-study-july-25-2012.pdf. 9 Justin Kringstad, “North Dakota Natural Gas,-A Detailed Look at Gas Gathering,” October 21, 2013,
http://ndpipelines.files.wordpress.com/2012/07/ndpa-detailed-look-at-gas-gathering-2013.pdf.
Figure 2: Typical Bakken Well Production

4
U.S. Department of Energy
Washington, DC 20585
3.1 Overview
In the United States, crude oil is most commonly transported by pipeline to move crude from areas of
production and import locations to refineries. The expansion of oil and gas production from the Bakken has
up-ended pre-existing petroleum
infrastructure systems in the U.S.
Historically, most domestic
petroleum was produced in
Louisiana, Oklahoma, and Texas
and refined in the interior and
along the Gulf Coast, with coastal
refineries receiving much of their
oil from overseas and Alaska.
The existing pipeline system was
configured mainly to move
imported crude northwards from
the Gulf to refineries in the
interior, which means there is very
limited pipeline capacity to take
new crude production from the
interior to refineries on the coasts
(Gulf, East, West).
With the rapid expansion of
domestic production, patterns of
crude oil transport have shifted.
The new shipping requirements
from Bakken production have
been met by a combination of
pipeline modifications, e.g., flow
reversals from northwards to
southwards, coupled with
increased rail, barge, and truck
transport, with truck transport generally limited to moving oil from the wellhead to pipeline or rail
loading terminals.10
Several pipeline expansions and direction reversals have taken place, and additional
pipeline expansions and reversals are planned and expected to continue through 2015 (Figure 3).
10
EPRINC, Pipelines, Trains and Trucks: Moving Rising North American Oil Production to Market, October 21,
2013, http://eprinc.org/wp-content/uploads/2013/10/EPRINC-PIPELINES-TRAINS-TRUCKS-OCT31.pdf.
Figure 3. Historical and planned pipeline flows between PADD II and PADD III
Source: U.S. Strategic Petroleum Reserve, 2014

5
U.S. Department of Energy
Washington, DC 20585
Historically, North Dakota was a minor source of domestic crude oil, serviced by low-volume feeder
pipelines. With the boom of production in the Bakken, pipeline operators moved swiftly to increase crude
oil pipeline capacity from 230,000 Bbl/d in 2007 to 337,000 Bbl/d in 2010.
Figure 4. Bakken crude oil transport by mode, 2007–April 2014.
During 2010, North Dakota production began to approach and to exceed pipeline capacity. Producers
began to ship small volumes of petroleum by rail tank car, at first to Wood River, Illinois, for
transshipment by barge to the Gulf of Mexico. By 2011, pipeline operators had boosted capacity to over
400,000 Bbl/d, but North Dakota production exceeded 500,000 Bbl/d (Figure 4).
3.2 Crude-by-rail boom
As North Dakota oil production exceeded pipeline capacity, rail became the dominant transportation
mode. With takeaway capacity otherwise limited, rail provided the flexibility for Bakken crude to reach
markets with demand for light sweet crude.11
Rail operators quickly began purchasing additional tank cars and developing rail terminals in North
Dakota and later offloading terminals on the East and West Coasts. Increasing volumes of crude oil began
moving by rail. By April 2014, rail comprised around 63% of total oil shipments from the Bakken field in
North Dakota, and 100% of Bakken-to-West-Coast deliveries (to WA, then barged to CA).12
11
Cf., Trisha Curtis, Matt Calderon, Ben Montalbano, Lucian Pugliaris, “Lagging Pipelines Create US Gulf Light
Sweet Crude Glut,” OGJ, March 3, 2014, http://www.ogj.com/articles/print/volume-112/issue-
3/transportation/lagging-pipelines-create-us-gulf-light-sweet-crude-glut.html. 12
Justin Kringstad, Energy Development and Transmission Committee, North Dakota Pipeline Authority, July 8,
2014, https://ndpipelines.files.wordpress.com/2012/04/kringstad-edt-7-8-2014.pdf .
6
U.S. Department of Energy
Washington, DC 20585
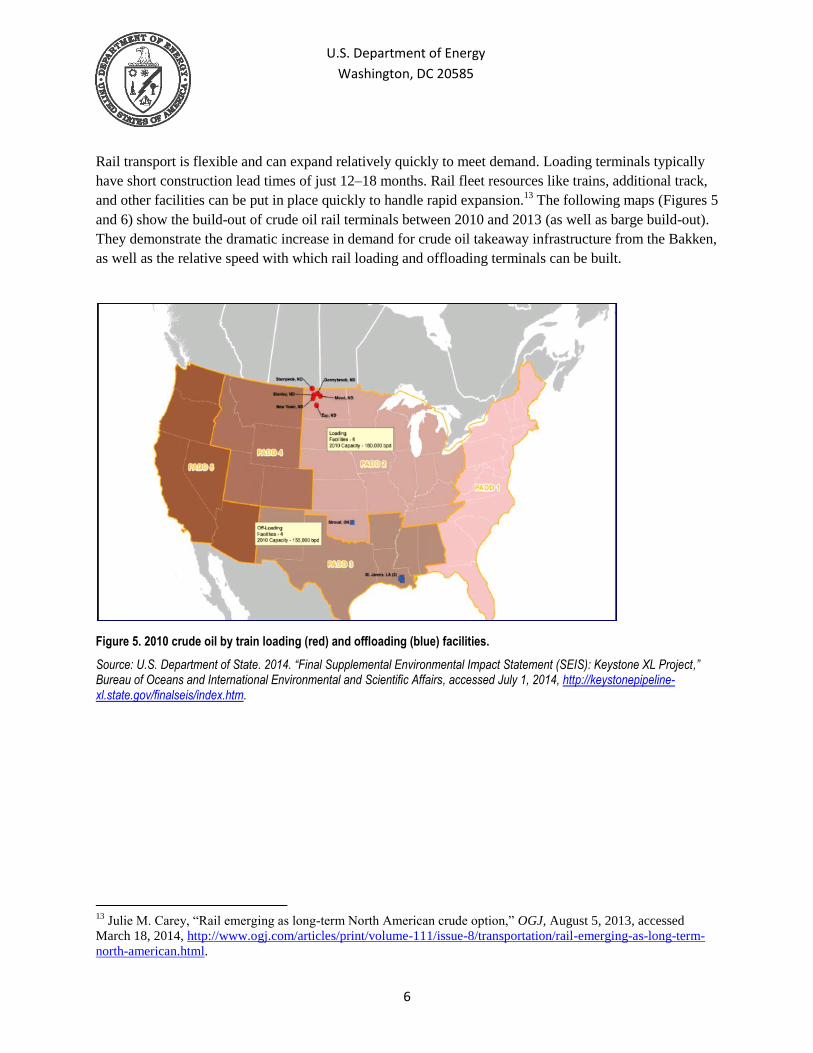
Rail transport is flexible and can expand relatively quickly to meet demand. Loading terminals typically
have short construction lead times of just 12–18 months. Rail fleet resources like trains, additional track,
and other facilities can be put in place quickly to handle rapid expansion.13
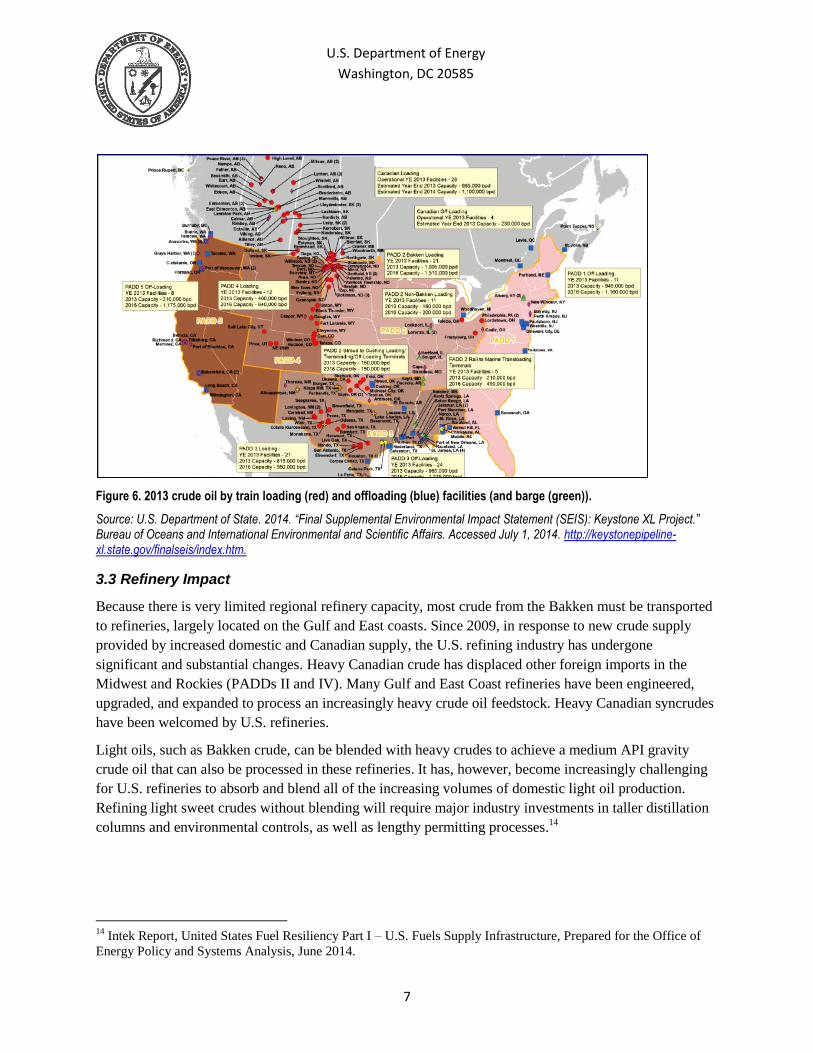
The following maps (Figures 5
and 6) show the build-out of crude oil rail terminals between 2010 and 2013 (as well as barge build-out).
They demonstrate the dramatic increase in demand for crude oil takeaway infrastructure from the Bakken,
as well as the relative speed with which rail loading and offloading terminals can be built.
Figure 5. 2010 crude oil by train loading (red) and offloading (blue) facilities.
Source: U.S. Department of State. 2014. “Final Supplemental Environmental Impact Statement (SEIS): Keystone XL Project,” Bureau of Oceans and International Environmental and Scientific Affairs, accessed July 1, 2014, http://keystonepipeline-xl.state.gov/finalseis/index.htm.
13
Julie M. Carey, “Rail emerging as long-term North American crude option,” OGJ, August 5, 2013, accessed
March 18, 2014, http://www.ogj.com/articles/print/volume-111/issue-8/transportation/rail-emerging-as-long-term-
north-american.html.
7
U.S. Department of Energy
Washington, DC 20585
Figure 6. 2013 crude oil by train loading (red) and offloading (blue) facilities (and barge (green)).
Source: U.S. Department of State. 2014. “Final Supplemental Environmental Impact Statement (SEIS): Keystone XL Project.” Bureau of Oceans and International Environmental and Scientific Affairs. Accessed July 1, 2014. http://keystonepipeline-xl.state.gov/finalseis/index.htm.
3.3 Refinery Impact
Because there is very limited regional refinery capacity, most crude from the Bakken must be transported
to refineries, largely located on the Gulf and East coasts. Since 2009, in response to new crude supply
provided by increased domestic and Canadian supply, the U.S. refining industry has undergone
significant and substantial changes. Heavy Canadian crude has displaced other foreign imports in the
Midwest and Rockies (PADDs II and IV). Many Gulf and East Coast refineries have been engineered,
upgraded, and expanded to process an increasingly heavy crude oil feedstock. Heavy Canadian syncrudes
have been welcomed by U.S. refineries.
Light oils, such as Bakken crude, can be blended with heavy crudes to achieve a medium API gravity
crude oil that can also be processed in these refineries. It has, however, become increasingly challenging
for U.S. refineries to absorb and blend all of the increasing volumes of domestic light oil production.
Refining light sweet crudes without blending will require major industry investments in taller distillation
columns and environmental controls, as well as lengthy permitting processes.14
14
Intek Report, United States Fuel Resiliency Part I – U.S. Fuels Supply Infrastructure, Prepared for the Office of
Energy Policy and Systems Analysis, June 2014.

8
U.S. Department of Energy
Washington, DC 20585
3.4 New petroleum pipeline capacity
As of April 2014, according to estimates developed by the North Dakota Pipeline Authority, rail
movements from North Dakota had declined to 630,000 Bbl/d from a peak of around 800,000 Bbl/d in
November 2013,15
while pipeline movements rose from around 200,000 Bbl/d in November 2013 to
nearly 400,000 Bbl/d.16
The Authority estimated pipeline capacity to be at 520,000 Bbl/d at the end of
2013, rising to 715,000 Bbl/d by the end of 2014 (Figure 7).17
Note that Figure 7 does not include the
Keystone XL pipeline, which has 100,000 Bbl/d of capacity reserved for Bakken crude.
Figure 7. U.S. Williston Basin Crude Oil Export Options (June 26, 2014)
3.5 Impacts of Increased Crude-by-Rail Transport
3.5.1 Competition between Commodities for Rail Access
Because of the highly condensed supply location, issues such as greater rail traffic, competition for
access, and resulting congestion have emerged. The growth in crude transport from the Bakken has used
much of the excess capacity that once existed in the railroad network. On the BNSF Railway, which
transports one-third of Bakken production, petroleum crude carloads grew 2118% from 2009 to 2013.18
Non-oil shippers are expressing growing concerns that the timely delivery of other commodities is being
impacted as railroads favor crude-by-rail movements.
15
North Dakota Pipeline Authority, Rail Transportation, http://northdakotapipelines.com/rail-transportation/. 16
Justin Kringstad, Energy Development and Transmission Committee, North Dakota Pipeline Authority, July 8,
2014. 17
North Dakota Pipeline Authority, Williston Basin Crude Oil Export Options, June 26, 2014,
https://ndpipelines.files.wordpress.com/2012/04/oil-table-6-26-20141.jpg. 18
Surface Transportation Board – Quarterly Freight Commodity Statistics. Accessed August 4, 2014,
http://www.stb.dot.gov/econdata.nsf/27dead93525f6773852578aa004bc24d/57ba1c23b6b1b4f885257b800066e4d4?
OpenDocument.
9
U.S. Department of Energy
Washington, DC 20585
Of particular concern in North Dakota is the effect of congested rail traffic on transport of agricultural
products. Rail service is an important transportation mode in the Bakken region for moving goods from
rural areas to inland waterways and markets.19
According to an April 2014 Grain Transportation report,
“[p]etroleum and intermodal have grown consistently since 2009, 315,203 and 603,162 carloads higher,
respectively, in 2013 than in 2009, with petroleum carloads doubling between 2012 and 2013. Together,
constrained supply and traffic growth have consumed the extra capacity in the network that existed in
previous years to handle any seasonal demand surges, such as the unexpected record harvest.” 20
A recent study by North Dakota State University Study found that high demand for grain shipments, a
very cold winter, and the increase in transportation of oil have resulted in grain piling up on the ground
outside elevators waiting for rail transportation, delayed grain deliveries, and increased costs of rail
transportation for farmers. 21
The study also states that farmers lost nearly $67 million in 2014 because of
rail shipment delays, and could lose an additional $95 million if the delays persist.22
At an April 2014 hearing held by the Surface Transportation Board (STB), farmers and grain producers
complained of long delays in the delivery of rail cars from the BNSF Railway Company and Canadian
Pacific (CP) Railway Company.23
Both BNSF and CP acknowledged difficulties in service due to extreme
winter conditions in the Midwest (which slowed train speeds, required shorter trains, and impacted
personnel) and an unexpected surge in grain exports.24
BNSF has stated that $1 billion of a reported $5
billion in investment will go to improve and expand rail capacity in states along the Northern Corridor,
which carries a significant amount of grain traffic.
In a July 18, 2014 report, BNSF said 6,329 of its wheat cars were listed as "past due" by an average of
24.2 days past a shipper's desired transport date. Some Midwestern utilities have also expressed concerns
about decreasing coal stockpiles in the first half of 2014 when rail operators couldn't deliver enough
coal.25
19
USDA “Rail Competition and its Importance to Agriculture,” Chapter 6 of Study of Rural Transportation Issues,
April 2008, http://www.ams.usda.gov/AMSv1.0/getfile?dDocName=STELPRDC5084090. 20
USDA, Agricultural Marketing Service. Grain Transportation Report, April 10, 2014,
Web: http://dx.doi.org/10.9752/TS056.04-10-2014. 21
Ed Clark, “Power Hour: Rail Woes Hammer Basis,” AgWeb, June 20, 2014,
http://www.agweb.com/mymachinery/article/power_hour_rail_woes_hammer_basis_NAA_Ed_Clark/. 22
USDA, Agricultural Marketing Service, Grain Transportation Report, May 22, 2014,
http://dx.doi.org/10.9752/TS056.05-22-2014. 23
Sara Wyant, “Slow go: Farmers, shippers concerned about impact of rail delays,” FarmForum.net, accessed July
1, 2014, http://m.farmforum.net/news/columnists/slow-go-farmers-shippers-concerned-about-impact-of-rail-
delays/article_2175d4ab-a939-59ef-a414-4f6be06f49de.html?mode=jqm. 24
Testimony of BNSF Railway, STB Hearing: Ex Parte 724, April 10, 2014,
http://domino.bnsf.com/website/updates.nsf/129f05ffade69bd20625696e006744f2/3cce5c82f1f473b686257cc40077
3569/$FILE/STB%20Testimony%204.10.2014.pdf. 25
Steve Raabe, “Shortage of rail capacity slowing Colorado shipments of coal, wheat,” The Denver Post, July 27,
2014, http://www.denverpost.com/Business/ci_26218754/Shortage-of-rail-capacity-slowing-Colorado-shipments-of-
coal-wheat.

10
U.S. Department of Energy
Washington, DC 20585
3.5.2 Crude-by-Rail Safety Concerns
In the past year, there have been a series of accidents involving freight trains carrying Bakken crude oil,
including the horrific Lac Megantic, Canada disaster of July 6, 2013.26
In response to these actions, the
U.S. Department of Transportation (USDOT) issued several emergency orders and called upon railroad
companies to take voluntary actions.27
In July 2014, USDOT issued a Notice of Proposed Rulemaking
proposing a range of measures to enhance the safety of shipping crude oil by rail, including inter alia,
proposing enhanced tank car standards, a classification and testing program for mined gases and liquids
and new operational requirments for high-hazard flammable trains that include braking controls and speed
restrictions. A companion Advanced Notice of Proposed Rulemaking was also issued seeking further
information on expanding comprehensive oil spill response planning requirements in shipments of
flammable materials.28
. Whatever the impact of the rule, public confidence in the safety of crude oil by by
rail is essential to the continued operation of crude oil trains. The proposed rule will help to make rail
movement safer, and will help to give the public assurance on rail safety.
4. Infrastructure Constraints: Natural Gas
4.1 Overview
Natural gas has fewer large scale transportation options than oil - it must be moved by pipeline. Once gas
leaves the wellhead, a pipeline gathering system transports much of the gas to a processing plant that
dehydrates the gas, extracts contaminants, and separates NGLs, then sends the gas to the mainline
transmission system. As Bakken gas is typically “wet,” with a high NGL ratio, it also needs to be
compressed at a compressor station before being sent to a gas processing plant.
26
A summary of recent accidents can be found in USDOT Emergency Order of May 7, 2014,
http://www.dot.gov/briefing-room/emergency-order. 27
Pipeline and Hazardous Materials Safety Administration (PHMSA), “Chronology,” accessed August 1, 2014,
http://www.phmsa.dot.gov/hazmat/osd/chronology. 28
PHMSA, Hazardous Materials: Enhanced Tank Car Standards and Operational Controls for High-Hazard
Flammable Trains, 49 CFR Parts 171, 172, 173, 174, and 179,
http://www.phmsa.dot.gov/pv_obj_cache/pv_obj_id_9F3CE4CB7A6FCBD43CE1757CD2E41F85A4C41000/filena
me/Signed_Proposed_Rulemaking-for_High-Hazard_Flammable_Trains.pdf.

11
U.S. Department of Energy
Washington, DC 20585
Source: EPRINC: Lighting up the Prairie: Economic Considerations in Natural Gas Flaring, Sept. 5, 2012, available at
http://eprinc.org/pdf/EPRINC-FLARINGECONOMICS-2012.pdf
Because oil cannot be produced without associated natural gas, the rapid development of oil production in
the Bakken has produced an abundance of natural gas. The unanticipated volume of gas production has
created an infrastructure challenge, with some production either unconnected to gas gathering systems or
exceeding the capacity of existing gathering infrastructure, including gathering pipelines, compressors to
allow the gas to be transported down the pipeline, and processing capacity.29
While gas processing plants
and transportation infrastructure are being built to handle the increase in gas production, construction has
not kept pace with Bakken oil production.
4.2 Natural Gas Production and Flaring
Due to the lack of sufficient infrastructure, in May 2014, 28% of the natural gas in North Dakota was
flared at the well site. Although oil is the principal economic driver of production in the Bakken, gas is a
valuable resource, contributing about 13% of a typical well’s economic value.30
As of late 2013,
estimated lost revenues from flaring natural gas in North Dakota exceeded $1 million per day based on
29
Natural Gas & Flaring, North Dakota Oil Can, http://www.northdakotaoilcan.com/NDenergyfacts/Flaring/;
Lighting up the Prairie: Economic Considerations in Natural Gas Flaring, Sept. 5, 2012,
http://eprinc.org/pdf/EPRINC-FLARINGECONOMICS-2012.pdf. 30
Phil Davies, “Dealing with Gas,” Fedgazette, April 2013,
http://www.minneapolisfed.org/publications_papers/pub_display.cfm?id=5085.
Figure 8. Process of transmitting natural gas from wellhead to end user.

12
U.S. Department of Energy
Washington, DC 20585
multiplying the daily flared quantity times the daily spot price of natural gas at the Henry Hub trading
point. In addition to the forfeited gas and liquids, there are substantial environmental costs to flaring.31
Producers may decide to flare natural gas because it allows for production of the more valuable crude oil
until associated gas infrastructure (gathering lines and processing capacity) is developed or for safety
purposes in case there is a power outage or explosion. The lack of gathering lines is due in part to the
following factors:
1) Wells may be inconveniently located for connection to an existing gas treatment plant;
2) Construction of gathering lines and treatment plants requires substantial lead time, in part due to
the need to obtain rights of way or easements;
3) Facilities sized to capture the first few months of early production may turn out to be too large;
and
4) Committing to a facility size ahead of well testing raises risks for producers.
Increasing natural gas gathering and processing capacity is necessary to reduce flaring, but it is not the
only factor contributing to the large volume of natural gas flaring in North Dakota.32
In some cases a
gathering line may exist, but with insufficient capacity. Flaring might occur due to excessive line
pressures, the need to loop existing pipeline systems,33
or mechanical problems.34
Mixing new high
pressure wells with older low pressure wells can shut gas from the older wells out of the gathering system
31
Rachael Seeley, “North Dakota flaring reduction policy may impact January production,” OGJ Special Projects,
July 15, 2014. 32
Justin Kringstad, “A Detailed Look at Gas Gathering.” 33
Looping is an alternative to adding additional compression. Parallel pipeline is installed adjacent to the existing
line to lower the flow resistance (and hence the pressure drop) to increase line throughput. 34
Id.
Figure 9. Comparison of natural gas flaring rate and processing capacity
13
U.S. Department of Energy
Washington, DC 20585
and force flaring. The flaring operator can bring in compressors to pump up his gas, or he can wait a few
months for the new well’s pressure to decline.
Additionally, the liquid rich Bakken gas sometimes condenses into liquid inside the pipeline, forming
clogs, which need to be pigged out by the gathering system operator. The high proportion of NGLs in the
produced gas also requires the construction of processing facilities, which require large capital
investments and take longer than pipelines alone.
A combination of infrastructure developments including advance planning, attention to permitting, and
increased investment is needed to achieve reductions in flaring. Reducing natural gas flaring in the
Bakken has become a state priority, with the state, industry, and a variety of stakeholders collaborating to
mitigate flaring. In September 2013, the North Dakota Petroleum Council (NPDC) formed a Flaring Task
Force (NDPC Task Force). The NDPC Task Force goals are to: 1) reduce flare volumes, 2) reduce
number of wells being flared, and 3) reduce duration of flaring before infrastructure is in place to capture
gas. The Three Affiliated Tribes also established a Flaring Task Force (TAT Task Force) to identify
unique drilling processes and capture of gas on the Fort Berthold Indian Reservation (FBIR) 35
that
contribute to the significant percentage of flaring on the FBIR.36
The NDPC Task Force initially identified a number of factors leading to flaring in the Bakken, including
the high surge of initial production followed by steep declines, liquids-rich gas, technology outpacing
production expectations, securing landowner permission, county and township zoning delays, a weather-
shortened construction season, hilly terrain, and limited construction crews.37
The Task Force determined
that the single biggest challenge to connecting gas was securing landowner permission for connection
activities. Like the NDPC Task Force, the TAT Task Force identified topography, geography, and
procurement of rights-of-ways and approvals as particular challenges for gas transport completion.38
These challenges are a particular concern because 40% of natural gas production is flared at oil wells on
the Fort Berthold Indian Reservation, compared to the state average of around 30%. 39
4.3 Actions Taken in the Bakken Region to Reduce Flaring
In May 2014, the North Dakota Industrial Commission (NDIC), which regulates drilling and production
of oil and natural gas, released a notice announcing new requirements for applications to drill in the
Bakken and Three Forks. Under that notice, oil companies are required to submit a Gas Capture Plan with
35
The FBIR, home to members of the Mandan, Hidatsa, and Arikara, known as the Three Affiliated Tribes,
produced more than 170, 000 barrels a day in May 2014. 36
Three Affiliated Tribes Flaring Task Force Report and Recommendations, February 20, 2014,
http://www.mhanation.com/main2/departments/mha_energy_division/mha_energy_website/Flaring%20Task%20Fo
rce%20Recommendations%20Report.pdf 37
North Dakota Petroleum Council, North Dakota Industrial Commission – NDPC Flaring Task Force, presentation,
January 29, 2014, http://www.ndoil.org/image/cache/NDPC_Flaring_Task_Force_NDIC_1-29-14_fnlv1.pdf. 38
Three Affiliated Tribes Flaring Task Force Report and Recommendations, February 20, 2014,
http://www.mhanation.com/main2/departments/mha_energy_division/mha_energy_website/Flaring%20Task%20Fo
rce%20Recommendations%20Report.pdf 39
North Dakota Petroleum Council, North Dakota Industrial Commission – NDPC Flaring Task Force, presentation,
January 29, 2014, http://www.ndoil.org/image/cache/NDPC_Flaring_Task_Force_NDIC_1-29-14_fnlv1.pdf.
14
U.S. Department of Energy
Washington, DC 20585
drilling permit applications with the goal of improving communication and planning between producers
and midstream companies.40
The NDIC followed that public announcement by issuing new rules in June
2014 to reduce the volume of gas being flared in the state. The regulations, which are consistent with the
recommendations of the NDPC Task Force, set targets to reduce flaring to 26% of total gas production by
October 2014, 23% by January 2015, and 10% by 2020. Companies that fail to meet their targets will
face penalties, including potential production curtailments.41
According to the NDIC, the BLM agreed
informally that it would enforce these anti-flaring rules on federally managed lands.42
The Three
Affiliated tribes also have established similar rules.43
The industry is also taking actions to address flaring, both to take advantage of the byproducts otherwise
being flared and to ensure compliance with the new regulations. Producers are making substantial
investments in midstream infrastructure and developing innovative technologies to capture the gas.
Natural gas gathering and processing infrastructure has been expanding and will continue to grow.
According to the NDPC, nearly $6 billion has been invested by the natural gas capture industry since
2006. Since that time, the industry has built more than 9,555 miles of gas gathering pipe, 1.259 bcf/d of
gas processing, and increased export capacity for residue gas and NGLs.
Processing plant capacity increased from 227 mmscf/d in 2006 to 1,024 mmscf/d in 2013. At present,
there are 21 gas treatment plants with capacities ranging from 0.5 – 250 mmscf/d.44
The North Dakota
Pipeline Authority projects processing capacity to increase to 1694 mmscf/d by the end of 2015.45
As of January 2014, publically announced future investment for 2014-2015 reportedly included over $1.7
billion of new infrastructure, including more than 1000 miles of gas gathering pipe, 400 MMcfd gas
processing, 75,000 bbls NGL export, 400 MMcfd gas export, 400 miles of export pipe, and 375 miles of
natural gas pipe. 46
In July, ONEOK Partners, the largest independent operator of natural gas gathering
and processing facilities in the Williston Basin, announced plans to invest up to $785 million on a new
processing facility, additional natural gas compression, and 12 miles of NGL pipelines. 47
Hess
40
James MacPherson, “Natural Gas Flaring In North Dakota To Be Significantly Reduced By 2020,” AP, July 1,
2014, http://www.huffingtonpost.com/2014/07/02/north-dakota-natural-gas-flaring_n_5549457.html. 41
Chester Dawson, “North Dakota Regulator Sets New Gas-Flaring Rules,” Wall Street Journal, July 1, 2014,
http://online.wsj.com/articles/north-dakota-regulator-sets-tough-gas-flaring-rules-1404257684. 42
Richard Nemec, “North Dakota, BLM to Cooperate on New Flaring Rules,” NGI’s Shale Daily, May 15, 2014,
http://www.naturalgasintel.com/articles/98384-north-dakota-blm-to-cooperate-on-new-flaring-rules.The BLM-
Montana/Dakotas manages 58,000 surface acres of public land in North Dakota and has oil and gas management
responsibilities for 1,421,000 million Federal subsurface and 568,000 leased Indian Trust subsurface acres in the
state. The BLM also is the lead agency for permitting, inspection, and enforcement activities for both Federal and
Tribal resources in the Bakken. 43
Id. 44
North Dakota Pipeline Authority, Natural Gas Processing Capacity, Million Cubic Feet Per Day,
https://ndpipelines.files.wordpress.com/2012/06/nd-gas-plants-8-5-2014.jpg. 45
Id. 46
North Dakota Petroleum Council, presentation to Task Force; “In North Dakota, oil bonanza leaves natural gas
going up in smoke,” Midland Reporter-Telegram, July 27, 2014, http://www.mrt.com/business/article_1d5ef29e-
160b-11e4-8329-001a4bcf887a.html. 47
ONEOK Partners, “ONEOK to Add Gas Plant, Related Infrastructure in North Dakota,” press release, July 30,
2014,
15
U.S. Department of Energy
Washington, DC 20585
Corporation announced expansion of its Tioga Plant, which, according to reports, will effectively triple its
gas processing capacity.48
Industry is also investing in technology to use the natural gas produced from newly drilled wells until
output stabilizes and gathering lines can be completed. Some technologies include converting natural gas
to liquid fuels, mobile NGL extraction, producing fertilizer from wellhead natural gas, or developing
onsite electrical generation. For example, Statoil is partnering with GE and Ferus Natural Gas Fuels to
capture gas at the wellhead, strip out valuable NGLs, compress it into CNG, and then use CNG to power
hydraulic fracturing rigs, trucks and other equipment.49
Primus Green Energy Inc. has developed a small-
scale gas-to-liquids technology, which employs modular units that can be transported for use where no
pipeline infrastructure exists.50
5. Infrastructure Constraints - Local
5.1 Electric Power Constraints
5.1.1 Overview
In 2013, 79% of North Dakota's net electricity generation came from coal, almost 16% came from wind
energy, and about 5% came from conventional hydroelectric power sources, provided by the state's one
hydroelectric power plant at the Garrison Dam. North Dakota has one of the top wind resources in the
U.S., with average wind speeds ranging from 10 to 13 miles per hour, 51
ranks 6th in the nation in the
percentage of electricity generation provided by wind energy, ranks 12th in installed capacity, and has
wind resource potential capable of providing the state's current electricity needs many times over. About
one-tenth of the electricity generated in the state comes from independent power producers. Because
North Dakota produces more electricity than it consumes, almost three-fifths of its total electricity supply
is provided to the interstate electricity trade. Two high-voltage direct current (DC) lines carry electricity
east into Minnesota. As a net exporter of electricity, transmission lines are a key component of
developing North Dakota’s wind resources.52
The reliability of the North Dakota power industry is overseen by the Midwest Reliability Organization
(MRO), one of the eight regional entities of the North American Electric Reliability Corporation (NERC).
The Midwest Independent Transmission System Operator, Inc. (MISO) operates much of the state's
48
North Dakota Pipeline Publication, Vol, 6, June 2014, https://ndpipelines.files.wordpress.com/2012/04/ndpa-
newsletter-v6i3-may-2014.pdf ; Arjun Sreekumar, “Things Are About to Change in the Bakken, But These 2
Companies Aren't Worried,” The Motley Fool, http://www.fool.com/investing/general/2014/07/31/things-are-about-
to-change-in-the-bakken-but-these.aspx; . https://ndpipelines.files.wordpress.com/2012/04/ndpa-newsletter-v6i3-
may-2014.pdf 49
Id. 50
http://www.prnewswire.com/news-releases/primus-green-energy-announces-small-scale-stg-solution-for-flared-
gas-applications-261808521.html 51
DOE/EIA, North Dakota State Energy Profile, updated March 27, 2014,
http://www.eia.gov/state/print.cfm?sid=ND. 52
Alexandra Klass and Elizabeth Wilson, Interstate Transmission Challenges for Renewable Energy: A Federalism
Mismatch,” Vanderbilt Law Review, Vol. 65:6:1801–1873, 2012.
http://www.vanderbiltlawreview.org/content/articles/2012/11/KlassWilson_65_Vand_L_Rev_1801.pdf.

16
U.S. Department of Energy
Washington, DC 20585
electricity grid. North Dakota's rural electric cooperatives and investor-owned utilities serve the largest
number of customers. Municipal utilities and the Western Area Power Administration (a federal power
marketing authority) serve a smaller share of the state's electric power customers.53
5.1.2 Oil and Gas Production Driving Demand
Increased oil and natural gas production in North Dakota since 2010 has driven the state's growth in
industrial demand for electricity. Rising economic activity and population in the state have also increased
commercial and residential electricity use, although at a lower rate than in the industrial sector (Figure
10).54
Figure 10. North Dakota electricity sales by sector (rolling 12-month average). Source: U.S. Energy Information Administration, Electric Power Monthly.
Note: Rolling 12-month averages are the average of the preceding 12 months of data, to adjust for seasonality in the volume of
electricity sales.
A 2012 study commissioned by the North Dakota Transmission Authority forecasted an 89% increase in
total electric demand in the state between 2012 and 201, primarily due to: (1) adding oil and natural gas
wells; (2) building and operating more infrastructure to support oil and natural gas production, including
well pads, pumps, compressor stations, saltwater disposal sites, processing plants, and rail load facilities,
and (3) growing population and employment.55
The study projects electric demand for 22 North Dakota
counties will more than triple from 971 MW in 2012 to 3,030 MW in 2032,56
the bulk of which will be
used to power large commercial and industrial needs. The continuing increases represent, in part,
53
DOE/EIA, North Dakota State Energy Profile, updated March 27, 2014,
http://www.eia.gov/state/print.cfm?sid=ND. 54
DOE/EIA, “Industrial sector drives increase in North Dakota electricity sales,” Today in Energy, May 8, 2013,
http://www.eia.gov/todayinenergy/detail.cfm?id=11171. 55
KLJ, Power Forecast 2012, Williston Basin Oil and Gas Related Electrical Load Growth Forecast
http://www.nd.gov/ndic/ic-press/Power2012.pdf. 56
KLJ, Power Forecast 2012, Williston Basin Oil and Gas Related Electrical Load Growth Forecast, North Dakota
Summary, http://www.nd.gov/ndic/ic-press/PowerES.pdf.

17
U.S. Department of Energy
Washington, DC 20585
maturing oilfield development and near completion of pipeline build out.57
The study also forecasts a 52%
population increase in the state by 2032, with the greatest population growth occurring in the oil-
producing counties over the next 10 years. Rural areas are anticipated to experience the largest gains in
power demand.
The 2014 North American Electric Reliability Corporation (NERC) power load forecast also indicates
growth in the northwestern North Dakota area primarily as a result of development of the Bakken
Formation.58
The concentration of wells in the rural Northwest means that the oil boom has fallen on three
distribution rural electric cooperatives: Burke Divide, Mountrail-Williams, and McKenzie.59
The boom
has likely put considerable pressure on their distribution systems, since wells, gas processing plants, rail
and pipeline terminals are scattered across the landscape and have distinctive load patterns.
The 2014 summer assessment forecast for Basin Electric Power Cooperative (BEPC) includes 147 MW of
projected year-over-year demand growth compared to the 2013 actual summer peak. 60
In response to
increasing load growth, the Integrated System (IS) - consisting of transmission facilities owned by
Western Area Power Administration, Basin Electric Power Cooperative and Heartland Consumers
Power District – conducted studies that indicate the need for a new 345-kV transmission line and
associated substation additions and upgrades to serve the long-term needs of northwestern North
Dakota.61
Additionally, two new 100 MW generation plants are proposed for the summer of 2016 that
will help offset any delays in the 345 kV transmission project and will help ensure that the load serving
needs of the region will continue to be met.62
5.1.3 Exporting North Dakota’s Wind Resources
The growing residential and industrial demand for electricity and the current constraints are limiting
North Dakota’s ability to take full advantage of its wind resources. According to the MISO Multi-Value
Project report, during some hours, low-cost generation in Western MISO cannot reach consumers in
Eastern MISO because there is insufficient transmission to move all of that power to Eastern MISO
customers.63
As a result, grid operators must operate higher-priced power plants in Eastern MISO,
57
Id. 58
NERC, 2014 Summer Reliability Assessment, May 2014,
http://www.eenews.net/assets/2014/05/14/document_gw_01.pdf. 59
DOE/EIA, Electricity Data, http://www.eia.gov/electricity/data.cfm#sales. Rural electric cooperatives are non-
profit, untaxed organizations owned by their customers. They typically receive financing through long-term loans
issued by the Rural Utilities Service, USDA, and typically buy power from smaller numbers of specialized “G&T”
cooperatives owned by the distribution-only cooperatives. 60
2013 Bakken Area Long Range Transmission Study, Executive Summary,
http://www.oatioasis.com/WAPA/WAPAdocs/2013_Bakken_Area_Long_Range_Transmission_Study_Executive_S
ummary.pdf. 61
Bakken Area Long Range Transmission Study, November 16, 2012,
http://www.oatioasis.com/WAPA/WAPAdocs/2012_Bakken_Long_Range_Study_11-16-12.pdf. 62
Bakken Update, July 2014, http://www.oatioasis.com/WAPA/WAPAdocs/Bakken_Update_July_2014.pdf. 63
https://www.misoenergy.org/Library/Repository/Study/Candidate%20MVP%20Analysis/MVP%20Portfolio%20A
nalysis%20Full%20Report.pdf

18
U.S. Department of Energy
Washington, DC 20585
reflected in the higher prices there. Lower-cost power plants in Western MISO could have produced more
electricity, but are prevented from doing so by the lack of transmission to Eastern MISO.
In some cases, this lack of transmission results in wind plants in Western MISO having their output
reduced, in the form of wind curtailment, so that zero-fuel cost and zero-emission wind electricity that
could have replaced more expensive fossil generation in Eastern MISO must be discarded because there is
insufficient transmission to transport it to market. Transmission coming online between 2015 and 2020 in
the Midwest ISO Multi-Value Projects, however, may provide more opportunities for exporting this
power.64
5.2 Truck Transport of Petroleum
As of September 2013, about 44% (405,000 Bbl/d) of North Dakota petroleum was delivered to rail and
pipeline terminals by truck, requiring about 2,000 trips per day, and consuming at least 7 million gallons
of diesel fuel per year. Truck delivery would typically cost at least a $1.50 per barrel, and might be
considerably higher.65
Pipeline gathering systems continue to expand. In May, Tesoro announced the
development of a 60,000 Bbl/d, $150 million gathering system in Dunn County.66
A calculated unit cost
for this system would average less than $0.50 per barrel transported.
Nonetheless, truck delivery persists because of a range of challenges:
1) Some wells may be inconveniently located for connection to a gathering system;
2) Lead times for deploying gathering line, especially multi-party systems, may be months or years;
3) Some or most producers in a particular area must be willing to make a long-term commitment to
a new multi-party gathering system;
4) Once the system is in place, producers are locked in to delivering their crude to a particular
pipeline. Trucking offers more flexibility;
5) Building gathering line capacity for initial high-rate production may be uneconomic.
5.3 Road Traffic
Each Bakken well requires on the order of 2,000 truckloads of material.67
Thus, drilling 2,200 wells per
year implies some 4.4 million truck round trips, each of 50-100 miles, implying some 200-440 million
64
DOE Office of Energy Efficiency & Renewable Energy, 2013 Wind Technology Market Report. 65
The American Transportation Research Institute estimates the national level operating costs of an intercity truck at
$1.63 per mile in 2013. This includes fuel but does not include recovery of the capital cost of the truck, the
operator’s profit, and premium associated with market conditions. Based on a 100-mile round trip and 200 barrels
per load, and guessing at other costs, it is unlikely that the cost would be much less than $1.50 per barrel. An
Analysis of the Operational Costs of Trucking: A 2013 Update, American Transportation Research Institute, Sept.
2013. 66
North Dakota Pipeline Authority, The Pipeline Publication Vol. 6, June 2014,
https://ndpipelines.files.wordpress.com/2012/04/ndpa-newsletter-v6i3-may-2014.pdf 67
Each rig is broken down into 800 truckloads of equipment when it moves locations, and each appears to drill a new
well more often than once per month. Each fracking job requires 3 million gallons of water (350 truckloads) and 4
million pounds of sand (500 truckloads). In addition, a drilling rig will burn 1,500–3,000 gallons of diesel per day,
requiring five or six truckloads of fuel per well.

19
U.S. Department of Energy
Washington, DC 20585
heavy truck vehicle miles traveled (VMT). Trucks transporting crude oil to rail or pipeline terminals add
another 2,000 trips per day and a further 36 million VMT per year.68
North Dakota VMT increased by 22% (2 billion miles) between 2008 and 2012, and truck traffic in
Western North Dakota appears to have doubled.69
There has been a significant impact on pavement
conditions and traffic congestion throughout the State.70
The North Dakota Department of Transportation
will be undertaking multiple projects to relieve rural road congestion caused by the influx of trucks and
personnel.
Road safety has been affected by the boom as well. Fatal accidents increased 66-percent, to 147, “trailer
trucks” were involved in 35 of the 147 fatal accidents.71
5.4 Local Petroleum Supply Infrastructure
Petroleum consumption in North Dakota increased 40% between 2007 and 2012, to 101,000 Bbl/d.72
Oil
company customers account for 200 million gallons (13,000 Bbl/d), and on-road diesel accounted for 375
million gallons (24,000 Bbl/d).73
There is only one oil refinery in North Dakota, Tesoro Corporation’s
Mandan refinery, with a capacity recently upgraded to 72,000 Bbl/d.74
In addition, two small topping
plants have been announced: the 20,000 Bbl/d Dakota Prairie Refinery in Dickinson, just south of the
Bakken, and Quantum Energy’s proposed 20,000 Bbl/d refinery in East Fairview, ND.75
Both new
refineries are aimed at making diesel for local markets. Construction for the Dakota Prairie Plant began in
2013, with completion in twenty months.
68
In the absence of a crude oil gathering line, two tanker trips per day are required to handle initial production,
declining to a truck every two to four days after a few years. Two tanker trucks per day will be required to move
crude for new wells, with the number declining over a few years to a truck every few days. As of September 2013,
some 44% (410,000 bb/d) of North Dakota crude oil production was delivered to crude or rail terminals by truck
North Dakota Pipeline Authority 2014. 69
Grant Levi, “Western ND Meeting,” presentation of the North Dakota Department of Transportation (NDDOT),
February 14, 2014, http://www.ndenergy.org/usrfiles/lr/Western%20ND%20Grant%20Levi%2002192014.pdf. 70
The NDDOT receives about $240 million in annual highway funding through MAP-21 and intends to expend
about $2.4 billion of State funds on roads over the next two years. NDDOT indicates that the North Dakota
construction cost index has increased by a factor of 2.35 since 2005, which has increased the cost of maintaining the
road system. Id. 71
NDDOT, “2012 North Dakota Crash Summary,” http://www.dot.nd.gov/divisions/safety/docs/crash-summary.pdf. 72
DOE/EIA, State Energy Data Report, updated July 17, 2014,
http://www.eia.gov/state/data.cfm?sid=ND#ConsumptionExpenditures. 73
DOE/EIA, Fuel Oil & Kerosene Sales, updated November 15, 2013,
http://www.eia.gov/dnav/pet/pet_cons_821dst_dcu_SND_a.htm. 74
DOE/EIA, Petroleum and Other Liquids, Number and Capacity of Petroleum Refineries, updated June 25, 2014,
http://www.eia.gov/dnav/pet/pet_pnp_cap1_dcu_SND_a.htm. 75
Calumet, Dakota Prairie Refining – Dickinson, North Dakota, http://www.calumetspecialty.com/about-
us/facilities/dakota-prairie-refining; OGJ, “Second Small Refinery Planned for North Dakota,” March 21, 2014,
http://www.ogj.com/articles/2014/03/second-small-diesel-refinery-planned-for-north-dakota.html.

20
U.S. Department of Energy
Washington, DC 20585
In addition to refiners, a firm called North Dakota LNG has announced plans to construct a 10,000 gallon
per day LNG plant, primarily aimed at the drilling rig market, to be operational by summer, 2014.76
This
is equivalent to about 2.2 million gallons of diesel per year, or 144 Bbl/d. The firm indicates that it plans
to expand capacity to 76,000 gallons per day by 2015.
While there are several petroleum products pipelines in North Dakota, they are not designed to deliver
products to northwestern North Dakota. All deliveries are by truck from Bismarck (a round-trip distance
of about 450 miles to Williston, a 260 mile round trip to Dickinson, and a 70 mile round trip to the
Quantum Energy facility). The distances and costs suggest that, as in other areas of the Bakken, there is
scope for further optimization of infrastructure.
6. Key Questions for Public Input
Key questions raised for stakeholder input regarding infrastructure constraints in the Bakken region
include:
1. What federal executive policy changes or legislative changes, if any, should be adopted to
meet infrastructure challenges?
2. What federal research and development goals should be adopted to meet infrastructure
challenges?
3. What are the hurdles to building additional transmission, storage, and distribution capacity in
the Bakken?
4. Are efforts underway in this region to address the constraints identified in this paper that have
not been addressed here?
5. Are there additional constraints both now and anticipated through 2030 that are not
mentioned in this paper? What are they? Are there efforts underway in the region to address
those constraints?
6. What are the most effective greenhouse gas reduction policies associated with energy
transmission, storage, and distribution in the Bakken?
7. How can the federal government work with states, tribes and the private sector to address
infrastructure issues in the Bakken?
76
North Dakota Pipeline Publication, Vol, 6, June 2014, https://ndpipelines.files.wordpress.com/2012/04/ndpa-
newsletter-v6i3-may-2014.pdf ; Richard Nemec, “North Dakota to Get First LNG Production Facility,” May 8,
2014, http://www.naturalgasintel.com/articles/98319-north-dakota-to-get-first-lng-production-facility