1 Intro to Excel Spreadsheets Nancy Clark FSU College of Medicine.
37
1 Intro to Excel Spreadsheets Nancy Clark FSU College of Medicine
-
Upload
julian-booton -
Category
Documents
-
view
217 -
download
1
Transcript of 1 Intro to Excel Spreadsheets Nancy Clark FSU College of Medicine.

1
Intro to Excel Spreadsheets
Nancy Clark
FSU College of Medicine

2
What are they used for?
Financial forecasting Statistical analysis Data collection Data manipulation Summarizing data Communicating data
Budgets Research Gradebook Charts Big tables Job aids

3
Spreadsheet Construction
Columns (letters) Rows (numbers) Worksheets Cells (E9)
Cell Addre
ss

4
Mousing Around a Cell
Highlight/SelectMove ContentsFill Contents
Mon Tue

5
Cell Formats
Words Numbers
# decimal places $ %
Days/Dates Formulas Calculations…
45.271945.3$45.27.271927%5-Mar-025-Mar3/5/2002STUDENT

6
Formulas
=A2+B2+C2 =SUM(A2:AS2)
$29.00 $1,886.00
Formula
Results
AutoSum
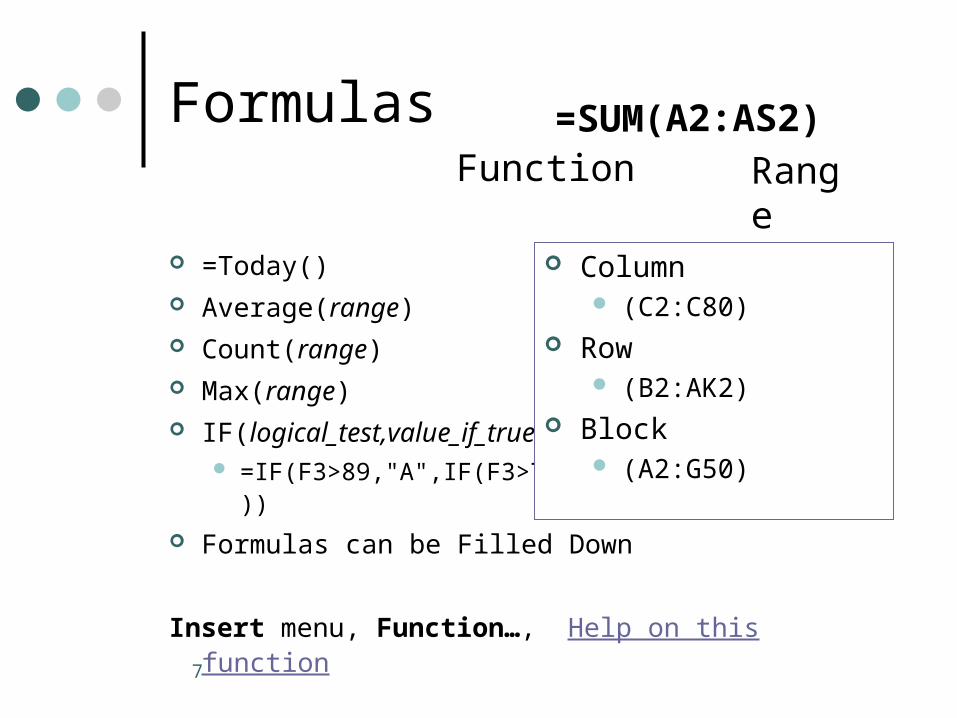
7
Formulas
=Today() Average(range) Count(range) Max(range) IF(logical_test,value_if_true,value_if_false)
=IF(F3>89,"A",IF(F3>79,"B",IF(F3>69,"C","F")))
Formulas can be Filled Down
Insert menu, Function…, Help on this function
Column (C2:C80)
Row (B2:AK2)
Block (A2:G50)
=SUMFunction Range
(A2:AS2)

8
More on Cell Formats
Alignment Word wrap Orientation Shrink to fit Font

9
More on Cell Formats
Width
Height

10
Merging and Splitting
Add to Formating Toolbar Highlight cells to merge Click Merge Button Unmerge

11
Copying and Pasting
Highlight cells Hit Copy (CTRL-C) Dotted lines Click on target cell
Top of area Hit Paste (CTRL-V) Unless still dotted not
in Clipboard CTRL to select multiple
targets

12
Worksheets
Open U:\Nancy Clark\Spreadsheets\Handbase Pt
Encounters.xls

13
Sorting Data
Entire worksheet of tabular data with headingsData menu, Sort…
Small section of worksheetHighlight sectionHit sort button

14
Formulas that Reference Other Worksheets
=COUNT(Allison!B2:Allison!B100)Allison!B2 -- cell B2 on sheet Allison

15
Copying Worksheets
Edit menu Move or copy sheet…
1
2
3

16
Adding and Deleting Sheets
To add a sheet Insert menu
Worksheet
To delete a sheet Edit menu
Delete sheet

17
Page Setup (Format)
Landscape or Portrait Print to 1 page wide Margins Headers and Footers Print Titles

18
Making Sheets Pretty
Do it yourself methodFill ColorFont ColorsBorders toolbar
Autoformat (Format) Conditional Formatting

19
Charts
Visual representations of data
Select Data Insert menu,
Chart…

20
Charts – Step 1

21
Charts – Step 2

22
Charts – Step 3
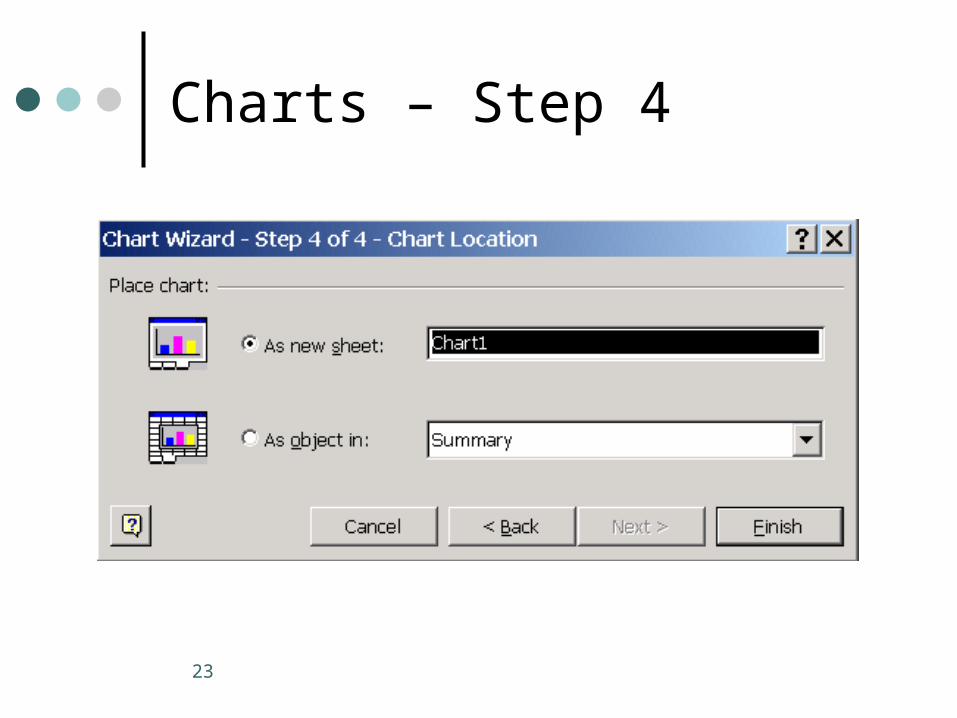
23
Charts – Step 4
24
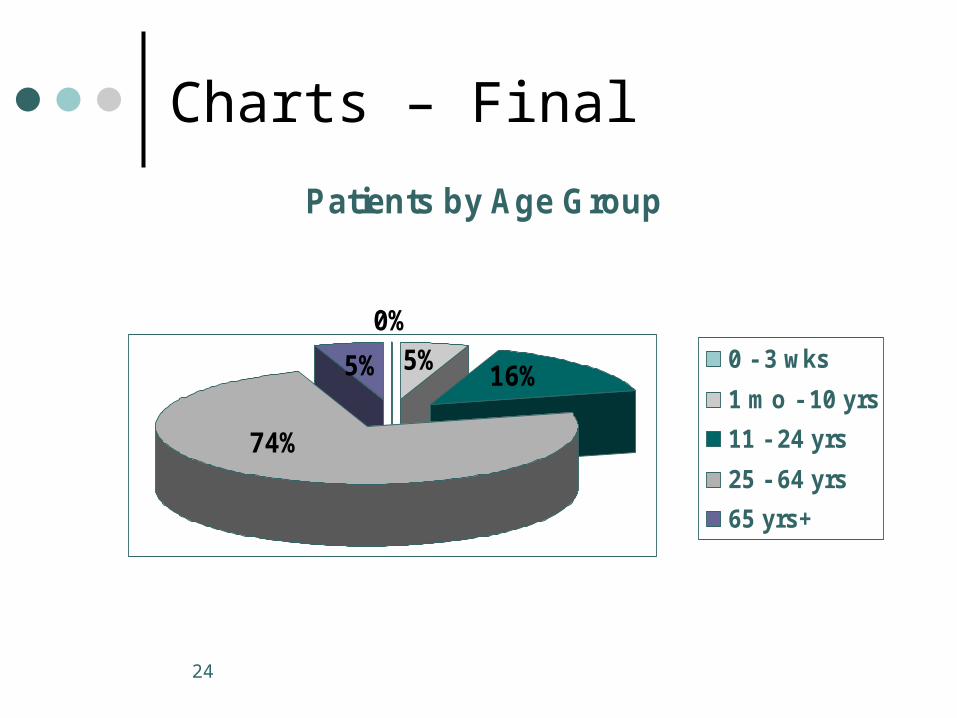
Charts – Final
Patients by Age Group
0%
5% 5%
74%
16% 0 - 3 wks
1 mo - 10 yrs
11 - 24 yrs
25 - 64 yrs
65 yrs+
25
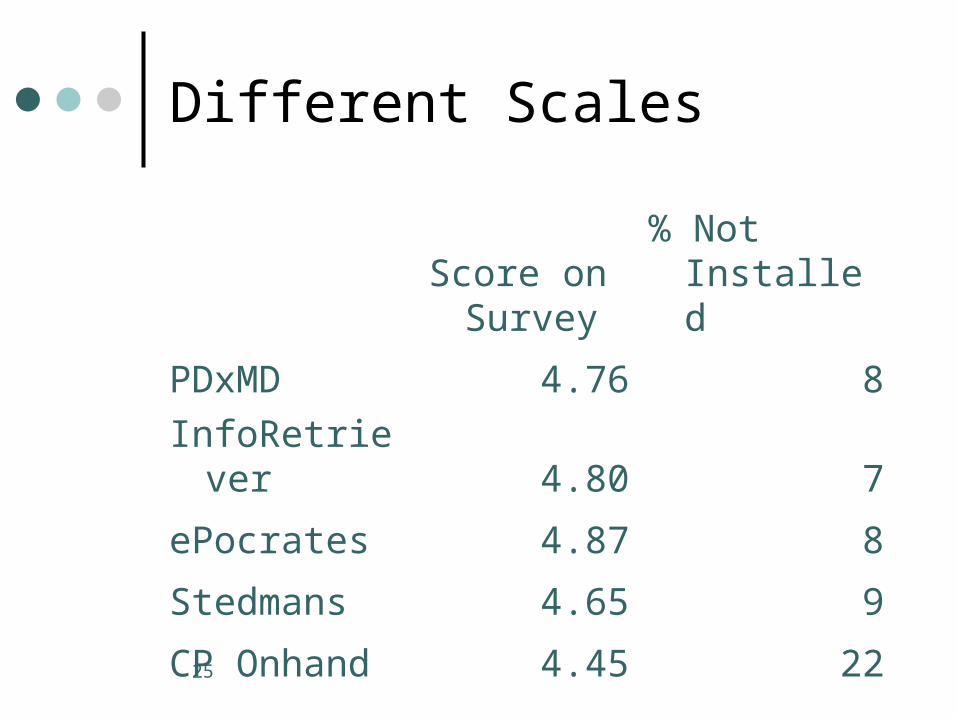
Different Scales
Score on Survey
% Not Installed
PDxMD 4.76 8
InfoRetriever 4.80 7
ePocrates 4.87 8
Stedmans 4.65 9
CP Onhand 4.45 22

26
PDA Software
0
5
10
15
20
25
PDxMD InfoRetriever ePocrates Stedmans CP Onhand
Score on Survey
% Not Installed

27
Printing
Always Print Preview Page Setup Select Print Area
Highlight area File, Set Print Area File, Clear Print Area

28
Insert Excel Spreadsheets
Copy and Paste Use Insert Microsoft Excel Worksheet
button Double click on table or chart Calls up Excel

29
Suggestion for Spreadsheet
Summarize your patient data No data? Do the composite. Do a chart of some part of the data Put the data sheet in as well 3 sheets:
DataSummaryChart

30
Statistical Analysis
Using Excel

31
Descriptive Statistics
Distribution frequency
distribution Histogram
Central tendency Mean Median mode
Dispersion Range Standard deviation Variance
N Not P (inferential
stats)

32
Central Tendency
Mean =AVERAGE(b2:b1500)
Median =MEDIAN(A2:A7)
Mode =MODE(A2:A7)
N =COUNT(A2:A1500) =COUNTBLANK(A2:B5)

33
Dispersion
Range=MAX(A2:A60)- MIN(A2:A60)
Standard deviation=STDEV(A2:A110)
Variance=VAR(A2:A110)

34
Distribution
Frequency distributionNot easy – use SPSSFREQUENCY(data_array,bins_array)Use help
HistogramBar chart of frequency table
35
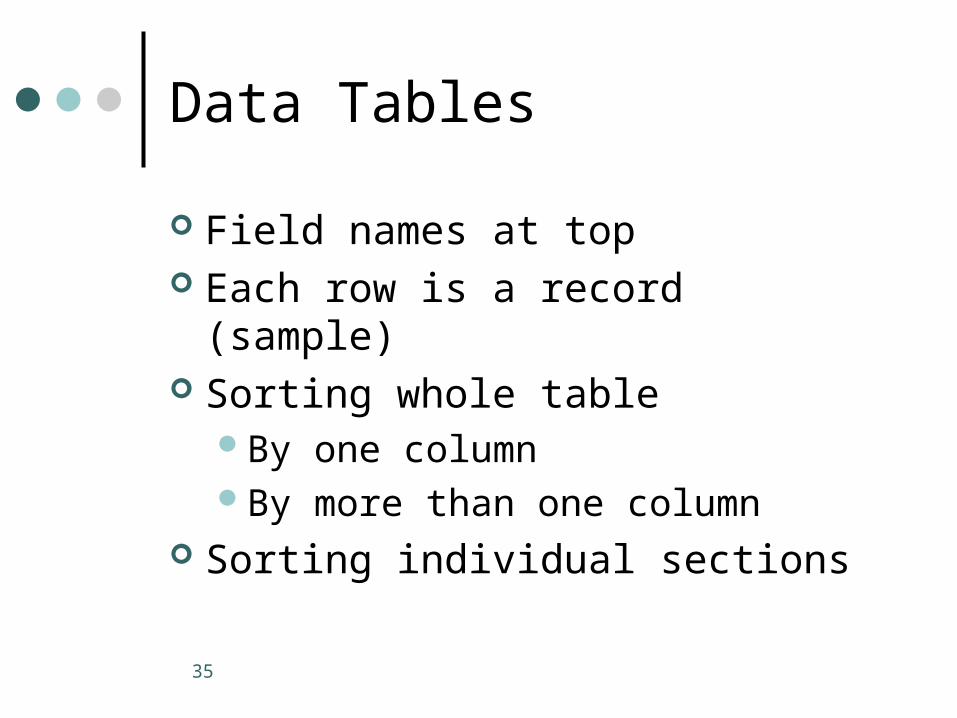
Data Tables
Field names at top Each row is a record (sample) Sorting whole table
By one columnBy more than one column
Sorting individual sections

36
Hands on experience
Analyze data in examples.xls

37
Sensitivity, Specificity
sensitivity =
a / (a+c) specificity =
d / (b+d)
Patients with disease
Patients without disease
Test is positive a bTest is negative c d