1 INTERPRETATIVE SUMMARY2 3 Applying additive logistic ...eibe/pubs/DETECTING... · 1 1...
30
1 1 INTERPRETATIVE SUMMARY 2 3 Applying additive logistic regression to data derived from sensors monitoring 4 behavioral and physiological characteristics of dairy cows to detect lameness 5 By Kamphuis et al., page XXXX. Lameness negatively impacts cow welfare and decreases 6 farm profitability. Detecting lame cows visually is difficult and will become more 7 challenging as herd sizes are increasing. Automated detection of lame cows may be a viable 8 aid or alternative to visual detection. The hypothesis was that data derived from sensors 9 monitoring behavioral and physiological characteristics of dairy cows are useful to automate 10 the detection of lameness. Univariable and multivariable models were developed using a 11 data-mining technique. The multivariable model outperformed the univariate models but still 12 the detection performance was not sufficiently high to warrant implementation in practice on 13 large, pasture-based, dairy farms. 14
Transcript of 1 INTERPRETATIVE SUMMARY2 3 Applying additive logistic ...eibe/pubs/DETECTING... · 1 1...

1
1
INTERPRETATIVE SUMMARY 2
3
Applying additive logistic regression to data derived from sensors monitoring 4
behavioral and physiological characteristics of dairy cows to detect lameness 5
By Kamphuis et al., page XXXX. Lameness negatively impacts cow welfare and decreases 6
farm profitability. Detecting lame cows visually is difficult and will become more 7
challenging as herd sizes are increasing. Automated detection of lame cows may be a viable 8
aid or alternative to visual detection. The hypothesis was that data derived from sensors 9
monitoring behavioral and physiological characteristics of dairy cows are useful to automate 10
the detection of lameness. Univariable and multivariable models were developed using a 11
data-mining technique. The multivariable model outperformed the univariate models but still 12
the detection performance was not sufficiently high to warrant implementation in practice on 13
large, pasture-based, dairy farms. 14

2
DETECTING LAME COWS AUTOMATICALLY 15
16
Applying additive logistic regression to data derived from sensors monitoring 17
behavioral and physiological characteristics of dairy cows to detect lameness 18
19
C. Kamphuis,*,1
E. Frank,† J.K. Burke,
* G.A. Verkerk,
* and J.G. Jago,
* 20
21
*DairyNZ Ltd., Private Bag 3221, Hamilton 3240, New Zealand 22
†Department of Computer Science, University of Waikato, Private bag 3105, Hamilton 3240, 23
New Zealand 24
25
1Corresponding author: C. Kamphuis, Private Bag 3221, Newstead, Hamilton 3240, New 26
Zealand, phone: +64 (0)7 858 3750, fax: +64 (0)7 858 3751, email: 27
29

3
ABSTRACT 30
The hypothesis was that sensors currently available on-farm that monitor behavioral and 31
physiological characteristics have potential for the detection of lameness in dairy cows. This 32
was tested by applying additive logistic regression to variables derived from sensor data. Data 33
were collected between November 2010 and June 2012 on five, commercial, pasture-based, 34
dairy farms. Sensor data from weigh scales (live-weight), pedometers (activity) and milk 35
meters (milking order, unadjusted and adjusted milk yield in the first two minutes of milking, 36
total milk yield, and milking duration) were collected at every milking from 4,904 cows. 37
Lameness events were recorded by farmers who were trained in detecting lameness before 38
the study commenced. A total of 318 lameness events affecting 292 cows were available for 39
statistical analyses. For each lameness event, the lame cow’s sensor data for a time period of 40
14 days prior to observation date were randomly matched by farm and date to 10 healthy 41
cows, i.e., cows that were not lame and had no other health event recorded for the matched 42
time period. Sensor data relating to the 14-day time periods were used for developing 43
univariable (using one source of sensor data) and multivariable (using multiple sources of 44
sensor data) models. Model development involved the use of additive logistic regression by 45
applying LogitBoost with a regression tree as base learner. The model’s output was a 46
probability estimate for lameness given the sensor data collected during the 14-day time 47
period. Models were validated using leave-one-farm-out cross validation and as a result of 48
this validation each cow in the dataset (318 lame and 3,180 non-lame cows) received a 49
probability estimate for lameness. Based on the area under the curve (AUC), results indicated 50
that univariable models had low predictive potential with the highest AUC values found for 51
live-weight (AUC = 0.66), activity (AUC = 0.60), and milking order (AUC = 0.65). 52
Combining these three sensors improved AUC to 0.74. Detection performance of this 53
combined model varied between farms but it consistently and significantly outperformed 54

4
univariable models across farms at a fixed specificity of 80%. Still, detection performance 55
was not high enough to be implemented in practice on large, pasture-based, dairy farms. 56
Future research may improve performance by developing variables based on sensor data of 57
live-weight, activity, and milking order but that better describe changes in sensor data 58
patterns when cows go lame. 59
60
Key words: sensor data, data mining, dairy cow, lameness detection 61
62
INTRODUCTION 63
Lameness has been grouped with mastitis and infertility as the top three dairy cow health 64
issues related to economic losses in the dairy industry (Juarez et al., 2003). Lameness affects 65
welfare negatively as it is associated with pain (Whay et al., 1997; Bicalho et al., 2007), and 66
decreases farm profitability due to poorer reproductive performance, loss of milk production, 67
and increased costs due to treatment and culling (Tranter and Morris, 1991; Sprecher et al., 68
1997; Green et al., 2002). Lame cows are usually detected by visual observation of gait and 69
back posture (Sprecher et al., 1997); however, in larger herds, along with the number of cows 70
managed per farm labor unit, visual detection of lame cows becomes more challenging. 71
Previous studies reported that lameness affects the cow’s normal behavior and 72
physiology: lame cows are less active (Juarez et al., 2003; Walker et al., 2008), enter the 73
milking parlor later (Walker et al., 2008), produce less milk (Green et al., 2002), and lose 74
body condition (Walker et al., 2008). Sensing technologies are available that can monitor 75
these behavioral and physiological characteristics of cows on a daily basis. For example, with 76
milk meters and weigh scales, a cow’s milk production and live-weight can be regularly 77
monitored. Kamphuis et al. (2013) demonstrated that cows becoming clinically lame have 78
sensor data trends that are significantly different for live-weight, activity, milking order, milk 79

5
yield (produced in the first two minutes after teat cup attachment and total milk yield), and 80
milking duration compared to cows that do not become clinically lame. Although there was 81
considerable variation in sensor data values between and within lame and non-lame cows, 82
results indicated that sensor data are potentially useful in the detection of lameness. 83
Datasets containing sensor data are often noisy, due to sensor drift or malfunctioning, 84
and incomplete due to missing values. Additionally, datasets are often imbalanced as the 85
incidence of lameness is low (Tranter and Morris, 1991; Gibbs, 2010). To analyze this noisy, 86
incomplete, and imbalanced data it is essential that the modeling technique used can process 87
data with these anomalies and can model nonlinear relationships. Examples of these more 88
sophisticated models in the field of lameness detection are neural networks applied by Pastell 89
et al. (2007) and principal component analyses used by Miekley et al. (2013). A model that 90
has not been used in automated detection of lameness is a data-mining technique called 91
decision-tree induction, a commonly used technique for classification problems (Quinlan, 92
1986) in combination with a boosting process that is known to improve accuracy of 93
classification models (Freund and Schapire, 1996). Decision-tree induction with boosting has 94
proven useful to analyze data with similar anomalies in automated clinical mastitis detection 95
(Kamphuis et al., 2010) where it was able to improve detection performance to a level 96
suggested to be of practical relevance being > 80% sensitivity and > 99% specificity 97
(Hogeveen et al., 2010). These values mean that a model should find at least 80% of the cows 98
that do have clinical mastitis and at the same time indicate fewer than 1% of the healthy cows 99
erroneously. It is unknown what performance targets should be set for a lameness detection 100
model. 101
The hypothesis for the current study was that sensors currently available on-farm to 102
monitor behavioral and physiological characteristics of dairy cows can be used for the 103
detection of lameness. This was tested by applying a boosting technique based on additive 104

6
logistic regression (Friedman et al., 2000) in combination with a specific type of decision-tree 105
algorithm (regression tree) to variables derived from one sensor (univariable models) and 106
multiple sensors (multivariable models) and assessing their detection performance using 107
leave-one-farm-out cross validation. 108
109
MATERIALS AND METHODS 110
Ethics approval was obtained through the Ruakura Animal Ethics Committee (Ruakura, 111
Hamilton, New Zealand; application number 12210) before commencement of the study. 112
Data were collected from five pasture-based dairy farms in the Waikato region of 113
New Zealand between November 2010 and June 2012 (Table 1). All farms except one 114
applied a seasonal spring-calving regime; one farm had cows calving in spring and autumn. 115
On all farms cows were milked on a rotary milking-platform (Waikato Milking Systems, 116
Hamilton, New Zealand) fitted with automatic weigh-scales and electronic milk meters. All 117
cows had a pedometer (Afikim, Kibutz Afikim, Israel) fitted to one hind leg for measuring 118
cow activity. The pedometers also contained an electronic cow identification (EID) unit. 119
Individual cow and sensor data from each milking session were automatically recorded on 120
herd management software (Frontier, Afikim, Kibutz Afikim, Israel) with data files generated 121
daily and transferred via the internet to a central database at DairyNZ (Hamilton, New 122
Zealand). Cow data included cow identification number and DIM. Sensor data at the cow 123
level included (1) live-weight, (2) activity as the average number of steps per hour between 124
milking sessions, (3) milking order, (4) milk yield in the first two minutes after teat cup 125
attachment, (5) total milk yield, and (6) milking duration. Participating farmers were trained 126
(Healthy Hoof Programme, DairyNZ Ltd, Hamilton, New Zealand) by accredited 127
veterinarians in detecting and diagnosing lame cows before the study commenced. When a 128
cow was identified as lame, farmers recorded cow identification number, date of observation, 129
7
affected limb, and severity of lameness using a 5-point lameness scoring system (adapted 130
from Sprecher et al., 1997) with scoring categories being (1) Normal, (2) Mildly lame, (3) 131
Moderately lame, (4) lame, and (5) Severely lame. Farmers were visited monthly to collect 132
farmer-recorded data on lameness and during these visits lameness scoring forms were 133
discussed to ensure standardized recording throughout the study period. At the end of the 134
study, data on other health events (e.g., clinical mastitis events and data on artificial 135
insemination or natural breeding events) that occurred during the collection period were 136
extracted from the herd management software. 137
138
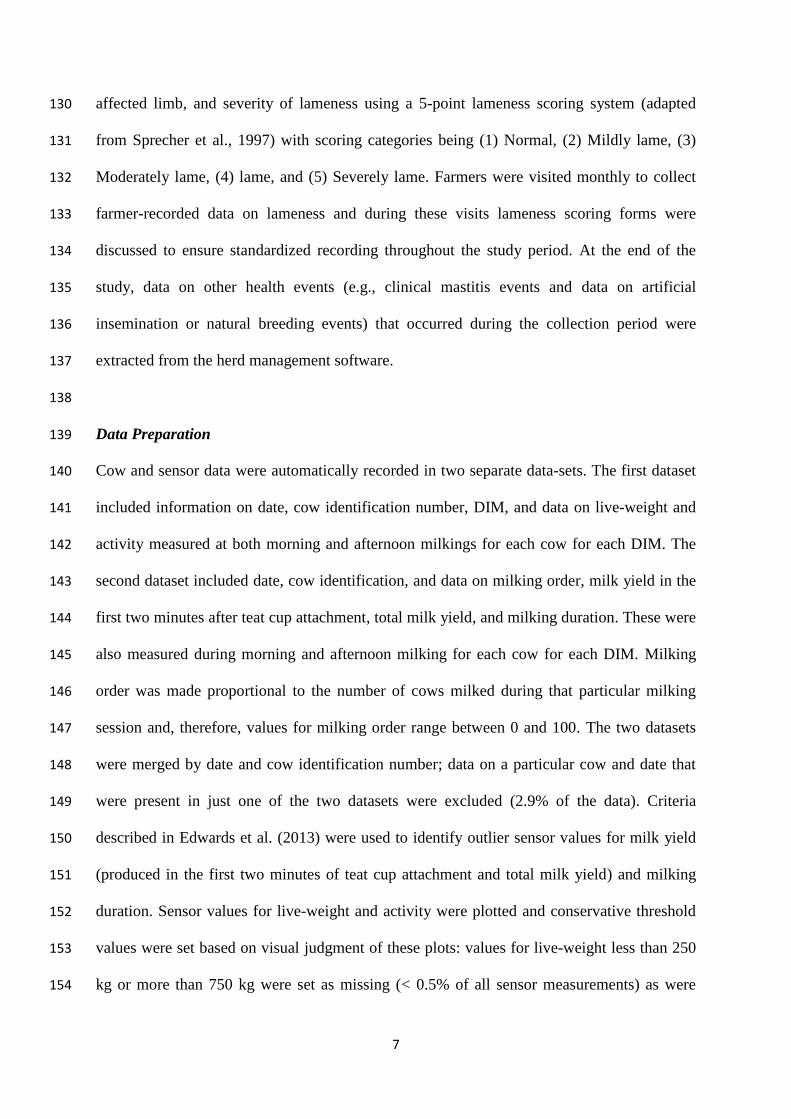
Data Preparation 139
Cow and sensor data were automatically recorded in two separate data-sets. The first dataset 140
included information on date, cow identification number, DIM, and data on live-weight and 141
activity measured at both morning and afternoon milkings for each cow for each DIM. The 142
second dataset included date, cow identification, and data on milking order, milk yield in the 143
first two minutes after teat cup attachment, total milk yield, and milking duration. These were 144
also measured during morning and afternoon milking for each cow for each DIM. Milking 145
order was made proportional to the number of cows milked during that particular milking 146
session and, therefore, values for milking order range between 0 and 100. The two datasets 147
were merged by date and cow identification number; data on a particular cow and date that 148
were present in just one of the two datasets were excluded (2.9% of the data). Criteria 149
described in Edwards et al. (2013) were used to identify outlier sensor values for milk yield 150
(produced in the first two minutes of teat cup attachment and total milk yield) and milking 151
duration. Sensor values for live-weight and activity were plotted and conservative threshold 152
values were set based on visual judgment of these plots: values for live-weight less than 250 153
kg or more than 750 kg were set as missing (< 0.5% of all sensor measurements) as were 154

8
values for activity less than 25 or more than 1100 steps per hour (< 0.5% of all sensor 155
measurements). A seventh variable was created in which the milk yield in the first two 156
minutes after teat cup attachment was made proportional to the total milk yield production for 157
a particular cow during a particular milking session on a particular date. Finally, sensor data 158
measured at morning and afternoon milkings were averaged to get one sensor value per day 159
for each variable for each cow in milk. If sensor data were available for one milking only, 160
that value was used for that cow for that day. 161
In total, 466 lameness events were recorded. Lameness events that had no date of 162
observation recorded were excluded (n = 39). Separate lameness events for the same cow for 163
the same affected limb were defined when the time lag between two lameness events was > 164
31 days; if the period was ≤31 days then the second lameness event recording was excluded 165
(n = 12). Records on other health events were collected including cow identification number, 166
date of health event and type of health event (including clinical mastitis, artificial 167
insemination, and natural breeding). 168
Sensor data, information on lameness events and other health information were 169
merged based on cow identification number and date. Lameness events (n = 30) and other 170
health events without any sensor data were excluded. 171
172
Defining lame and non-lame Cows 173
Lame cows were defined as cows with at least one lameness event recorded. To ensure that 174
sensor data used for statistical analyses were not affected by health events other than 175
lameness or by calving events, lameness events were excluded from further analyses when 176
the cow was recorded as having another health event occurring within the interval from 14 177
days prior (Dminus14) to the date of detection (D0) till seven days (Dplus7) after detection (n = 178
27) and when Dminus14 fell within the first 30 DIM of that lactation (n = 34). 179

9
The 22 day period (from Dminus14 to Dplus7) was considered a Lameness Episode. 180
Lameness Episodes with fewer than 10 days of sensor data from Dminus14 through D0 were 181
excluded from further analyses (n = 6). Each Lameness Episode was randomly matched by 182
farm and date with 10 non-lame cows, creating Lameness Blocks. Non-lame cows were 183
chosen from those cows without a lameness or health event recorded during the matched time 184
period and with at least 10 days of sensor data from Dminus14 through D0. Each Lameness 185
Block, therefore, contains sensor data from one lame cow and 10 non-lame cows. The 186
selection procedure allowed lame cows that experienced a lameness event during the study 187
period to contribute sensor data as a non-lame cow during periods they were not lame and 188
non-lame cows to contribute sensor data to more than one Lameness Block. 189
190
Model Development and Validation 191
From each selected lame and non-lame cow, only sensor data from Dminus14 till Dminus1 (that is, 192
the 14 days prior to the day that the lame cow was detected by the farmer) were included for 193
further analyses as management intervention might have influenced sensor data from D0 194
onwards. Proportional differences in sensor values were calculated between Dminus1 and the 195
previous thirteen days for each of the six sensor variables and the one derived variable. The 196
proportional differences with previous days (n = 13 for each variable) together with the 197
absolute sensor data value on Dminus1 (n = 1 for each variable) were considered as independent 198
variables to be used for model development. 199
All the data were used for model development and validation; however, by applying 200
leave-one-farm-out cross validation the model was validated using data completely 201
independent from data used for model development. With this cross validation approach, five 202
different models were developed excluding data from one farm in each run; the developed 203
model was then validated using the independent data from the left-out farm. As a result of 204
10
this cross validation, each record in the dataset (n = 3,498 consisting of 318 records from 205
lame and 3,180 records for non-lame cows) was used four times for model development and 206
once for validation. 207
Models were developed using a form of additive logistic regression implemented in 208
an algorithm called LogitBoost (Friedman et al., 2000). LogitBoost uses the boosting process 209
for model development in which a sequence of models or a so-called ensemble model is 210
generated. This ensemble model is built by repeatedly invoking a classification algorithm (the 211
base learner) and by doing so the ensemble model will fit the training data more closely as 212
the number of boosting iterations grows. The number of boosting iterations used to form the 213
ensemble model is user-defined. The boosting process applied by LogitBoost is based on 214
maximizing the conditional likelihood of the ensemble model. The final classification of 215
records is obtained by combining the output of all classification models forming the ensemble 216
model. In the current study, LogitBoost was applied in conjunction with WEKA’s REPTree 217
regression tree learner (Hall et al., 2009) as the base learner and the number of iterations was 218
set at 100. A regression tree is a form of decision tree, which is a hierarchical structure 219
consisting of a number of nodes connected by directed edges (Figure 1). Each node apart 220
from the root node has exactly one incoming edge and each node apart from the leaf nodes 221
has at least two outgoing edges. These are the internal nodes. At each internal node, an 222
independent variable is tested to decide which edge to follow. In the case of numeric 223
predictors, as in the application used in the current paper, the record’s value for the variable 224
that is tested is compared to a numeric threshold stored at the node. If the value is smaller 225
than the threshold, one proceeds along the first edge emanating from the node, otherwise the 226
second one. The REPTree algorithm grows a regression tree from weighted training records 227
by greedily expanding the tree and choosing tests at internal nodes and numeric outputs at 228
leaf nodes such that squared error is minimized. To obtain the regression tree’s output for a 229

11
particular record, assessment starts at the root node and traverses along directed edges at the 230
internal nodes until a leaf node containing a numeric value is reached. This numeric value is 231
returned as the tree’s output for that record and LogitBoost transforms the output to a 232
probability estimate using 233
( )
where x is the numeric output from the first regression tree in the ensemble model. The larger 234
this numeric output, the closer the probability estimate gets to 1; the smaller the value, the 235
closer the probability estimate gets to 0. To calculate the final probability estimate for 236
lameness in the current study, the LogitBoost algorithm combined the output of the trees 237
from 100 iterations to obtain a probability estimate for lameness using 238
( )
( )
where x1 to x100 are the numeric output values for a record received from a leaf node for each 239
of the 100 regression trees forming the ensemble model. To avoid overfitting the ensemble 240
model to the training data, which would negatively affect predictive performance on new 241
data, the complexity of the trees generated by REPTree was limited in the current study. 242
More specifically, trees were grown such that no more than two edges had to be traversed 243
before reaching a leaf node from the root node. As each edge traversal involved a test on one 244
predictor variable, this meant that at most two independent variables were inspected before a 245
numeric output was returned from a leaf node (note that it was possible for the same 246
independent variable to be tested at multiple nodes with different numeric thresholds in each 247
node, Figure 1). 248
Model development and validation were done using independent variables derived from one 249
sensor only (univariable models) and using independent variables derived from a 250
combination of sensors (multivariable models). Models were developed to produce a binary 251
12
outcome for lameness as well as outcomes for specific Lameness Scores. In addition, models 252
were developed using all lame and non-lame cows, and using lame cows with a Lameness 253
Score ≥3 and their matched controls only. It should be noted that the 14 independent 254
variables per sensor are clearly correlated. Correlation may imply that relative prominence of 255
these variables in the model built using LogitBoost does not accurately reflect their true 256
relatively importance. However, in this study, measures of variable importance were not 257
considered; detection performance was solely evaluated when applying the model to 258
independent data. 259
260
Performance Measures 261
The area under the receiver operating characteristic (ROC) curve was used to evaluate 262
detection performance of different models. This curve is a graphical representation of a 263
model’s true positive rate (or sensitivity; in this study, the proportion of lame cows that were 264
correctly classified as lame by the model) against its false positive rate (in this study, the 265
proportion of non-lame cows that were incorrectly classified as lame by the model). When 266
discriminating between lame and non-lame cows the points on the ROC curve are obtained 267
by changing the threshold value that is used by the model to classify records as lame from the 268
largest possible value to the smallest one (Detilleux et al., 1999; Cortes and Mohri, 2005). In 269
the current study, the additive logistic regression model yielded a probability estimate for 270
lameness for each record in the validation set. These probability estimates were used as 271
possible threshold values to create the ROC curve. When discriminating between Lameness 272
Scores, a different ROC curve can be drawn for each Score by treating that Score as the 273
positive category and the union of the other Scores as the negative category. 274
The area under the ROC curve (AUC) summarizes the graphical information into a 275
single quantity. When discriminating between lame and non-lame cows, the AUC can be 276

13
interpreted as the probability that the model generates a higher probability estimate for a 277
randomly selected lame cow than for a randomly selected non-lame cow (Hanley and 278
McNeil, 1982). Values for the AUC range between 0.5 and 1: when a model produces 279
probability estimates at random it will have an AUC of 0.5 whereas a perfect ranking (i.e., all 280
lame cows receive a higher probability estimate for lameness than the non-lame cows) will 281
yield an AUC of 1 (Swets, 1988; Cortes and Mohri, 2005). 282
Two ROC curves may have different shapes within certain threshold value limits but 283
still have the same AUC value (Detilleux et al., 1999). This makes comparison of models’ 284
performances using AUC difficult. As a second evaluation measure, the sensitivity of the 285
model was also calculated at two predetermined specificity levels (80% and 90%), where 286
specificity represents the proportion of non-lame cows that were correctly identified as being 287
non-lame by the model. Differences between models in sensitivities at predetermined 288
specificity levels were tested for significance using analysis of variance (ANOVA) including 289
farm and model as fixed effects. 290
Data cleaning, preparation, selection of lame and non-lame cows, and ANOVA were 291
done using SAS (version 9.2, SAS Institute Inc., Cary, NC). Model building, validation and 292
retrieving AUC values were done in WEKA (version 3.7.7, Waikato University, Hamilton, 293
New Zealand; Hall et al., 2009) 294
295
RESULTS 296
Sensor data were collected from ~1.5 million cow-milkings from 4,904 dairy cows (Table 1). 297
There were 385 lameness events with both an observation date and sensor data available; 318 298
of these were eligible for inclusion in the statistical analyses (Table 1). Most (43%) of these 299
eligible lameness events came from Farm 1 (Table 2). The biggest proportion (46%) of the 300
318 lameness events involved cows that were Moderately lame (Score 3), 23% of lameness 301
14
events involved cows that were Mildly lame (Score 2) and 26% of the lameness events 302
involved cows that were lame or Severely lame (Score 4 or 5; Table 2). 303
When all lame and non-lame cows were included, AUC values ranged between 0.51 304
and 0.66 for univariable models (Table 3). The univariable models including the variables 305
related to milk production had slightly lower AUC values than the univariable models 306
including live-weight, activity or milking order (Table 3). Combining sensor data using 307
variables with an AUC > 0.60 had consistently higher AUC values compared with each 308
univariable model and combining all three variables with an AUC > 0.60 (live-weight, 309
activity and milking order and further referred to as the combined model) improved AUC to 310
0.74 (Table 3). Compared to this combined model the AUC increased by just 0.04 when all 311
variables were included for model development (Table 3). Using the combined model, AUC 312
values for specific Lameness Scores were 0.59 for Score 2, 0.73 for Score 3 and 0.74 for 313
Score ≥ 4. The AUC for the 15 lameness events without a Lameness Score was 0.52. 314
Analyses were repeated including only lame cows with a Lameness Score ≥ 3 (n = 229) and 315
their matched controls (n = 2,290; Table 3). The general trend was similar for this subgroup: 316
univariable models including variables related to milk production had slightly lower AUC 317
values and combining variables yielded higher AUC values than using univariable variables. 318
The combined model increased the AUC to 0.75 (Table 3) and using this model, the 319
Lameness Score specific AUC values were 0.72 for Score 3 and 0.71 for Score ≥ 4. The 320
differences between AUC values using all lame cows or only those with Lameness Score ≥ 3 321
were minor. 322
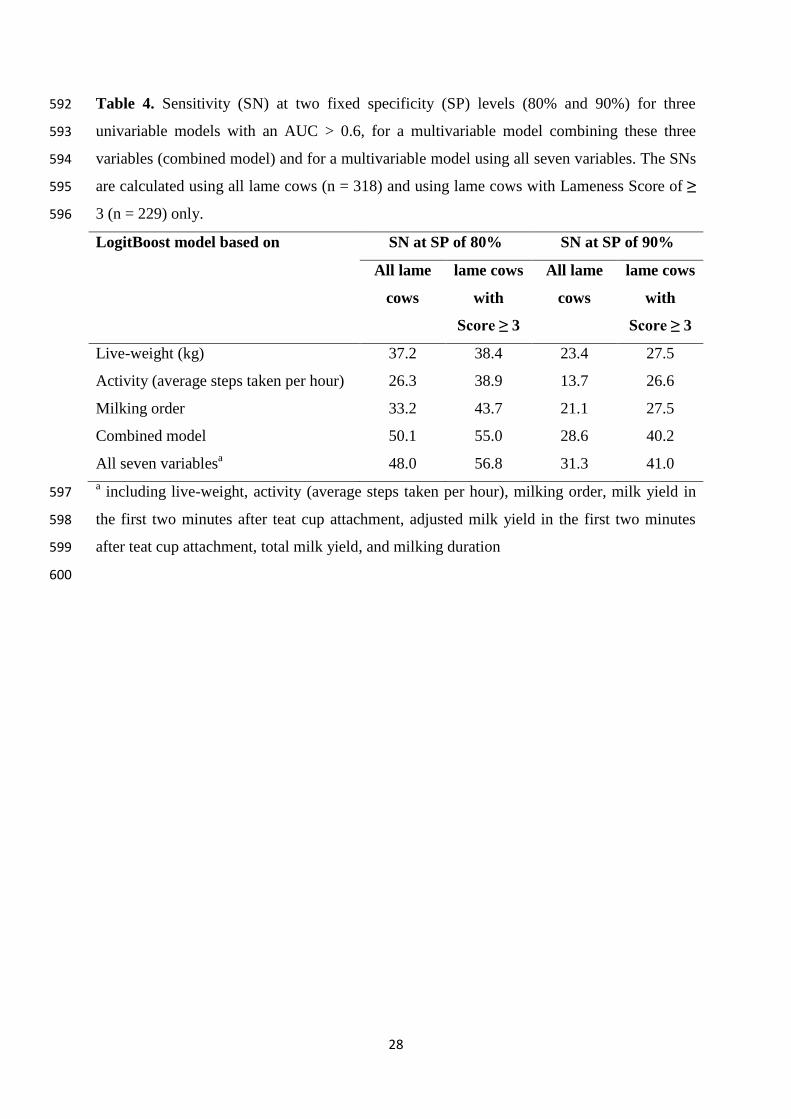
For the three variables with an AUC > 0.60 and for the combined model, sensitivity 323
levels were calculated at two fixed specificity levels using all lame cows and using lame 324
cows with a Lameness Score ≥3 (Table 4). Sensitivity levels at 80% specificity were greater 325
than at 90% specificity, and sensitivity levels for the combined model were greater than for 326
15
the univariable models for both specificity levels. When only lame cows with a Lameness 327
Score ≥3 were included sensitivity levels were greater than when all lame cows were 328
included. The combined model detected 50% of all lame cows at 80% specificity and 30% of 329
all lame cows at 90% specificity. When including lame cows with Lameness Score ≥3 only, 330
sensitivity increased to 55% at 80% specificity and to 40% at 90% specificity. Including all 331
variables in the model resulted in slightly higher sensitivities compared to the combined 332
model (Table 4). 333
Figure 2 demonstrates the sensitivity of each of the five models at two fixed 334
specificity levels (80% and 90%) resulting from the leave-one-farm-out cross validation, i.e., 335
Farm 1 demonstrates the performance of the model built with data from Farm 2 through 5 and 336
validated with data from Farm 1. Important is that Figure 2 shows that at 80% specificity the 337
combined model consistently outperformed the three univariable models including live-338
weight, activity, and milking order respectively, and that the model using activity only had 339
the poorest performance on four of the five farms. Statistical analyses showed that the 340
difference in performance between the combined model and each univariable model was 341
statistically significant (P < 0.01) and that the model only using activity data performed 342
significantly worse than the three other models (P < 0.05). There was no significant 343
difference (P = 0.59) between the model using live-weight only and the one using milking 344
order only. Results were different at 90% specificity, where the combined model 345
outperformed the others for four of the five farms, and where activity performed worst in four 346
of the five farms. In general, model performance tended to be less consistent at 90% 347
specificity than at 80% specificity (Figure 2). At 90% specificity, the only significant 348
difference (P < 0.01) was between the combined model and the model using activity only. 349
When models were developed and validated including lame cows with Lameness Score ≥ 3 350
only, the combined model significantly (P < 0.05) outperformed the models using activity 351
16
and milking order only at 80% specificity, with no other significant differences between the 352
models. At 90% specificity and including lame cows with Lameness Score ≥ 3, the combined 353
model significantly (P < 0.05) outperformed the model using activity only and the model 354
using live-weight only. There were no other significant differences between models at this 355
specificity level. 356
357
DISCUSSION 358
Results of this study have confirmed the hypothesis that sensor data available on a growing 359
number of farms are potentially useful for the detection of lameness. Sensor data that gave 360
the best prediction of lameness, based on their AUC value, were live-weight, activity, and 361
milking order. These variables have been associated with lameness in previous studies (e.g., 362
Juarez et al., 2003; Walker et al., 2008). In this study on pastured cows, their AUC values 363
varied between 0.60 and 0.66 and on their own are not sufficiently high to be of practical use. 364
Combining data from these three sensors, however, increased detection performance. The 365
AUC of the combined model was 0.74 when all lame cows were included and 0.75 when only 366
lame cows with a Lameness Score of ≥3 were included (Table 3). This result should be 367
interpreted as the combined model having a 74 to 75 percent probability generating a higher 368
probability estimate for lameness for a randomly selected lame cow than for a randomly 369
selected non-lame cow (Hanley and McNeil, 1982). The slightly better detection performance 370
can be explained by two reasons that occur simultaneously when excluding cows with 371
locomotion score 2 and their controls. The first reason is the decreased risk of mislabeling 372
cows with lameness score ≥3 as being healthy and vice versa. The second reason is that 373
differences in sensor data patterns between lame and non-lame cows are more pronounced 374
with increasing lameness score (Kamphuis et al., 2013). Both reasons are linked with the 375
reduction of noise in the dataset and this reduction will make it easier for an algorithm to 376

17
model the data. Adding information based on sensors measuring aspects of milk yield did not 377
improve AUC further. This suggests that sensor data based on milk yield have limited 378
potential for lameness detection on the study farms despite previous reports that milk yield is 379
negatively associated with lameness (Green et al., 2002). 380
The AUC of 0.74 was achieved by combining sensor data from readily available 381
sensors, some of which are already installed on farm but used for different purposes. Sensors 382
that measure activity are usually installed for automated estrus detection (Roelofs et al., 2005; 383
Hockey et al., 2010) and weigh-scales can be used to monitor changes in live-weight as a 384
guide for adjusting feeding programs (Alawneh et al., 2011). In the current study, this data 385
were combined for a different purpose (detecting lameness), which would remove the need 386
for farmers to invest in additional (expensive) sensors to automate parts of the farm 387
management processes. The approach used in the current study allowed a large amount of 388
sensor data and a large number of lameness events to be collected in a relatively short period 389
of time. The dataset is, therefore, more extensive than in previous reports: 18 cases from one 390
farm (Pastell et al., 2007), 58 cases from one farm (Bicalho et al., 2007), and 210 cases from 391
one farm (Miekley et al., 2013). Furthermore, data collection on multiple farms allowed for 392
leave-one-farm-out cross validation, thus using completely independent data for model 393
validation. The sensors in this study were not calibrated as part of the study design and little 394
data cleaning was done to identify erroneous or malfunctioning sensors. This was done 395
deliberately, to study if sensors as used on-farm could be useful for lameness detection. Even 396
with the noisy data, the combined model outperformed the univariable models significantly at 397
a specificity of 80% and did this consistently across farms. These results suggest that live-398
weight, activity, and milking order are likely to be the most useful to identify lame cows, and 399
that lameness can be detected by utilizing information already available on farm better. 400

18
The combined model with an AUC of 0.74 used variables based on proportional 401
differences analyzed with a modeling technique called additive logistic regression. These 402
differences, obtained by comparing sensor measurements on different days, are clearly 403
correlated, and we cannot preclude that further improvements in detection performance are 404
possible using other techniques. Nevertheless, the AUC of the combined model was higher 405
than the 0.60 reported by Miekley et al (2013) who applied principal component analysis to 406
develop a lameness detection model that was allowed to assign alerts for up to three days 407
before cows were diagnosed visually as lame. The AUC of the combined model was also 408
higher than the 0.62 reported by Bicalho et al. (2007) who studied a commercially available 409
lameness detection system based on force-measurements. Bicalho et al. (2007), however, 410
used the cow’s reaction to gentle pressure applied by hand to lesions identified at hoof 411
trimming as the gold standard for lameness diagnosis, which is unlikely to be the same as 412
lameness as defined in the current study. Pastell et al. (2007) used a probabilistic neural 413
network to detect lame cows using leg-load distribution and reported an AUC of 0.86. Their 414
model was based on data collected at only one farm with limited numbers of cases for model 415
development (n = 9) and validation (n = 9). As a consequence, their model may have 416
overfitted the data used for development. It would be of great interest to test their model 417
using independent data from other farms to confirm the reported performance. 418
The study farmers were trained to identify lameness but it is still likely that the overall 419
incidence of lameness was underestimated. Previous studies have reported that farmers fail to 420
identify ~75% of lame cows (Whay et al., 2002; Fabian, 2012). Previous work has also 421
reported poor agreement between farmers when assigning locomotion scores (Bicalho et al., 422
2007). These factors both increase the risk that particularly mildly lame cows (locomotion 423
score 2) are mislabelled as non-lame, hence visually undetected but mildly lame cows were 424
likely to have been selected erroneously as non-lame cows. Despite these caveats, the current 425

19
study demonstrated that sensor data were useful to predict lameness, and that AUC values 426
increased with increasing Lameness Score (from 0.59 for Score 2 to 0.74 for Score ≥ 4). This 427
result indicates a level of consistency in diagnosing lameness between the enrolled farmers, 428
most likely due to the training that was carried out before the study commenced. 429
The current study developed prediction models with a binary outcome (lame vs. non-430
lame) where lame cows were those with a locomotion score ≥2. Whether the applied 431
threshold to define lame and non-lame cows was the most appropriate one is debatable. The 432
current study considered one alternative and that was to exclude mildly lame cows 433
(locomotion score 2) and their controls. This approach may be attractive for performance 434
evaluation purposes; excluding these cows will decrease the noise and with that improve 435
detection performance of a mode. However, from a practical point of view, these mildly lame 436
cows should not be excluded as they are part of real-life. This study labelled the mildly lame 437
cows as lame and together with the model having a binary outcome seemed a fair approach: 438
when applied in practice, the model would alert for only a small proportion of these mildly 439
lame cows (lameness score 2 had the lowest AUC). This, however, will likely not be a 440
significant problem given the mild symptoms and the likelihood of the cow to self-cure 441
without human intervention. When the model would alert for these mildly lame cows, there is 442
a risk that farmers that have difficulties with diagnosing mildly lame cows will not recognize 443
the cow as being lame and thus perceive the alert as false positive. In this situation, the cow 444
can either self-cure or she will deteriorate and the model will pick her up at a later, more 445
severe lameness state. However, for farmers that are capable of diagnosing mildly lame cows, 446
the alerts will be appreciated as early intervention is possible. Should future research focus on 447
developing a detection model that predicts specific locomotion scores, mislabelling of cows 448
should be minimized as much as possible. 449

20
The AUC obtained in the current study compared to previous reports is a promising 450
result; however, it does not mean that the performance of the combined model is high for 451
practical use. When the specificity was fixed at 80%, the combined model had an overall 452
sensitivity of 50% which increased to 55% when only lame cows with Lameness Score ≥3 453
were included (Table 4). Translating these figures into practice and assuming an incidence 454
rate of 25 cases of lameness per 100 cows per lactation (Gibbs, 2010) a farmer could expect 455
approximately 12 lame cows per month in a 500-cow herd and, by the end of each month, six 456
to seven of these lame cows would be detected correctly. At the same time, however, a 457
specificity of 80% corresponds to approximately 200 false alerts per 1,000 measurements 458
(Sherlock et al., 2008), i.e., 100 cows would be falsely identified as lame each day on a 500-459
cow herd. Therefore, although promising, translating the results into practice demonstrates 460
that, based on the current sensor-baser variables that represent simple proportional 461
differences, detection performance is not high enough to be implemented on larger pasture-462
based dairy farms. Future research may improve detection performance by developing 463
variables that better describe the changes in sensor data patterns from live-weight, activity, 464
and milking order when cows go lame. 465
466
CONCLUSION 467
Sensor data that gave the best prediction of lameness, based on their AUC value, were live-468
weight, activity, and milking order. By combining these three sensor data sources, 469
performance increased and this was consistent across farms. Nevertheless, sensor-based 470
variables explored in the current study did not result in a model with a detection performance 471
high enough for practical implementation. To improve detection performance, future research 472
should focus on developing variables based on sensor data of live-weight, activity, and 473
milking order but that better describe changes in sensor data patterns when cows go lame. 474

21
475
ACKNOWLEDGEMENTS 476
The authors would like to acknowledge Barbara Dow (DairyNZ Ltd, Newstead, Hamilton 477
3240, New Zealand) for her statistical support. Also acknowledged are the contributions to 478
the acquisition of the data used in this study by participating farmers. This study was funded 479
by New Zealand Government through the Primary Growth Partnership research programme 480
and by New Zealand dairy farmers through DairyNZ Inc. 481
482
REFERENCES 483
Alawneh, J. I., M. A. Stevenson, N. B. Williamson, N. Lopez-Villalobos, and T. Otley. 2011. 484
Automatic recording of daily walkover liveweight of dairy cattle at pasture in the first 485
100 days in milk. J. Dairy Sci. 94: 4431 - 4440. 486
http://dx.doi.org/10.3168/jds.2010-4002. 487
Bicalho, R. C., S. H. Cheong, G. Cramer and C. L. Guard. 2007. Association between a 488
visual and an automated locomotion score in lactating Holstein cows. J. Dairy Sci. 90: 489
3294 - 3300. http://dx.doi.org/10.3168/jds.2007-0076. 490
Cortes, C., and M. Mohri. 2005. Confidence intervals for the area under the ROC curve. 491
Pages 305 - 312 in Advances in Neural Information Processing Systems 17. LK Saul, 492
Y. Weiss, L. Bottou (eds.), MIT Press, Cambridge, MA, USA. 493
Detilleux, J., J. Arendt, F. Lomba, and P. Leroy. 1999. Methods of estimating areas under 494
receiver operating characteristic curves: illustration with somatic-cell scores in 495
subclinical intramammary infections. Prev. Vet. Med. 14: 75 - 88. 496
http://dx.doi.org/10.1016/S0167-5877(99)00054-9. 497
22
Edwards, J. P., J. G. Jago, and N. Lopez-Villalobos. 2013. Large rotary dairies achieve high 498
cow throughput but are not more labour efficient than medium sized rotaries. Anim. 499
Prod. Sci. http://dx.doi.org/10.1071/AN12312. 500
Fabian, J. 2012. The prevalence of lameness on New Zealand dairy farms: a comparison of 501
farmer perception and mobility scoring. MVS thesis. Institute of Veterinary, Animal 502
and Biomedical Sciences, Massey University, Palmerston North, New Zealand. 503
Freund, Y., and R.E. Schapire 1996. Experiments with a new boosting algorithm. Pages 148 - 504
156 in Proceedings of the Thirteenth International Conference on Machine Learning. 505
L. Saitta (ed.). Morgan Kaufmann Publishers, San Fransisco, CA. 506
Friedman, J., T. Hastie, and R. Tibshirani. 2000. Additive logistic regression: a statistical 507
view of boosting. The Annals of Statistics. 28: 337 - 407. 508
Gibbs, S. J. 2010. Dairy Lameness in the South Island. Pages 424 – 427 in Proceedings of the 509
4th
Australasian Dairy Science Symposium. Caxton Press, Christchurch, New 510
Zealand. 511
Green, L. E., V. J. Hedges, Y. H. Schukken, R. W. Blowey, and A. J. Packington. 2002. The 512
impact of clinical lameness on the milk yield of dairy cows. J. Dairy Sci. 85: 2250 – 513
2256. http://dx.doi.org/10.3168/jds.S0022-0302(02)74304-X. 514
Hall M., E. Frank, G. Holmes, B. Pfahringer, P. Reutemann, and I. H. Witten. 2009. The 515
WEKA Data Mining Software: An Update; SIGKDD Explorations. 11: 10 - 18. 516
Hanley, J., and B. J. McNeil. 1982. The meaning and use of the area under the receiver 517
operating characteristic (ROC) curve. Radiology. 143: 29 – 36. 518
Hockey, C. D., J. M. Morton, S. T. Norman, and M. R. McGowan. 2010. Evaluation of a 519
neck mounted 2-hourly activity meter system for detecting cows about to ovulate in 520
two paddock-based Australian dairy herds. Reprod. Dom. Anim. 45: c107 – c117. 521
http://dx.doi.org/10.1111/j.1439-0531.2009.01531.x. 522
23
Hogeveen, H., C. Kamphuis, W. Steeneveld, and H. Mollenhorst. 2010. Sensors and clinical 523
mastitis – the quest for the perfect alert. Sensors. 10: 7991 - 8009. 524
http://dx.doi.org/10.3390/s100907991. 525
Juarez, S. T., P. H. Robinson, E. J. DePeters, and E.O. Price. 2003. Impact of lameness on 526
behaviour and productivity of lactating Holstein cows. Appl. Anim. Behav. Sci. 83: 1 527
– 14. http://dx.doi.org/10.1016/S0168-1591(03)00107-2. 528
Kamphuis C, J. K. Burke, and J. G. Jago. 2013. Cows becoming clinically lame differ in 529
changes in behaviour and physiology compared to cows that do not become clinically 530
lame. Proceedings of the New Zealand Society of Animal Production. Accepted for 531
publication. 532
Kamphuis, C., H. Mollenhorst, J. A. P. Heesterbeek, and H. Hogeveen. 2010. Detection of 533
clinical mastitis with sensor data from automatic milking systems in improved by 534
using decision-tree induction. J. Dairy. Sci. 93: 3616 – 3627. 535
http://dx.doi.org/10.3168/jds.2010-3228. 536
Miekley, B., I. Traulsen, and J. Krieter. 2013. Principal component analyses for the early 537
detection of mastitis and lameness in dairy cows. J. Dairy. Res. In press. 538
Pastell, M. E., and M. Kujala. 2007. A probabilistic neural network model for lameness 539
detection. J. Dairy Sci. 90: 2283 – 2292. http://dx.doi.org/10.3168/jds.2006-267. 540
Quinlan, J. R. 1986. Induction of decision trees. Machine Learning. 1: 81 – 106. 541
Roelofs, J. B., F. J. C. M. van Eerdenburg, N. M. Soede, and B. Kemp. 2005. Pedometer 542
readings for estrous detection and as predictor for time of ovulation in dairy cattle. 543
Theriogenology. 64: 1690 – 1703. 544
http://dx.doi.org/10.1016/j.theriogenology.2005.04.004. 545
Sherlock, R., H. Hogeveen, G. Mein, and M. Rasmussen. 2008. Performance evaluation of 546
systems for automated monitoring of udder health: analytical issues and guidelines. 547

24
Pages 275 – 282 in Proceedings of the International Conference of Mastitis Control: 548
from science to practice. T. J. G. M. Lam (ed.), Wageningen Academic Publishers, 549
Wageningen, the Netherlands. 550
Sprecher, D. J., D. E. Hostetler, and J. B. Kaneene. 1997. A lameness scoring system that 551
uses posture and gait to predict dairy cattle reproductive performance. Theriogenoloy. 552
47: 1179 – 1187. http://dx.doi.org/10.1016/S0093-691X(97)00098-8. 553
Swets, J. A. 1988. Measuring the accuracy of diagnostic systems. Science 240: 1285-1293 554
Tranter, W. P., and R. S. Morris. 1991. A case study of lameness in three dairy herds. NZVJ. 555
39: 88 – 96. 556
Walker, S. L., R. F. Smith, J. E. Routly, D. N. Jones, M. J. Morris, and H. Dobson. 2008. 557
Lameness, activity time-budgets, and estrus expression in dairy cattle. J. Dairy. Sci. 558
91: 4552 – 4559. http://dx.doi.org/10.3168/jds.2008-1048. 559
Whay, H. R., A. E. Waterman, and A. J. F. Webster. 1997. Associations between locomotion, 560
claw lesions and nociceptive threshold in dairy heifers during the peri-partum period. 561
The Vet. J. 154: 155 – 161. 562
Whay, H. R., D. C. J. Main, L. E. Green, and A. J. F. Webster. 2002. Pages 355 – 358 in the 563
Proceedings of the 12th
International symposium on lameness in ruminants, Orlando, 564
USA. 565
566

25
Table 1. Details of data collected from the five pasture-based Waikato dairy farms including 567
the start date, the number of unique cows milked, the number of cow-milkings, the total 568
number of lameness recordings with sensor data and the number of lameness events included 569
in the statistical analyses after excluding the first 30 DIM, lame cows that had other 570
simultaneous health events and lame cows with less than 10 days of sensor data before 571
lameness was observed 572
Farm Start Date Unique cows
(n)
Cow-milkings
(n)
Lameness
recordings
(n)
Lameness
events in
analyses (n)
1 27/11/2010 914 261,311 164 138
2 04/12/2010 539 185,594 24 22
3 04/12/2010 814 290,956 66 54
4 30/11/2010 543 146,587 73 57
5 03/12/2010 2,094 581,142 58 47
Total 4,904 1,465,590 385 318
573
574
575
26
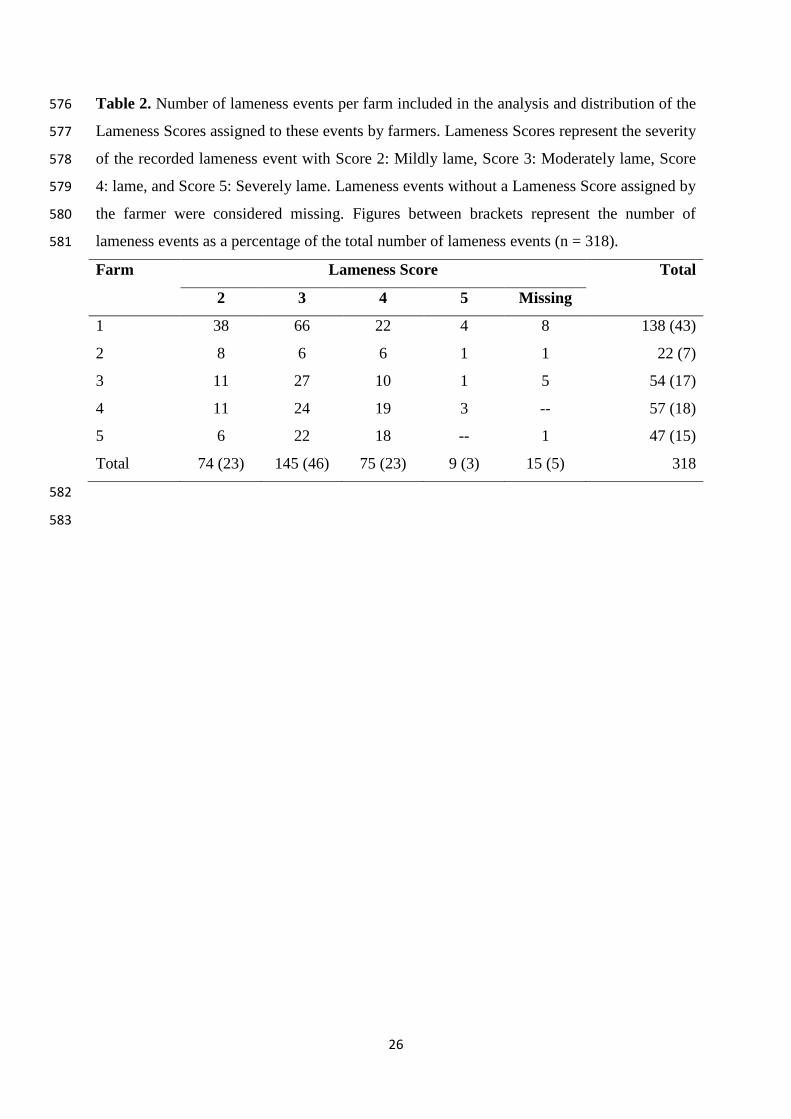
Table 2. Number of lameness events per farm included in the analysis and distribution of the 576
Lameness Scores assigned to these events by farmers. Lameness Scores represent the severity 577
of the recorded lameness event with Score 2: Mildly lame, Score 3: Moderately lame, Score 578
4: lame, and Score 5: Severely lame. Lameness events without a Lameness Score assigned by 579
the farmer were considered missing. Figures between brackets represent the number of 580
lameness events as a percentage of the total number of lameness events (n = 318). 581
Farm Lameness Score Total
2 3 4 5 Missing
1 38 66 22 4 8 138 (43)
2 8 6 6 1 1 22 (7)
3 11 27 10 1 5 54 (17)
4 11 24 19 3 -- 57 (18)
5 6 22 18 -- 1 47 (15)
Total 74 (23) 145 (46) 75 (23) 9 (3) 15 (5) 318
582
583

27
Table 3. Area under the receiver operating characteristic curve (AUC) values for univariable 584
models and multivariable LogitBoost models for detecting lameness. The AUC is calculated 585
using all lame cows (n = 318) and using lame cows with a Lameness Score ≥ 3 (n = 229) 586
only. 587
LogitBoost model based on AUC
All lame cows
lame cows
with Score
≥ 3
Univariable analyses
Live-weight (kg) 0.658 0.654
Activity (average steps taken per hour) 0.603 0.617
Milking order 0.646 0.64
Milk yield (kg) produced in the first 2 minutes 0.543 0.514
Adjusted milk yield (kg) produced in the first 2 minutesa
0.508 0.535
Total milk yield (kg) 0.597 0.614
Milk duration (min) 0.537 0.568
Multivariable analyses including variables with AUC > 0.6
Live-weight x Activity 0.699 0.714
Live-weight x Milking order 0.718 0.712
Activity x Milking order 0.664 0.676
Live-weight x Activity x Milking order
(Combined model)
0.735 0.746
Multivariable analyses including all variables
b 0.739 0.749
a adjusted for the total milk yield for that particular cow-milking 588
b including live-weight, activity (average steps taken per hour), milking order, milk yield in 589
the first two minutes after teat cup attachment, adjusted milk yield in the first two minutes 590
after teat cup attachment, total milk yield, and milking duration 591
28
Table 4. Sensitivity (SN) at two fixed specificity (SP) levels (80% and 90%) for three 592
univariable models with an AUC > 0.6, for a multivariable model combining these three 593
variables (combined model) and for a multivariable model using all seven variables. The SNs 594
are calculated using all lame cows (n = 318) and using lame cows with Lameness Score of ≥ 595
3 (n = 229) only. 596
LogitBoost model based on SN at SP of 80% SN at SP of 90%
All lame
cows
lame cows
with
Score ≥ 3
All lame
cows
lame cows
with
Score ≥ 3
Live-weight (kg) 37.2 38.4 23.4 27.5
Activity (average steps taken per hour) 26.3 38.9 13.7 26.6
Milking order 33.2 43.7 21.1 27.5
Combined model 50.1 55.0 28.6 40.2
All seven variablesa
48.0 56.8 31.3 41.0
a including live-weight, activity (average steps taken per hour), milking order, milk yield in 597
the first two minutes after teat cup attachment, adjusted milk yield in the first two minutes 598
after teat cup attachment, total milk yield, and milking duration 599
600

29
601
602
603
604
605
606
607
608
609
610
611
612
613
614
615
616
617
618
619
620
621
Figure 1. Example of a hypothetical regression tree generated by LogitBoost (Friedman et 622
al., 2000) using a maximum of two independent variables to estimate averaged (weighted and 623
rescaled) residuals at the leaf nodes. These residuals are transformed into a probability 624
estimate for lameness. 625
626
Internal Nodes
Root Node
Difference in live-
weight between
Dayminus1 and Dayminus14
Difference in activity
between Dayminus1 and
Dayminus4
Difference in live-
weight between
Dayminus1 and Day minus2
1.14 -0.04 1.42 1.74 Leaf Node
≥-7.06 < -7.06
≥-3.53 < -3.53 ≥-2.26 < -2.26
P(lame = 1) = 1/1+е-1.14
= 0.76

30
627
Figure 2. Dot-plots of sensitivities at fixed specificities (80% and 90%) for three univariable 628
models (Live-weight, ●; Activity, ♠; Milking order, ) and a multivariable model combining 629
these three variables (Combined model, ) for each farm. Data from all lame cows (n = 318) 630
were used in these calculations 631