1 In vivo mouse studies with bioluminescence tomography (BLT) G. Wang 1, W. Cong 1, K. Durairaj 1,...
20
1 In vivo mouse studies with bioluminescence tomography (BLT) G. Wang 1 , W. Cong 1 , K. Durairaj 1 , X. Qian 1 , H. Shen 1 P. Sinn 2 , E. Hoffman 1 , G. McLennan 2 , and M. Henry 3 1 Bioluminescence Tomography Lab, Dept. of Radiology 2 Dept. of Internal Medicine 3 Dept. of Physiology and Biophysics Univ. of Iowa, 200 Hawkins Drive, IA 52242, USA [email protected] , and [email protected] Optics Express, Vol. 14, No. 17, 2006, pp7801-7807 Puxiang Lai Aerospace & Mechanical Engineering, Boston University Journal Club, 06/04/2007
-
date post
19-Dec-2015 -
Category
Documents
-
view
215 -
download
2
Transcript of 1 In vivo mouse studies with bioluminescence tomography (BLT) G. Wang 1, W. Cong 1, K. Durairaj 1,...

1
In vivo mouse studies with bioluminescence tomography
(BLT)G. Wang1, W. Cong1, K. Durairaj1, X. Qian1, H. Shen1
P. Sinn2, E. Hoffman1, G. McLennan2, and M. Henry3
1Bioluminescence Tomography Lab, Dept. of Radiology2Dept. of Internal Medicine
3Dept. of Physiology and BiophysicsUniv. of Iowa, 200 Hawkins Drive, IA 52242, USA
[email protected], and [email protected]
Optics Express, Vol. 14, No. 17, 2006, pp7801-7807
Puxiang LaiAerospace & Mechanical Engineering, Boston University
Journal Club, 06/04/2007

2
Outline Introduction of bioluminescence BLT system design and methodology
Mice in-vivo experiments Conclusion and discussion
3
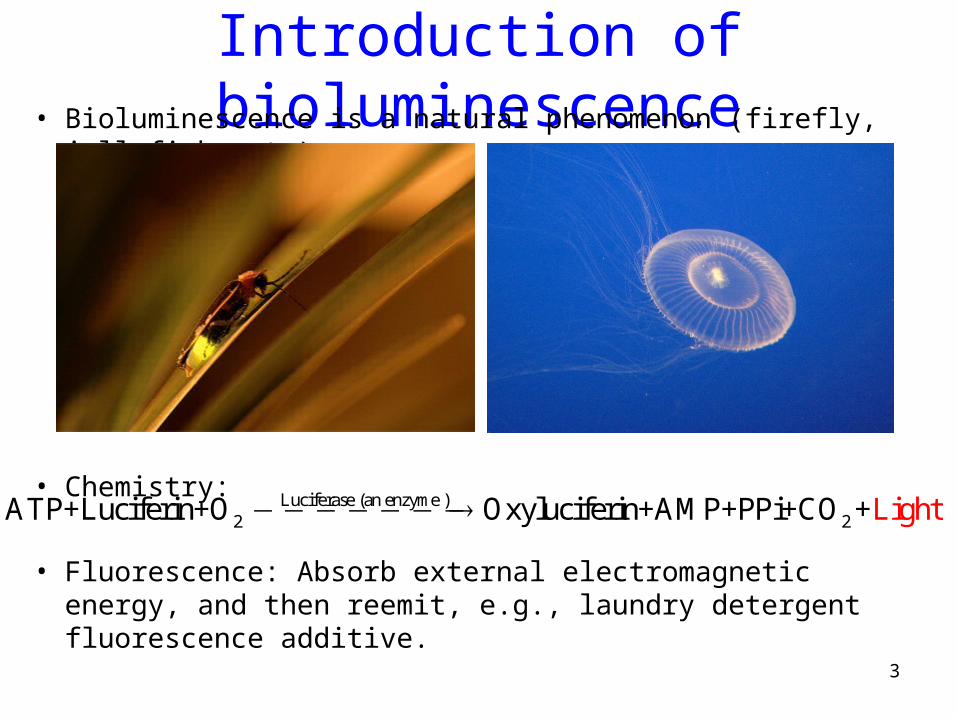
Introduction of bioluminescence• Bioluminescence is a natural phenomenon (firefly, jellyfish, etc)
• Chemistry:
• Fluorescence: Absorb external electromagnetic energy, and then reemit, e.g., laundry detergent fluorescence additive.
Luciferase (an enzyme )2 2ATP+Luciferin+O Oxyluciferin+AMP+PPi+CO +Light

4
Bioluminescence imaging (BLI)
A. Cells, infectious agents or genes can be bioluminescently labeled.
B. labeled cells or genes harboring on a live mouse.
C. Detect with a highly sensitive CCD camera mounted on a light tight enclosure.
D. Imaging the bioluminescence source distribution on PC.
5
Bioluminescence imaging (BLI)
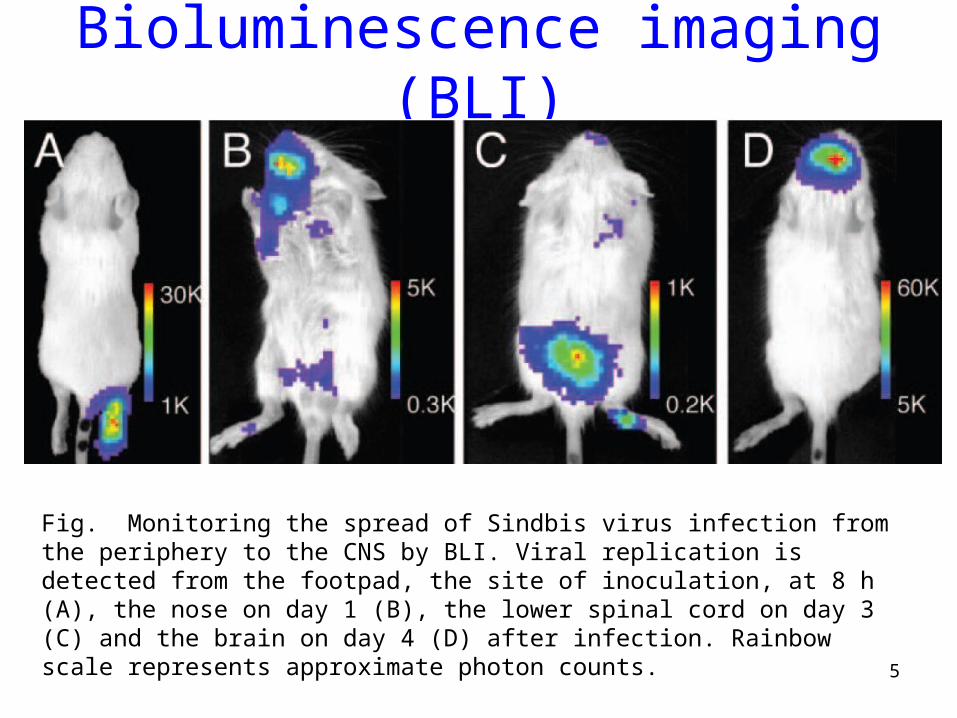
Fig. Monitoring the spread of Sindbis virus infection from the periphery to the CNS by BLI. Viral replication is detected from the footpad, the site of inoculation, at 8 h (A), the nose on day 1 (B), the lower spinal cord on day 3 (C) and the brain on day 4 (D) after infection. Rainbow scale represents approximate photon counts.

6
• BLI is traditionally in a planar mode largely as a qualitative tool.
• With bioluminescence tomography (BLT), the bioluminescent source distribution inside a living small animal can be localized and quantified in 3D.
Bioluminescence tomography (BLT)
Excellent SNR and spatial resolution imaging of small animals.
A clear, visual understanding of how cells expressing particular genes locate, move and develop in-vivo (combined with other modalities).
To assess the effects of experimental therapies.

7
BLT System and experiment design
BLT experiment procedure:• Several days ahead, light-emitting luciferase probes are
implanted into a mouse;• Inject with luciferase substrate luciferin biochemical
reaction generated bioluminescent photons CCD detects the photon fluence on the surface Light source reconstruction.

8
BLT Source reconstruction• Steady state diffusion equation, and Robin boundary condition:
• The measured quantity on CCD is the photon current on surface:
[ ( ) ( )] ( ) ( ) ( ) )
( ) 2 ( ) ( )[ ( ) ( )] 0 )aD r r r r S r r
r A r D r v r r r
2
3
-1a
'a
: photon fluence rate, [W/mm ]
S: density of the bioluminescent source distribution, [W/mm ]
: absorption coefficient, [mm ]
D: diffusion coefficient, 1/[3( + )]
: support for the mouse body
: bo
s
dy surface of the mouse
A: the mismatch coefficient due to the different refractive indices across
: the unit vector outer normal to v
( ) ( )[ ( ) ( )] )r D r v r r r

9
BLT Source reconstructionAS
1 2 M
1 2 M
S , S , ..., S , representing the bioluminescence source distribution
A= a , a , ..., a , weighting matrix about source distribution
, N-dimensional vector computed from light intensity measured on th
S
e surface
a is the contribution of the -th source component S to kk kS k
BLT problem becomes to reconstruct ( 1, 2,..., ) from the measured data iS i M
Underdetermined; strong prior knowledge must be included.
In this paper, a threshold of 10% of the maximum reconstructed source density is utilized to decrease the permissible source region, and number of unknowns. Mathematically, given a permissible region Ωs
2
2
min ( ) (0 , )
: a regularization parameter; : a stabilizing function
W: a weighting matrix, and
: the upper bound for source density to be physically meaningful
W
W
s
T
AS S S U S
V V WV
U
10
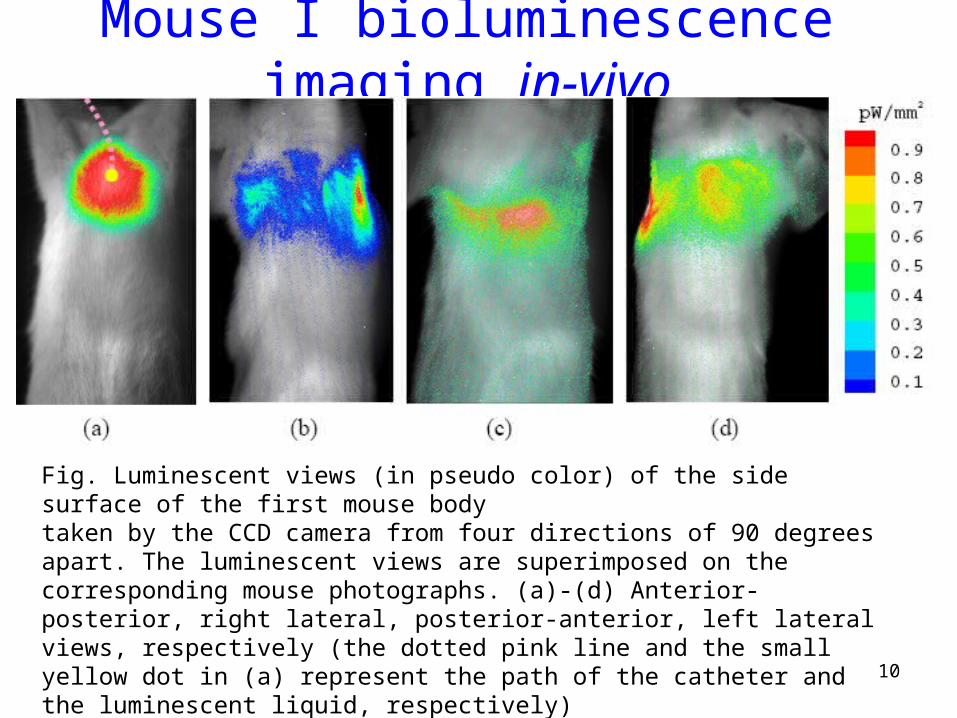
Mouse I bioluminescence imaging in-vivo
Fig. Luminescent views (in pseudo color) of the side surface of the first mouse bodytaken by the CCD camera from four directions of 90 degrees apart. The luminescent views are superimposed on the corresponding mouse photographs. (a)-(d) Anterior-posterior, right lateral, posterior-anterior, left lateral views, respectively (the dotted pink line and the small yellow dot in (a) represent the path of the catheter and the luminescent liquid, respectively)

11
Mouse model and data mapping
Fig. First mouse model and associated bioluminescent measurement. (a) A geometrical model of the mouse chest consisting of muscle, a heart, a lung and a liver (b) Measured bioluminescent data mapped onto the finite element mesh model of the mouse
chest.

12
Mouse I source reconstruction• Procedures:
– 1
– Use a threshold of 10% maximum to shrink the permissible region and reduce the number of unknowns, and repeat the same procedures.
s
'
Detector readings ( ) were computed from the CCD images;
Permissible region {( , , ) | 4 4, 0 4, 9.5 13.5};
Value of and of different components are from literatre;
Stabilizing function (
a s
x y z x y z
) with reglarization parameter =1.0E-6.Tr r r

13
Mouse I source reconstruction
(a) (b
)(c)
Fig. BLT reconstruction of the luminescent source distribution in the first mouse. (a) A 2D transverse section of the reconstructed light source (red) and contours
representing boundaries of various organs (blue).(b) The true source (inside the black circle) in a micro-CT slice superimposed with the
reconstructed source (red). (c) a 3D rendering of the reconstructed source distribution (inside the red ellipse) in the
mouse.

14
Tumor-bearing Mouse bioluminescence views
Fig. Four bioluminescent views in pseudo-color superimposed on the corresponding photographs of the second mouse. (a)-(d) Anterior-posterior, right lateral, posterior-anterior and left lateral views, respectively.
15
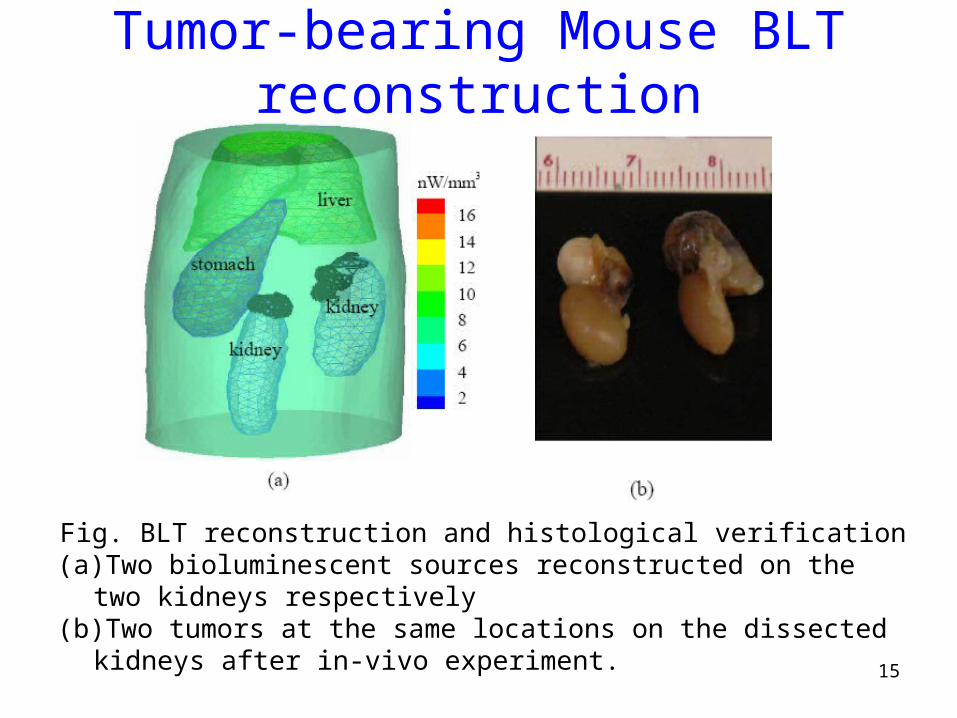
Tumor-bearing Mouse BLT reconstruction
Fig. BLT reconstruction and histological verification(a) Two bioluminescent sources reconstructed on the two kidneys respectively(b) Two tumors at the same locations on the dissected kidneys after in-vivo
experiment.

16
Conclusion
• A BLT prototype and a reconstruction methodology are developed
• In vivo mice experiments show that BLT can effectively localize and quantify the bioluminescent source inside small animals
• The report is the first in vivo BLT study using the deformable atlas based meshing approach to compensate for the anatomical heterogeneity

17
Discussion and improvement
• BLT Relies heavily on– The permissible source region– Co-registration with other synergic modalities– Practical geometrical model of mouse: MRI atlas-b
ased approach– Accurate optical properties

18
Effects of optical properties• Variation of optical properties
– 5% variations reconstructed results remained being good approximations to the true source (0.85mm position difference, and 20% error in power estimation).
– The larger variation the poorer the reconstruction quality will be (3mm position difference, 20% variations 100% error in power estimation).
– A reconstruction based on an incorrectly assumed homogeneous mouse body geometrically identical to this mouse The resultant reconstruction quality was seriously compromised (3.53 mm position difference, and 200% power errors).
To estimate optical properties in vivo as accurately as possible is critically important!----Diffuse optical tomography (DOT)
19
Three more references• Wendy Pang, Bioluminescence: Shedding new light
on biomedical research, Harvard Science Review, winter 2002: pp 34-36
• Timothy C. Doyle, Stacy M. Burns, and Christopher H. Contag, In vivo bioluminescence imaging for integrated studies of infection, Cellular Microbiology, 2004, 6(4): pp 303-317
• Christopher H. Contag, and Michael H. Bachmann, Advances in vivo bioluminescence imaging of gene expression, Annu. Rev. Biomed. Eng., 2002, 4: pp 235-260

20
Thanks!06/04/2007