
1 Hydroclimatology: The Missing Component of PUB Praveen Kumar Francina Dominguez, Geremew Amenu...
42
1 Hydroclimatology: The Missing Component of PUB Praveen Kumar Francina Dominguez, Geremew Amenu Institute for Sustainability of Intensively Managed Landscapes Department of Civil & Environmental Engineering University of Illinois Urbana, Illinois 61801
-
Upload
guillermo-churchman -
Category
Documents
-
view
219 -
download
0
Transcript of 1 Hydroclimatology: The Missing Component of PUB Praveen Kumar Francina Dominguez, Geremew Amenu...

1
Hydroclimatology: The Missing Component of
PUB
Praveen KumarFrancina Dominguez, Geremew Amenu
Institute for Sustainability of Intensively Managed Landscapes
Department of Civil & Environmental Engineering
University of IllinoisUrbana, Illinois 61801

2
“Hydrologists spend too much time thinking about water” Ciaran Harman

3
Global Water Vapor

4
a)
-1.0
-0.8
-0.6
-0.4
-0.2
0.0
0.2
0.4
0.6
0.8
1.0
1988 1989 1990 1991 1992 1993 1994 1995 1996 1997 1998 1999 2000
Mon
thly
PW
Ano
mal
y (m
m)
-0.5
-0.4
-0.3
-0.2
-0.1
0.0
0.1
0.2
0.3
0.4
0.5
Mon
thly
T A
nom
aly
(oC
)NVAP R-2 T
b)
-0.8
-0.6
-0.4
-0.2
0.0
0.2
0.4
0.6
0.8
1988 1989 1990 1991 1992 1993 1994 1995 1996 1997 1998 1999
Ann
aul P
W A
nom
aly
(mm
)
-0.4
-0.3
-0.2
-0.1
0.0
0.1
0.2
0.3
0.4
Ann
ual T
Ano
mal
y (
oC
)
NVAP R-2 T
c)
R2 = 0.6615
-1.0
-0.8
-0.6
-0.4
-0.2
0.0
0.2
0.4
0.6
0.8
1.0
-1.0 -0.8 -0.6 -0.4 -0.2 0.0 0.2 0.4 0.6 0.8 1.0
Monthly NVAP Anomaly (mm)
Mon
thly
R-2
Ano
mal
y (m
m)
d)
0.3
0.4
0.5
0.6
0.7
0.8
0 1 2 3 4 5
Time Lag (months)
Cro
ss-C
orre
lati
on
NVAP & T
R-2 & T
Amenu, G.G. and P. Kumar, BAMS, 86(2), pp. 245-256, 2005.

5
Underlying Question
• How do the atmospheric and terrestrial moisture, and vegetation interact to produce the observed variability in the water cycle?
• How is this variability altered by anthropogenic influences?– Energy Cycle– Water Cycle
E
Pm

6
Near surface processes
Atmospheric Anomalies
Ocean Ocean
Enhancement or Dissipation of Anomalies through Feedback
Feedback between near- and deep-surface processes
Feedback between atmosphere and deep layer processes?
Ocean-atmosphere feedback
Deep layer processes
Land

7
Hypothesis• Regional atmospheric
moisture transport is governed by both the large scale forcing as well as local recycling, and their relative contributions have important implications in the inter-annual variability of the hydrologic cycle.
• The deep layer terrestrial moisture and energy storage modulate the dynamics of the near-surface layer thereby influencing the land-atmosphere interaction.
8
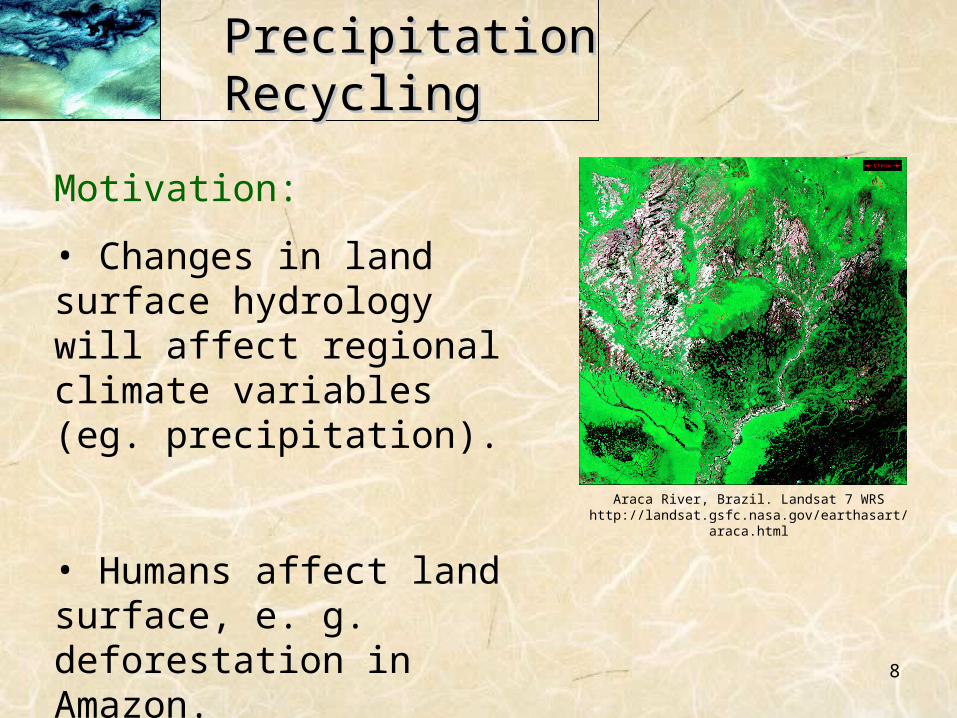
Precipitation Precipitation RecyclingRecycling
Motivation:
• Changes in land surface hydrology will affect regional climate variables (eg. precipitation).
• Humans affect land surface, e. g. deforestation in Amazon.
Araca River, Brazil. Landsat 7 WRS http://landsat.gsfc.nasa.gov/earthasart/araca.html

9
PEy
wv
x
wu
t
w
)()(
The principle for all analytic recycling models is the conservation of atmospheric mass
All previous recycling models have assumed negligible change of storage of atmospheric water vapor.
Analytic Models that assume negligible dw/dt:
-Budyko (1974)
-Drozdov and Grigor’eva (1965)
-Lettau et al. (1979)
-Brubaker et al. (1993)
-Eltahir and Bras (1994)
-Savenije (1995)
-Burde and Zangvil (2001)

10
While the storage term is smaller than the advection terms, it is nonegligible at a daily timescale
Storage term is small compared to advection at a monthly timescale.
At the daily level, it is approximately 50% as large as the advection terms.
- Using NCEP/NCAR Reanalysis II data from 1979-2001.
Daily
Monthly
y
wv
x
wu
t
w
)()(

11
Consequently, older models are not applicable at smaller time scales.
Recycling can be now studied at daily, weekly, and longer timescales.
Decade MonthSeasonYear Week Day Hour Minute
Important Land - Atmosphere Interactions occur at this timescale.
Assumption: Well mixed atmosphere.
Dominguez, F. and P. Kumar, “Impact of Atmospheric Moisture Storage on Precipitation Recycling,” Journal of Climate, 19 (8), pages 1513–1530, 2006.
12
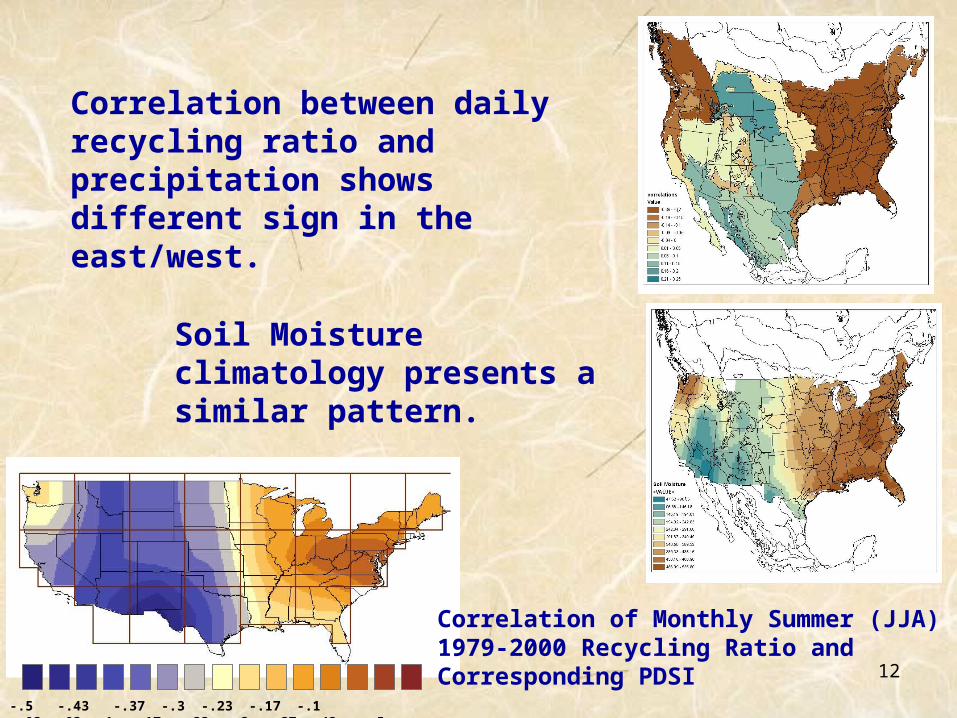
Correlation between daily recycling ratio and precipitation shows different sign in the east/west.
Soil Moisture climatology presents a similar pattern.
-.5 -.43 -.37 -.3 -.23 -.17 -.1 -.03 .03 .1 .17 .23 .3 .37 .43 .5
Legendmpdsirmnt<VALUE>-0.5 - -0.43
-0.42 - -0.37-0.36 - -0.3-0.29 - -0.23-0.22 - -0.17-0.16 - -0.1-0.09 - -0.03-0.02 - 0.030.04 - 0.100.11 - 0.170.18 - 0.230.24 - 0.30.31 - 0.370.38 - 0.430.44 - 0.5
Correlation of Monthly Summer (JJA) 1979-2000 Recycling Ratio and Corresponding PDSI

13
Understanding the physical mechanisms that drive recycling variability at the Daily to Intraseasonal Timescale
We choose two regions because of their contrasting land surface response to precipitation.
Semi-arid North American Monsoon Region.
Moisture-abundant Midwestern United States.

14
The Dynamical Recycling Model is used to calculate the recycling ratios
The NARR data provides land-atmosphere variables
Multichannel Singular Spectrum Analysis (M-SSA)
MODE 1
MODE 2
MODE 3
MODE 4

15
CEC Level II Ecoregions of NA
10.4
10.2
13.1
13.2
12.1
14.3
The NAMS region is composed of a variety of ecoregions, from deserts (lightest green) to tropical dry forests (darkest green).
Sonoran Desert
Upper Gila Mountains
Western Pacific Coastal Plain Hills And Canyons
Western Sierra Madre
Western sierra MadrePiedmont
Chihuahuan Desert

16
In the NAMS region, evapotranspiration significantly contributes to precipitation after monsoon onset.
At the peak of the season, an average of 15% of precipitation comes from evapo-transpiration, although some days it can be as high as 25%.

17
gmons86q9v2Value
High : 1.500000 Low : 0.000000
gmons86q9v3Value
High : 0.500000 Low : 0.000000
grdndvi89aug1Value
High : 7000.000000 Low : 0.000000
gmons86q9v4Value
High : 0.900000 Low : 0.000000
Recycled Precipitation (mm/day)
Evapo-transpiration (mm/day)
Precipitation (mm/day)
NDVI
0 1.5 0 0.7
07.2
0 4
Precipitation, evapotranspiration and vegetation greenness is higher in the southwest of the region
Evapotranspiration is transported north and east where it falls as precipitation of recycled origin.

18
The three longest monsoons in the 1985-1995 period are characterized by two precipitation peaks.
Precipitation recycling peaks during the intermediate dry period (midsummer drought - also called veranillo or canicula).

19
Recycling Ratio Evapo-transpiration (mm/day)
Precipitation (mm/day) NDVI
Low Mid-Summer Precip
No effect on NDVINo effect on
Evaporation
Recycling continues during dry season.
During long monsoons, even when precipitation decreases, ET continues to provide moisture to the overlying atmosphere.
Region 14.3, Seasonally Dry Tropical Forest

20
The region faces sever damage to existing vegetation health and consequently evapotranspiration regimes.
The seasonally dry tropical forests of Mexico have an annual deforestation rate of 1.4% (Trejo and Dirzo, 2004).
Our results show that this could have important consequences for precipitation regimes.
21

22
Hydraulic Redistribution by Plant Roots:
A Mechanism of Interaction between Moisture Reservoir of
Deep-Soil, the Near-Surface Soil, and the Atmosphere

23
Global Datasets•••
•••Ground Observations:
Very few locations, with poor spatial and temporal coverage
Illinois dataset is exceptionally unique dataset available
Remote Sensing:Only near-surface
soil moisture is measured
No long-term data
L1
L2
L3
L10
L11
10 cm
20 cm
20 cm
20 cm
10 cm
20 cm
each
24
0
10
20
30
40
50
60
0.001 0.01 0.1 1Frequency (cycles/month)
Pow
er (
norm
aliz
ed)
0
10
20
30
40
50
60
0.001 0.01 0.1 1Frequency (cycles/month)
Pow
er (
norm
aliz
ed)
0
10
20
30
40
50
60
0.001 0.01 0.1 1Frequency (cycles/month)
Pow
er (
norm
aliz
ed)
0
10
20
30
40
50
60
0.001 0.01 0.1 1Frequency (cycles/month)
Pow
er (
norm
aliz
ed)
Layer1 0-10 cm
Layer 5 70-90 cm
Layer 7 110-130 cm
0
10
20
30
40
50
60
0.001 0.01 0.1 1Frequency (cycles/month)
Pow
er (
norm
aliz
ed)
0
10
20
30
40
50
60
0.001 0.01 0.1 1Frequency (cycles/month)
Pow
er (
norm
aliz
ed) Layer 3
30-50 cm
Layer 9 150-170 cm
Layer 11 190-200 cm
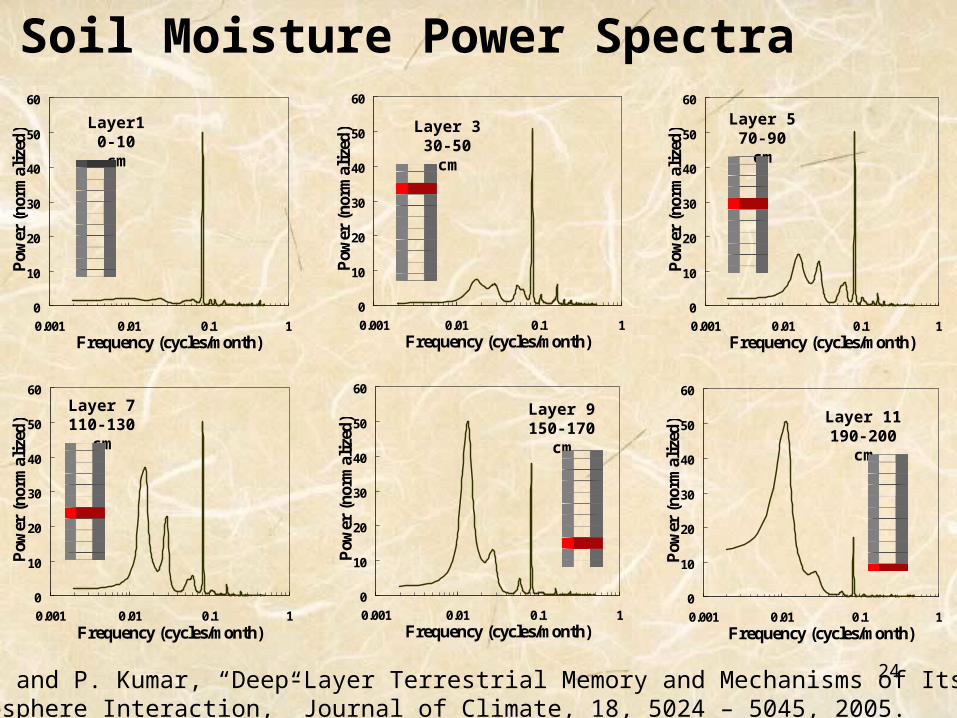
Soil Moisture Power Spectra
Amenu, G.G., and P. Kumar, “Deep‑Layer Terrestrial Memory and Mechanisms of Its Influence on Land-Atmosphere Interaction,” Journal of Climate, 18, 5024 – 5045, 2005.

25
Singular Spectrum Analysis (SSA) is used to extract the dominant modes
0
10
20
30
40
50
60
0.00 0.02 0.04 0.06 0.08 0.10 0.12
Frequency (cycles/month)
Pow
er (n
orm
aliz
ed)
Quasi-Quadrennial
(QQ) ENSO
T ≈ 5 yrs
Quasi-Biennial
(QB) ENSO
T ≈ 2.8 yrs (4/3)
ENSO
T ≈ 1.5 yrs
Annual
Cycle
T = 1 yr
The (4/3) ENSO is a result of nonlinear interaction (sub-harmonic frequency locking) between the Quasi-Quadrennial and the Annual modes.
26
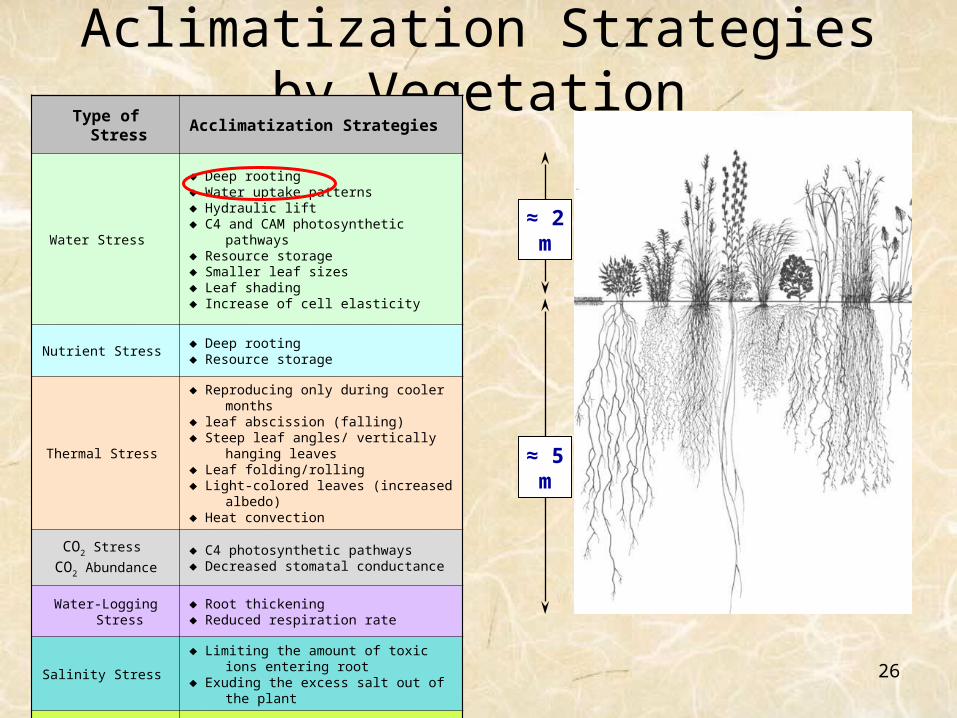
Aclimatization Strategies by Vegetation
Type of Stress Acclimatization Strategies
Water Stress
♦ Deep rooting ♦ Water uptake patterns ♦ Hydraulic lift ♦ C4 and CAM photosynthetic pathways ♦ Resource storage ♦ Smaller leaf sizes ♦ Leaf shading ♦ Increase of cell elasticity
Nutrient Stress ♦ Deep rooting ♦ Resource storage
Thermal Stress
♦ Reproducing only during cooler months ♦ leaf abscission (falling) ♦ Steep leaf angles/ vertically hanging leaves ♦ Leaf folding/rolling ♦ Light-colored leaves (increased albedo) ♦ Heat convection
CO2 Stress
CO2 Abundance♦ C4 photosynthetic pathways♦ Decreased stomatal conductance
Water-Logging Stress ♦ Root thickening ♦ Reduced respiration rate
Salinity Stress ♦ Limiting the amount of toxic ions entering root ♦ Exuding the excess salt out of the plant
Competition ♦ Resource partitioning ♦ Exuding the excess salt out of the plant
≈ 2 m
≈ 5 m

27
0
5
10
15
20
25
30
Arizon
a
Califo
rnia
Color
ado
Florid
a
Iowa
Miss
ouri
Nebra
ska
New M
exico
New Y
ork
Orego
n
S. Car
olina
Texas
Virgin
ia
Was
hingt
on
Max
. Roo
t D
epth
(m
)
Observed Max. Rooting Depths
for USA
53 m 61 m
0
10
20
30
40
50
60
70
Tropic
al Eve
rgree
n For
est
Tropic
al Dec
iduo
us F
ores
t
Tropic
al Gras
sland
/Sav
ana
Deser
t
Shrub
s
Tempe
rate G
rassl
and
Tempe
rate D
ecid
uous
For
est
Tempe
rate C
onife
rous
For
est
Cropl
and
Borea
l For
est
Tundr
a
Roo
t D
epth
(m
)
Maximum Root Depth
Average Root depth
Approximate Maximum Rooting Depth for
Current Climate Models
Based on the study by Canadell et al. (1996) & Kleidon and Heimann (1998)
Plant roots are much deeper than traditionally thought in our modeling approaches. In particular, this is true for water-limited environments

28
Hydraulic Redistribution is the passive transport of soil water via plant roots from wet soil layers to dry soil layers.
During day: the greatest water potential gradient in the plant exists between the roots and the leaf stomata. As a result of this gradient, water moves from the roots and exits the transpiring leaves.
During night: the stomata closes, but water continues to flow into
the deeper taproots. These results in turgor pressure that increases water potential within the plant body, and finally start to efflux
from the roots into the drier soil.

29
Water Uptake Pattern
Rambal (1984) identified four patterns of water uptake in Quercus coccifera during a dry summer season. In late spring, water loss occurred exclusively from the top 0-50 cm soil layer. In early summer, peak water uptake occured between 2 and 2.5 m depth. Late summer, the deepest soil layers were contributing much of the water. In early fall at the end of the dry period, all the layers were depleted.

30
Evidences of Hydraulic Redistribution
SOURCE PLANT SPECIES LOCATION
Mooney et al. (1980) Shrubs Atacama Desert, Chile
Baker & van Bavel (1988) Cotton Lab Experiment
Caldwell & Richards (1989) Sagebrush, Wheatgrass Utah, USA
Dawson (1993) Sugar Maples New York, USA
Wan et al. (1993) Broom Snakeweed Texas, USA
Emerman & Dawson (1996) Sugar Maples New York, USA
Burgess et al. (1998) Silky Oak, Eucalyptus tree Kenya, Western Australia
Yoder & Nowak (1999) Shrubs, Grasses Mojave Desert, Nevada, USA
Burgess et al. (2000) Proteaceous tree Western Australia
Millikin & Bledsoe (2000) Blue Oaks California, USA
Song et al. (2000) Sunflower Lab Experiment, Kansas
Wan et al. (2000) Maize Lab Experiment
Brooks et al. (2002) Ponderosa pine, Douglas-fir Oregon, Washington, USA
Ludwig et al. (2003) Woody trees (savanna) Tanzania
Moreira et al. (2003) Savanna Brazil
Espeleta et al. (2004) Oaks, bunch grass South Carolina, USA
Hultine et al. (2004) Leguminous tree Arizona, USA
Leffler et al. (2005) Cheatgrass Rush Valley, Utah, USA
Oliveira et al. (2005) Amazon trees Brazil

31
Xylem
Phloem
Water flow the plant system
zkq
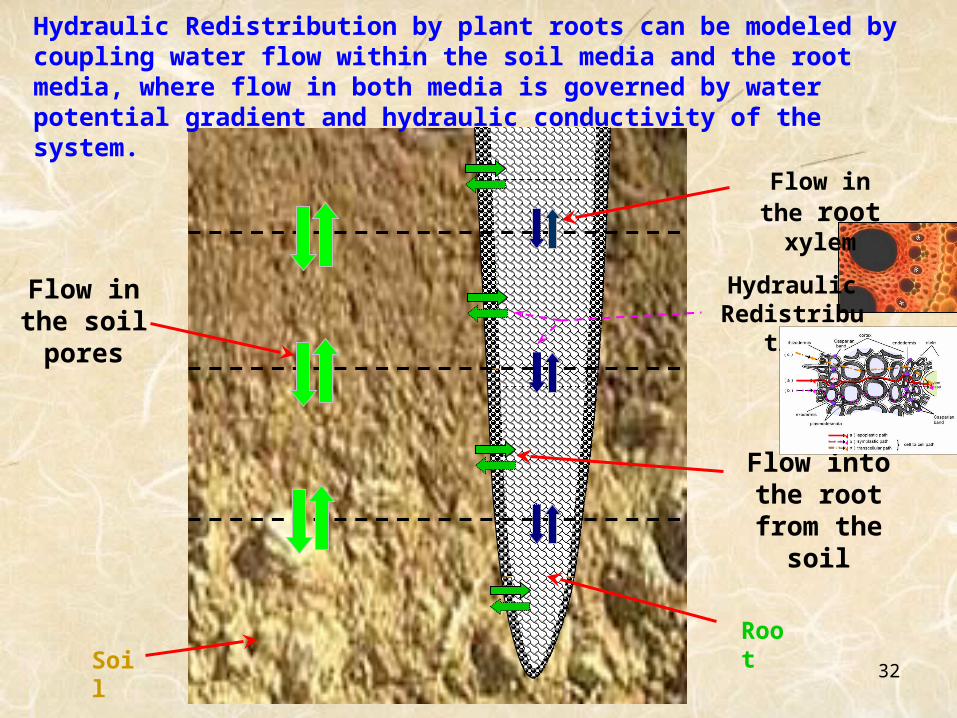
32
Flow in the root xylem
SoilRoot
Flow in the soil pores
Flow into the root from the
soil
Hydraulic Redistribution
Hydraulic Redistribution by plant roots can be modeled by coupling water flow within the soil media and the root media, where flow in both media is governed by water potential gradient and hydraulic conductivity of the system.

33
Fresno
Boundary of study site
0
20
40
60
80
100
120
140
160
180
Jan
Feb Mar Apr
May Ju
n Jul
Aug Sep OctNov Dec
Pre
cipi
tati
on (
mm
)
CASE STUDY SITE:
The major PFTs at the site include C3 grasses (52%), needle leaf evergreen temperate trees (46%), and broadleaf deciduous temperate trees (2%)

34
Application Example
0.01
0.1
1
10
-0.5 0 0.5 1 1.5 2 2.5
Water Uptake (10-5 mm/s)
Soil d
epth
(m
)
During Day
Day-1
Day-120
0.01
0.1
1
10
-0.5 0 0.5 1
Water Uptake (10-5 mm/s)
Soil d
epth
(m
)
During Night
Day-1
Day-120

35
Application Example
0.01
0.1
1
10
-40 -20 0 20 40 60 80
Total Water Uptake (mm)
Soil d
epth
(m
)
Net Uptake
Uptake
Release

36
0 50 100 150 200 250 3000
25
50
75
100
125
150Et
(W/m
2 )[Case1] without HR [Case2] with HR
0 50 100 150 200 250 300-20
0
20
40
60
80
100
Chan
ge in E
t (W
/m2 )
Effect of HR: [Case2-Case1]
2 4 6 8 10 120
25
50
75
100
125
Et
(W/m
2 )
1 2 3 4 5 6 7 8 9 10 11 12-20
0
20
40
60
80
Time (months)
Chan
ge in E
t (W
/m2)
Effect of HR
1 2 3 4 5 6 7 8 9 10 11 12-50
0
50
100
150
200
Chan
ge in E
t (%
)
Effect of HR
Moisture Flux Through Plant Leaves (Transpiration)
without HRwith HR
0 50 100 150 200 250 3000
4
8
12
16
20
A (
mol
/m2s)
0 50 100 150 200 250 300-5
0
5
10
15
20
Chan
ge in A
(m
ol/m
2s)
Effect of HR: [Case2-Case1]
2 4 6 8 10 120
3
6
9
12
15
18
A (
mol
/m2s)
1 2 3 4 5 6 7 8 9 10 11 12-3
0
3
6
9
12
Time (months)
Chan
ge in A
(m
ol/m
2s)
Effect of HR
1 2 3 4 5 6 7 8 9 10 11 12-100
0
100
200
300
400
Chan
ge in A
(%
)
Effect of HR
[Case1] without HR [Case2] with HR
Carbon Assimilation (Photosynthesis)
without HRwith HR
0 50 100 150 200 250 3000
2
4
6
8
10
WU
E
Water-Use-Efficiency (WUE)
0 50 100 150 200 250 300-0.2
0
0.2
0.4
0.6
0.8
1
Chan
ge in W
UE Effect of HR: [Case2-Case1]
2 4 6 8 10 120
1
2
3
4
WU
E
1 2 3 4 5 6 7 8 9 10 11 120
0.1
0.2
0.3
0.4
0.5
Time (months)
Chan
ge in W
UE Effect of HR
1 2 3 4 5 6 7 8 9 10 11 120
50
100
150
200
Chan
ge in W
UE (
%)
Effect of HR
[Case1] without HR [Case2] with HR
with HR
without HR

37
Are hydroclimatology and ecohydrology two sides of the
same coin?• Optimality Hypothesis: evolutionary selection
pressures drive ecosystems towards a state of maximum utilization of available light, water and nutrient resources for the production of biomass
• Acclimatization Hypothesis:Vegetation form and function from the canopy to the ecosystem scale are a reflection of the acclimatization strategies adopted by the vegetation to maximize CO2-assimilation in the presence of the spatial and temporal variability of the controlling factors
• Complexity Hypothesis: Co-evolution of the eco-hydrologic environment and vegetation patterns and functioning, in the presence of complex non-linear feedbacks results in self-organization

38

39
So
il Ca
rbo
n
Soil Moisture
Atmospheric Moisture
Temperature
Atmospheric CO2
Photosynthesis
Biomass
Respiration
Stomatal Conductance
Transpi-ration
Sensible Heat
Instability
Boundary Layer Conductance
Cloud Formation
Precipitation
Longwave Radiation
Shortwave Radiation
Evapo-ration
Streamflow
River CO2
Root Water Uptake
Glo
bal O
cean
and
Atm
osph
ere
- C
limat
e S
cale
Root Growth
Shoot Growth
Albedo

40
Basic Characteristics of Water Cycle
• Natural systems associated with the water cycle are under continual evolution.
• Water is both a “driver” (through hydrologic variability) and a “medium” of interaction for a variety of natural processes.
– The two roles are fundamentally different.
• Water cycle consists of a network of cycles that interact with each other, that is, the water cycle is a hypercycle.
– The interaction between these cycles provides a mechanism for the dynamic stability of the water and energy cycle in the presence of positive and negative feedback cycles.

41
On the Role of Hydrologic Variability
• “Hydrologic variability” plays a role as important as the variability of energy in driving all global systems
• This independent (but linked) role suggests that global systems (ecological, biogeochemical, …) are as vulnerable to the anthropogenic changes in the water cycle as they are to the changes in the energy cycle
Water CycleEnergy Cycle
Sustainability and Environment

42
ConclusionsClimate and ecology interact to define atmospheric pathways that are at the heart of hydrologic variability.
Vegetation should be seen as an adaptively and actively modifing the water cycle.
Water is both a driver and a medium of interaction for open dissipative systems – water cycle is A hypercycle.


![Raleigh 1850 Census - pwcvirginia.compwcvirginia.com/documents/Raleigh1850Census.pdf · Bragg Nancy 55 [widow of Thomas Bragg ] Hazard 18 [m. Francina Redden d/o Wm. & Fanny ] Mary](https://static.fdocuments.in/doc/165x107/5f0a233e7e708231d42a31dc/raleigh-1850-census-bragg-nancy-55-widow-of-thomas-bragg-hazard-18-m-francina.jpg)


