1 Housestaff Lean Academy Module 3: Examining the Current State (Process Mapping, Observations, and...
15
1 Housestaff Lean Academy Module 3: Examining the Current State (Process Mapping, Observations, and Waste) Robert Martin, PsyD Performance Excellence UCLA Health
-
Upload
coral-jasmin-robertson -
Category
Documents
-
view
221 -
download
1
Transcript of 1 Housestaff Lean Academy Module 3: Examining the Current State (Process Mapping, Observations, and...

1
Housestaff Lean Academy
Module 3: Examining the Current State (Process Mapping, Observations, and Waste)
Robert Martin, PsyD
Performance Excellence
UCLA Health

2
Module # Module Description
1 Lean Principles for Physicians (Important Concepts)
2 Using A3* and PDCA Methodology for your improvement project(s)
3 Examining the Current State (Process Mapping , Observations, & Waste)
4 How to use Root Cause Analysis
5 Organizing & Using Data
6 Identifying Improvements & Actions (A3 Simulation)
7 Working as a Team (Frontline Empowerment & Engagement)
8 Sustaining Improvements through Standard Work
9 Understanding & Leading Change
10 UCLA Operating System - Supporting Infrastructure (ADM, Huddles, A3/A4 Methodology)
Where does this module fit into the curriculum?

Module 1 Summary
3
Value
Waste
Scientific
Method
(PDCA / A3)
Empowered
Staff
Alignment
Use these concepts to focus your improvement project
Use these concepts to maximize your improvement project’s chance for
success
Use the A3 and PDCA methodology (i.e. scientific method for
improvement) to manage and communicate your improvement project

Module 2 Summary
4
A3-Problem Solving (11 x 17)
Use for:• Complex problems• Gaining consensus• Communicating• Managing the project
Use if:• Root Causes to problems
are unknown• Solutions aren’t obvious
Requires Planning (PDCA) and data collection & analysis

Documenting the Current State is beneficial
• Idea collection, observations, and discussions of “pain points”
engages staff , improves shared understanding and teaming
• Illustrates a process or patient pathway from both the staff and
patient’s perspectives
• The resulting documentation (a process map, observation sheets,
spaghetti charts, etc.):• Is easy to understand, highly visual, and aids the change process
• Help to identify steps that don't directly contribute to patient care (bottlenecks,
constraints, problems/issues = waste)
• Help to identify steps that do contribute to patient care (value-added)
5
Tools
Process Maps
Time Observation
Sheets
Spaghetti Charts
Waste Analysis

Process Mapping
• A simple language not taught in medical school• Organized visualization of interrelated activities
which combine to form a process, patient pathway, or process of care
• There are more symbols, but these are the most important:
• Process Mapping can be mapped in several ways!
6
Tools
Process Maps
Time Observation
Sheets
Spaghetti Charts
Waste Analysis
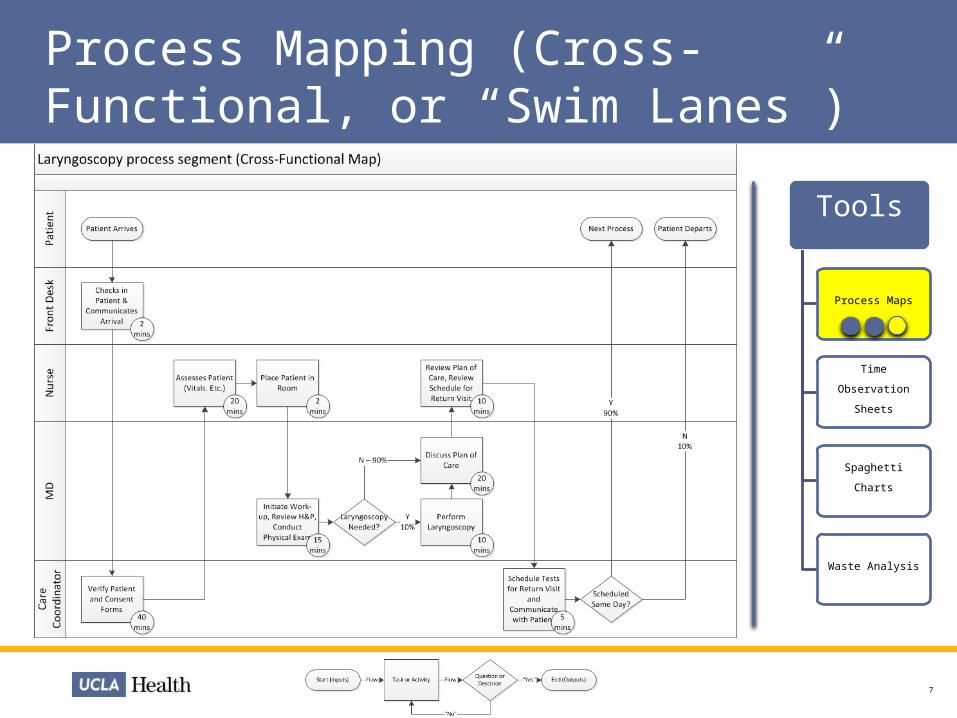
Process Mapping (Cross-Functional, or “Swim Lanes”)
7
Tools
Process Maps
Time Observation
Sheets
Spaghetti Charts
Waste Analysis

Process Mapping (Linear/Phased)
8
Tools
Process Maps
Time Observation
Sheets
Spaghetti Charts
Waste Analysis
This might required a more detailed map
or Time Observation Sheets
Where activity takes the longest on this map?

Using Time Observation Sheets*
9
Tools
Process Maps
Time Observation
Sheets
Spaghetti Charts
Waste Analysis
You can use TOS or more
detailed Process Maps to
further understand problems
Running clock is used
Calculations can be done after (i.e. 8:20 – 8:02 = 18 mins)
Multiple Observations
Remarks can be captured for
further analysis
*Template is available

Using Spaghetti Charts*
10
Tools
Process Maps
Time Observation
Sheets
Spaghetti Charts
Waste Analysis
You can use Spaghetti Charts
to show the impact of motion
and movement, and to
improve flow
*Template is available
Spaghetti Diagram Date:
Area: Process: Distance:
Step Description Distance
1 Pt walks into Clinic
2
Scheduler/Registrar checks patient into CareConnect and
directs PT to waiting room
3
Patient waits for Care Coordinator
4 Care Coordinator calls patient to the back
5
CC verifies PT in CareConnect
6 Patient completes consent forms
7 CC reviews forms for errors and completion
8
CC directs patient back to waiting room
9
Patient waits for Nurse
10 Nurse calls PT back
11
12
13
14
21
1
23
4-8
9
10
Steps can be copied over from
Time Obs. Sheets
Distance can be
measured

5) Transport
• Is there any transport waste?
6) Inventory
• Is there any inventory waste?
7) Motion
• Is the PT being moved too
much?
8) Extra-Processing
• Is there any rework from defects
or other waste?
While doing observations, you can find more “waste” when you examine with a model*:
11
Tools
Process Maps
Time Observation
Sheets
Spaghetti Charts
Waste Analysis
1) Defects
• How many defects are the Care
Coordinator finding? What is
the impact?
2) Overproduction
• Are there any unnecessary
forms we ask the patient to fill
out?
3) Waiting
• Patient is waiting at least 24
minutes. Is the MD waiting?
Other bottlenecks?
4) Not Utilizing Talent
• Can the registrar be trained to
do consent if the Care
Coordinator isn’t available?
Process Maps Time Observation Sheets Spaghetti Charts
*Template for practicing 8 wastes is available
The 8 Wastes

Using Time Observation Sheets*
12
Tools
Process Maps
Time Observation
Sheets
Spaghetti Charts
Waste Analysis
You can use TOS or more
detailed Process Maps to
further understand problems
Waiting: Why 18 minutes waiting for the Care
Coordinator to do consent forms!
Not utilizing Talent: Can another function help when CC
is doing Plan of Care Scheduling?
Defects & Extra Processing:
Why are their defects? What
type? What is the impact of
defects?
Overproduction: Are all of the
forms necessary?
*Template is available

Once the Current State is understood, you can analyze the “root causes” of the waste (next module) to eliminate them
13
Tools
Process Maps
Time Observation
Sheets
Spaghetti Charts
Waste Analysis
Pareto Cause & Effect Diagrams 5 Why Analysis
The 8
Wastes

14
Module # Module Description
1 Lean Principles for Physicians (Important Concepts)
2 Using A3 and PDCA Methodology for your improvement project(s)
3 Examining the Current State (Process Mapping , Observations, & Waste)
4 How to use Root Cause Analysis
5 Organizing & Using Data
6 Identifying Improvements & Actions (A3 Simulation)
7 Working as a Team (Frontline Empowerment & Engagement)
8 Sustaining Improvements through Standard Work
9 Understanding & Leading Change
10 UCLA Operating System - Supporting Infrastructure (ADM, Huddles, A3/A4 Methodology)
What module is next?*
* Thank you! Please complete your post-questions

15