1 High Resolution In Situ Study of Nutrient Loading and Estuarine Response in the Columbia River...
19
1 High Resolution In Situ Study of Nutrient Loading and Estuarine Response in the Columbia River Observation ● Prediction ● Analysis ● Collaboration www.stccmop.o rg Melissa Gilbert Needoba, J. A. Koch, C. Barnard, A. Baptista, A. Acknowledgements: Needoba/Peterson Lab CMOP Staff CMOP Astoria Field Team
-
Upload
lydia-bridges -
Category
Documents
-
view
214 -
download
1
Transcript of 1 High Resolution In Situ Study of Nutrient Loading and Estuarine Response in the Columbia River...

1High Resolution In Situ Study
of Nutrient Loading and Estuarine Response in the
Columbia River
Observation ● Prediction ● Analysis ● Collaboration
www.stccmop.org
Melissa GilbertNeedoba, J. A.
Koch, C. Barnard, A. Baptista, A.
Acknowledgements:
Needoba/Peterson LabCMOP Staff
CMOP Astoria Field Team
2Columbia River
Washington
Pacific Ocean
OregonSATURN-
03
SATURN-05
River
Lower Estuary
RM-17
Upper Estuary

3The Study (Summer 2010) - Hypothesis
DenitrificationDecrease in nitrate
RemineralizationIncrease in ammoniumIncrease in phosphate
Estuary River

4
The Columbia River supplies excess nitrate to the estuary
all year
Seasonal Variability in the Columbia River
SUNA Nitrate Sensor at SATURN-05
403020100
Nitra
te (µ
M)
7/1/2009 10/1/2009 1/1/2010 4/1/2010 7/1/2010
Date
0.6
0.4
0.2
0.0
Ph
osp
ha
te (
µM
)
120100
80604020
0
N/P
Ra
tio
40
30
20
10
0
Nitr
ate
(µ
M)
7/1/2009 10/1/2009 1/1/2010 4/1/2010 7/1/2010
Date
24.8

5
40
30
20
10
0
Nitrate (µ
M)
AP
NA
11/1/2009 2/1/2010 5/1/2010 8/1/2010 11/1/2010
Date
4.0
3.0
2.0
1.0
0.0
Pho
spha
te (
µM
)C
ycle
-PO
4Estuary Data

6
50
40
30
20
10
0
N/P
Rat
io
11/1/2009 2/1/2010 5/1/2010 8/1/2010 11/1/2010Date
N/P Ratios in the estuary
NO3-NPO4-P

7N/P Ratios in the Estuary
3210
Pho
sph
ate
(µ
M)
Cyc
le-P
O4
7/29/2010 8/2/2010 8/6/2010 8/10/2010 8/14/2010 8/18/2010
Date
403020100
Nitra
te (µ
M)
AP
NA
20
15
10
5
0
N/P
Ra
tio
2.0
1.0
0.0
Tid
alH
eig
ht
(m)

8
30
25
20
15
10
5
0
Nitr
ate
(µM
)
302520151050Salinity
Ebb Tide7/30/20101600-2200
y = 0.88*x+1.71
R2 = 0.9978
30252015105
Sal
inity
12:00 AM7/30/2010
12:00 PM 12:00 AM7/31/2010
12:00 PM
Date
403020100
Nitrate (µ
M)
2.0
1.0
0.0
Tidal H
eight (m)
Calculating End Member Concentrations
SATURN-03
Salinity 32.4 = ocean end
member nitrate concentration
Intercept = River end member nitrate
concentration

9
30252015105
Sal
inity
12:00 AM7/30/2010
12:00 PM 12:00 AM7/31/2010
12:00 PM
Date
3
2
1
0
Phosphate (µ
M)
2.0
1.0
0.0
Tidal H
eight (m)
Calculating End Member Concentrations
SATURN-03
Salinity 32.4 = ocean end
member nitrate concentration
Intercept = River end member nitrate
concentration
3.0
2.5
2.0
1.5
1.0
0.5
0.0
Pho
sph
ate
(µ
M)
302520151050
Salinity
Ebb Tide7/30/20101600-2200
y = 0.048*x+0.8575
R2 = 0.9907
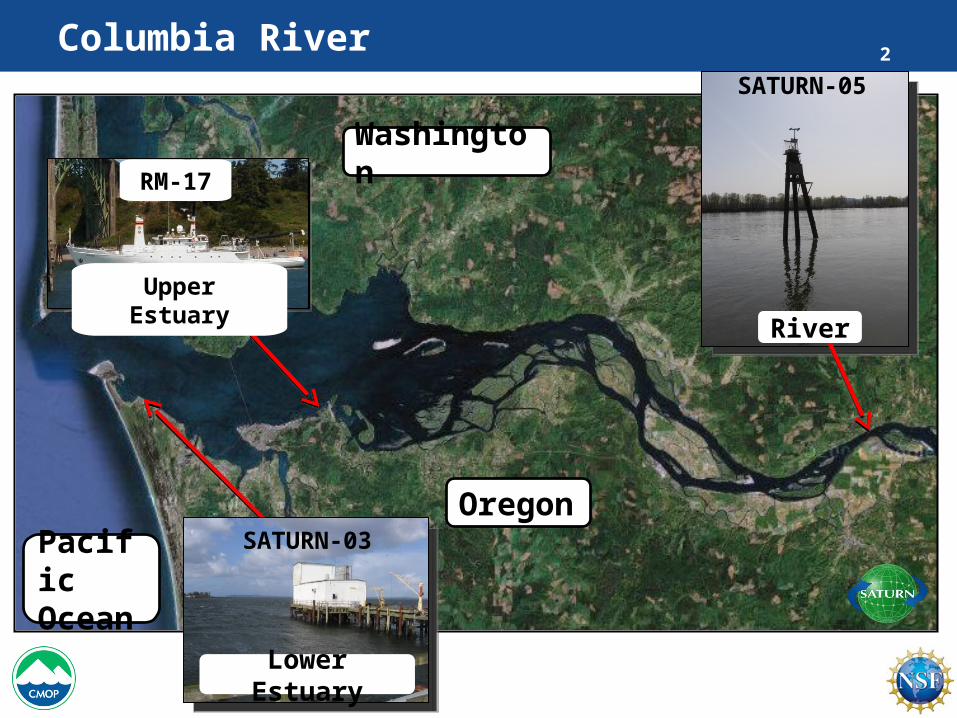
10Calculating End Member N/P Ratios
N/P Ratio of River End Member = 6.4
20
15
10
5
0
N/P
Ra
tio
7/31/2010 8/4/2010 8/8/2010 8/12/2010 8/16/2010
Date
210-1
Tid
al H
eig
ht (m
)
Estuary Ocean River

11The Study (Summer 2010) - Hypothesis
DenitrificationDecrease in nitrate
RemineralizationIncrease in ammoniumIncrease in phosphate
Estuary River
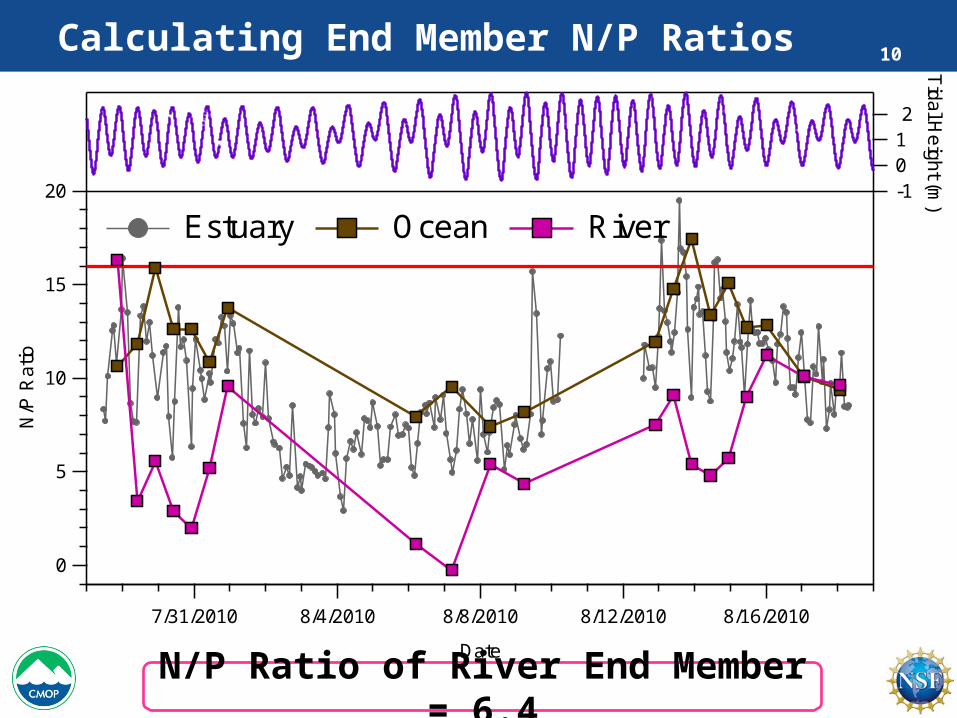
12Denitrification ?
Average nitrate loss of 1.3 μM
12
10
8
6
4
2
0
Nitr
ate
(µM
)
7/28/2010 8/2/2010 8/7/2010 8/12/2010 8/17/2010
Date (Estuary End Member)
7/27/2010 8/1/2010 8/6/2010 8/11/2010 8/16/2010
Date (River Data)
Estuary End Member River Data
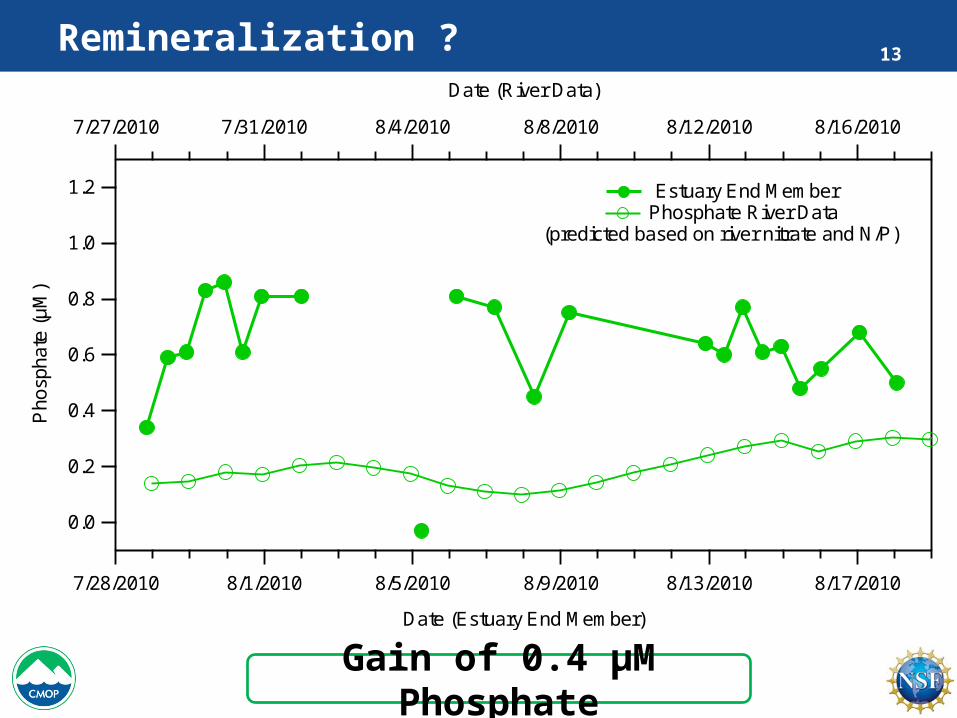
13Remineralization ?
Gain of 0.4 μM Phosphate
1.2
1.0
0.8
0.6
0.4
0.2
0.0
Pho
spha
te (
µM
)
7/28/2010 8/1/2010 8/5/2010 8/9/2010 8/13/2010 8/17/2010
Date (Estuary End Member)
7/27/2010 7/31/2010 8/4/2010 8/8/2010 8/12/2010 8/16/2010
Date (River Data)
Estuary End Member Phosphate River Data
(predicted based on river nitrate and N/P)
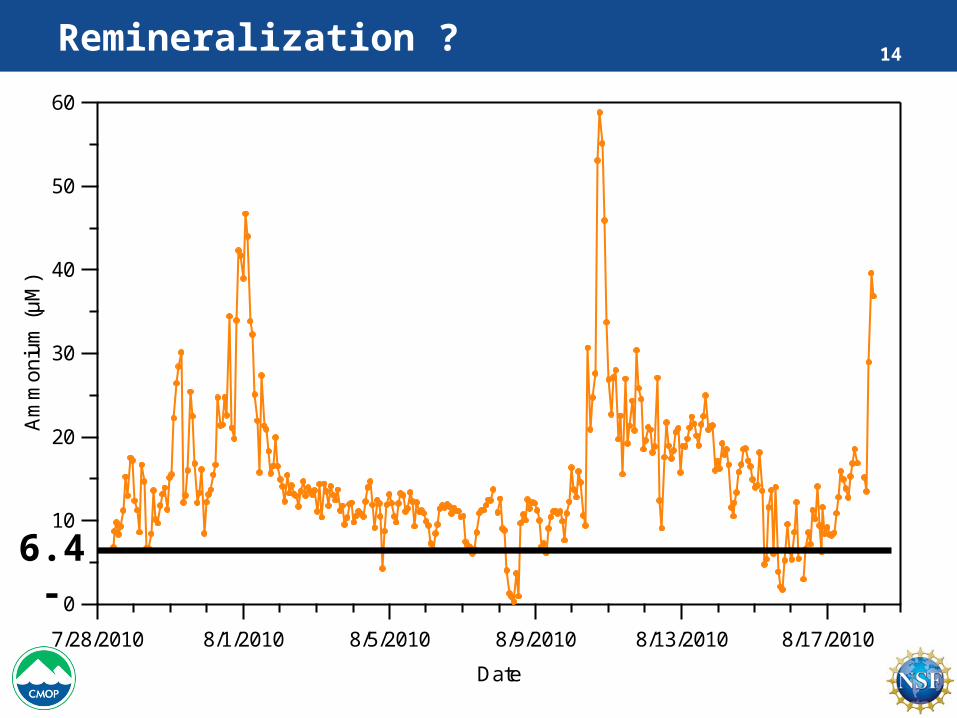
14
60
50
40
30
20
10
0
Am
mon
ium
(µ
M)
7/28/2010 8/1/2010 8/5/2010 8/9/2010 8/13/2010 8/17/2010
Date
Remineralization ?
6.4-

15The Study - Results
DenitrificationDecrease in nitrate
Estuary River
RemineralizationIncrease in ammoniumIncrease in phosphate

16
2520151050
Salinity
y = (0.31 ± 0.04) * x + (2.76 ± 0.38)
R2
= 0.7796
16
14
12
10
8
6
4
2
0
Am
mon
ium
(µ
M)
2520151050
Salinity
y = (0.20 ± 0.015) * x + (1.6 ± 0.24)
R2
= 0.9457
RM-172.0
1.5
1.0
0.5
0.0
Pho
spha
te (
µM
)
y = (0.028 ± 0.004) * x + (0.16 ± 0.06)
R2
= 0.8456
y = (0.04 ± 0.003) * x + (0.21 ± 0.02)
R2
= 0.9153
•Phosphate: Lower at RM- 17 than at SATURN-03•PO4 @ BAT = 0.14
•Higher river NH4 at RM-17 than at BAT but not as high as SATURN-03
•NH4 @ BAT = 0.34 μM
Remineralization or particle attachment?

17The Study - Results
DenitrificationDecrease in nitrate
Estuary River
RemineralizationIncrease in ammoniumIncrease in phosphate

18Conclusions
• Lower NO3-N/PO4-P ratios in the estuary than the river• Transport through fresh water marshes decrease nitrate by 25%,
increase phosphate 3X and increase ammonium 50X. • During summer months MORE reactive N may be leaving the
Columbia River and estuary in the form of ammonium than in nitrate
• The Columbia River and estuary may not remove large quantities of anthropogenic nitrate via denitrification during the summer months
High resolution in situ nutrient data yields evidence for an overwhelming
remineralization signal in the Columbia River during the summer
High resolution in situ nutrient data yields evidence for an overwhelming
remineralization signal in the Columbia River during the summer

19Acknowledgments and Funding SourcesOHSU/CMOP Advisor:
Joseph Needoba
CMOP Director: Antonio Baptista
Needoba LabFlorian MoellerMichelle Maier
Ezra-Mel Pasikatan
CMOP Staff:Charles Seaton
Paul TurnerSarah Riseman
Grant Law
CMOP Astoria Field Team: Michael WilkinKatie Rathmall
Greta Klungness
WetLabs:Corey Koch
Andrew Barnard
SubChem Systems Inc.