1 High Resolution Daily Sea Surface Temperature Analysis Errors Richard W. Reynolds (NOAA, CICS)...
32
1 High Resolution Daily Sea Surface Temperature Analysis Errors Richard W. Reynolds (NOAA, CICS) Dudley B. Chelton (Oregon State University)
-
date post
21-Dec-2015 -
Category
Documents
-
view
216 -
download
0
Transcript of 1 High Resolution Daily Sea Surface Temperature Analysis Errors Richard W. Reynolds (NOAA, CICS)...

1
High Resolution Daily Sea Surface Temperature
Analysis Errors
Richard W. Reynolds (NOAA, CICS)
Dudley B. Chelton (Oregon State University)

2
GHRSST & High Resolution
SST Analysis: Must be a balance between Signal and Noise
GHRSST
Reynolds & Chelton

3
Background• GHRSST (The Group for High
Resolution SST) includes many high resolution SST analyses
– There are differences in input data, grid resolution, analysis procedures
– There are important differences in analyzed SSTs and analysis resolution
• Reynolds and Chelton compared 6 SST analyses for 2006-08 to try to identify analysis problems and determine whether any of the analyses are superior

4
SST Analyses, 1 January 2007• RSS OI
– (~1/11)° grid
• NCEP RTG-HR– (1/12)° grid
• UK OSTIA– (1/20)° grid
• NCDC Daily OI: (AMSR + AVHRR) – (1/4)° grid
• Spatial scales differ
• Differences can exceed 5°C off coast
5
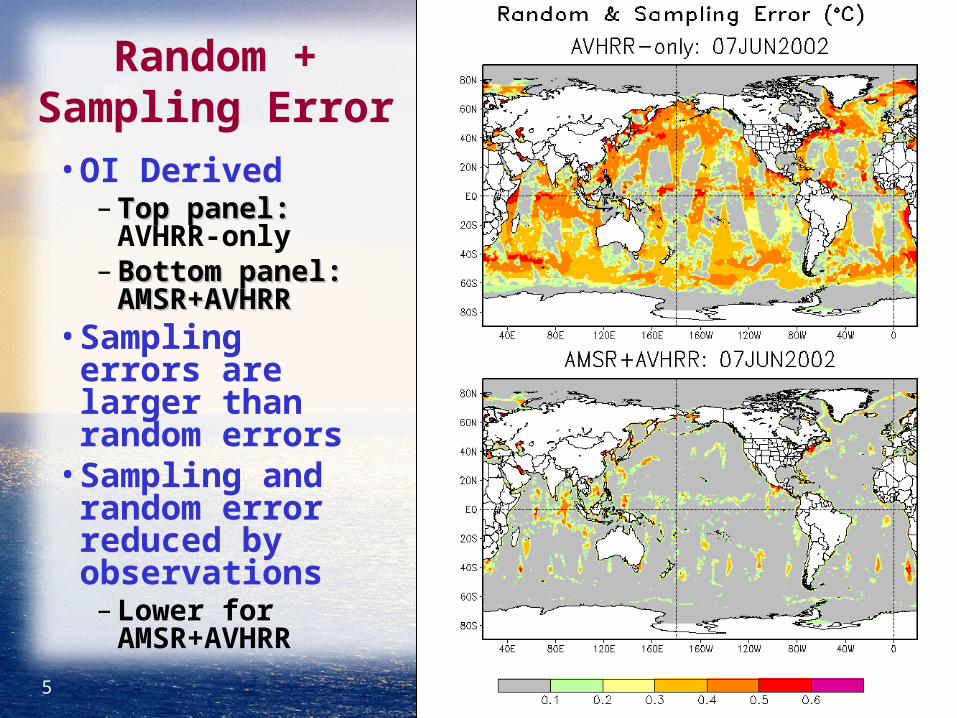
Random + Sampling Error
• OI Derived– Top panel: Top panel:
AVHRR-only– Bottom panel: Bottom panel:
AMSR+AVHRRAMSR+AVHRR• Sampling errors
are larger than random errors
• Sampling and random error reduced by observations– Lower for
AMSR+AVHRR

6
SST Analyses, 1 January 2007• RSS OI
– (~1/11)° grid
• NCEP RTG-HR– (1/12)° grid
• UK OSTIA– (1/20)° grid
• NCDC Daily OI: (AMSR + AVHRR) – (1/4)° grid
• This is a daily average– What spatial
scales are justified?

7
Results
• There is no clear correlation between resolution and spatial grid size
• If the analysis resolution is pushed beyond the spatial and temporal resolution of the data: the apparent SST signal is simply just noise
• Is there a better way to do analyses?

8
Two Stage Analysis
1. Low Resolution (25 km) analysis using microwave and infrared satellite data plus in situ data
2. High Resolution (4.4 km) analysis using infrared satellite data only

9
Why Two Stages?
• Both microwave (MW) and infrared (IR) satellite data are now available
– Microwave has better coverage than infrared
– Infrared has higher resolution than microwave
• “2-Stage Analysis” allows processing to take advantage of both types of data
10
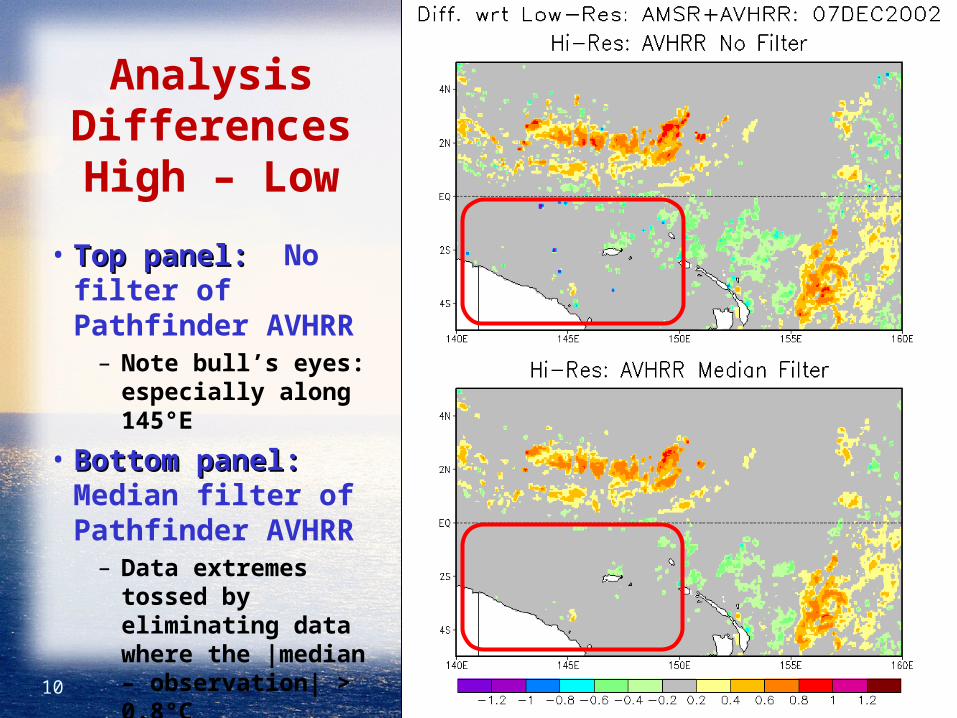
Analysis DifferencesHigh – Low
• Top panel: Top panel: No filter of Pathfinder AVHRR
– Note bull’s eyes: especially along 145°E
• Bottom panel:Bottom panel: Median filter of Pathfinder AVHRR
– Data extremes tossed by eliminating data where the |median – observation| > 0.8°C
– Fewer bull’s eyes

11
RMS monthly differences:High – Low
• Top panel: Top panel: January 2003
• Bottom panel: Bottom panel: July 2003
• Note regions with little difference (no AVHRR hi-res signal)
– Gulf Stream in January
– Off Peru/Columbia coast in July

12 130W 125W 120W 115W 130W 125W 120W 115W 130W 125W 120W 115W 130W 125W 120W 115W
SST Gradient Magnitudes Castelao, et al. (2006), hourly averages: 2001-4

13
11 Sep. ‘03SST Gradient: (°C/100 km)
• Top panel: Top panel: Hi-Res
• Middle panel: Middle panel: Low-Res
• Bottom panelBottom panel: OI Hi-Res Normalized Error
– Norm. Error ~1.0 if no Hi-Res Data
– Norm. Error < 0.8 with Hi-Res Data

14
11 Sep. ‘03SST Gradient: (°C/100 km)
• Top panel: Top panel: Hi-Res
• Middle panel: Middle panel: Low-Res
• Bottom panelBottom panel: Difference (Hi-Res – Low-Res)
– With Hi-Res Normalized Error 0.8 Contour
– Indicator of data edge: e.g., cloud cover, swath edge
– Note correlation between contour and high gradients

15
Input Data
• Pathfinder AVHRR Data with respect to AMSR+AVHRR– Data for 10 Sept. 2003
analysis shown– Data for 11 Sept. 2003
Analysis uses 10-12 Sept. 2003 data
• no data for 12 Sept.
• The only useful field for 10 and 11 Sept. analysis is AVHRR day data for 10 Sept. 2003

16
Day Pathfinder10 Sept. 2003
• TopTop: Median filtered observations
• BottomBottom: Additional gradient filtering using climatology if missing box in 3x3– Large 1°C data to
AMSR+AVHRR difference near data edge
– Gradient filtering reduces but can’t eliminate it
– Gradient filtering does reduce other gradients at date edge

17
Analysis11 Sept. 2003
• TopTop: Median filtered analysis
• BottomBottom: Median + gradient filtering near data edge: 3x3 box with at least 1 missing ob– Some improvement– Gradients are
unrealistic showing where analysis resolution changes
– May need to reduce analysis resolution at data edge
3x3 edge with large gradient
18

19
Why are there Data Edge Biases?
• Retrievals are from NOAA-17, a morning satellite: bias is unlikely to be a diurnal signal; also same positive bias seen at night on another several other days
• Median and gradient filtering not adequate
• Are the biases due to cloud detection problems?
• How should these biases be corrected?• Can the Pathfinder team help?

20
Low-Res Analysis
11 Sept. 2003
• Top: Top: AVHRR-only• Middle: Middle:
AMSR+AVHRR• Bottom: Bottom: Difference:
AVHRR-only warmer than AMSR+AVHRR by more than 1°C
• AMSR dominates AVHRR due to better sampling

21
Filtering for High-Res Data
• Large-scale bias correction (15 day, ~1000 km): to correct satellite data with respect to in situ data
• Median Filtering: To eliminate 1 pixel extremes
• Gradient Filtering: To eliminate errors near data (or cloud) edges
• ADD ?? Small-scale bias correction (3 day, ~100 km): to correct AVHRR data with respect to AMSR data

22
Is it Real or is it Memorex?
Advertisement from the 1990s implying that a live and a Memorex taped performance were the same

23
Is it SST signal or SST noise?

24
Suggestions for Improving SST Analyses - 1
• Intercompare the input data– Look for and reduce isolated extremes
• Consider median filtering
– Be careful at boundaries between regions with and without data
• Computing an analysis is a bit like making sausage– The input impacts the
output

25
Suggestions for Improving SST Analyses - 2
• Compute several versions– Do intercomparsions among these versions
and with other analysis products to uncover problems
• Compute gradients– Look for large gradients at the boundaries
between regions with and without data
• Share results with others

26
Goldilocks & the 3 Bears
Can users find the SST analysis that “is just right” for them??

27
One page summary-1“Truth in Advertising”
• SST Stats: Grid resolution, data used, temporal resolution, and period of analysis, provider, …..• This is easily available• We need to also provide “more
difficult” information

28
One page summary-2“Truth in Advertising”
• SST AnalysisAnalysis Resolution: Explain that the resolution changes in time and space with data changes– Example: For 2 stage analysis
• With AVHRR data: 10 km • Without AVHRR: 100 km • Flag regions with/without AVHRR data
29
One page summary-3“Truth in Advertising”
• SST Bias Correction: Explain why corrections needed – For 2 stage analysis
• Ship SSTs reduced by 0.14°C to better match buoys
• Satellite data adjusted with respect to buoy and corrected ship data: 15 day, ~1000 km
• AVHRR data adjusted with respect to AMSR data: 3 day, ~100 km ??

30
One page summary-4“Truth in Advertising”
• Error Estimates: Verification needed by analysis and by data intercomparions– For 2 stage analysis
• Bias, random & sampling error estimated• Relative values useful• Absolute values may be too small
especially near the coast

31
One page summary-5“Truth in Advertising”
• Additional Data Processing– For 2 stage analysis
• Satellite data median filtered to eliminate grid scale bull’s eyes
• Satellite data near data edges eliminated when gradients large
• Other information– For 2 stage analysis
• Two stages allow useful separation of IR and MW resolution and sampling

32
One page summary-6“Truth in Advertising”
• Three most important things about documentation and usersusers– Users don’t know that there is any– If they know that, they don’t read it– If they read it, they don’t understand it
• That is why a one page summary would be useful