1 Hazy vista in the Appalachians. 2 Major Air Pollutants in the Mid- Atlantic United States Bebhinn...
29
1 azy vista in the Appalachians
-
Upload
yuliana-estis -
Category
Documents
-
view
213 -
download
0
Transcript of 1 Hazy vista in the Appalachians. 2 Major Air Pollutants in the Mid- Atlantic United States Bebhinn...

1Hazy vista in the Appalachians
2
Major Air Pollutants in the Mid-Atlantic United States
Bebhinn DoMeteorologist, NC DAQ
Some slide material provided through K.G. Paterson, Ph.D., P.E. ©2007 via contract with MARAMA

3
Did You Know?Air quality is getting better in many
Eastern U.S. cities?• Philadelphia:
68% improvement • New York:
64% improvement• Baltimore:
52% improvement
Source: U.S. EPA (2006), comparing 3-year average AQI (early 1980s to early 2000s)

4
Discussion
If air quality is getting better, then why is it still a concern?
5
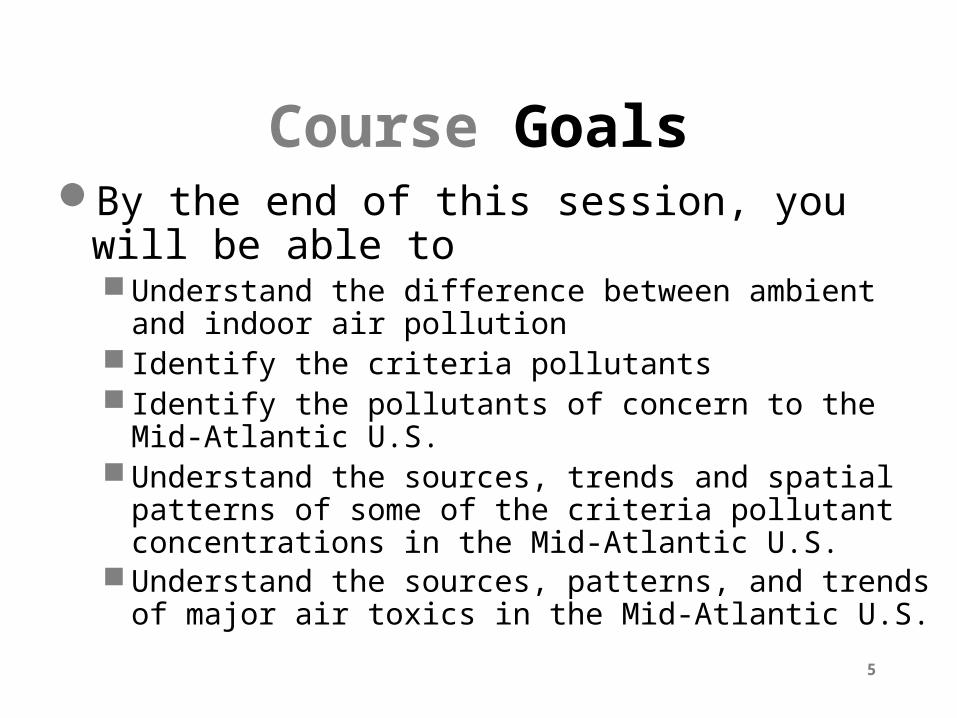
Course GoalsBy the end of this session, you will be able to
Understand the difference between ambient and indoor air pollution
Identify the criteria pollutants Identify the pollutants of concern to the Mid-Atlantic U.S. Understand the sources, trends and spatial patterns of some of
the criteria pollutant concentrations in the Mid-Atlantic U.S. Understand the sources, patterns, and trends of major air
toxics in the Mid-Atlantic U.S.

6
Air PollutionAir pollution is a gas, vapor, or solid that, in the
atmosphere, has adverse effects on health, welfare, or the environment
Air pollution occurs in the ambient (outdoor) and indoor environments. Some differences: Sources that influence these environments Transport of pollutants Connection between source and point of impact
(receptor)
7
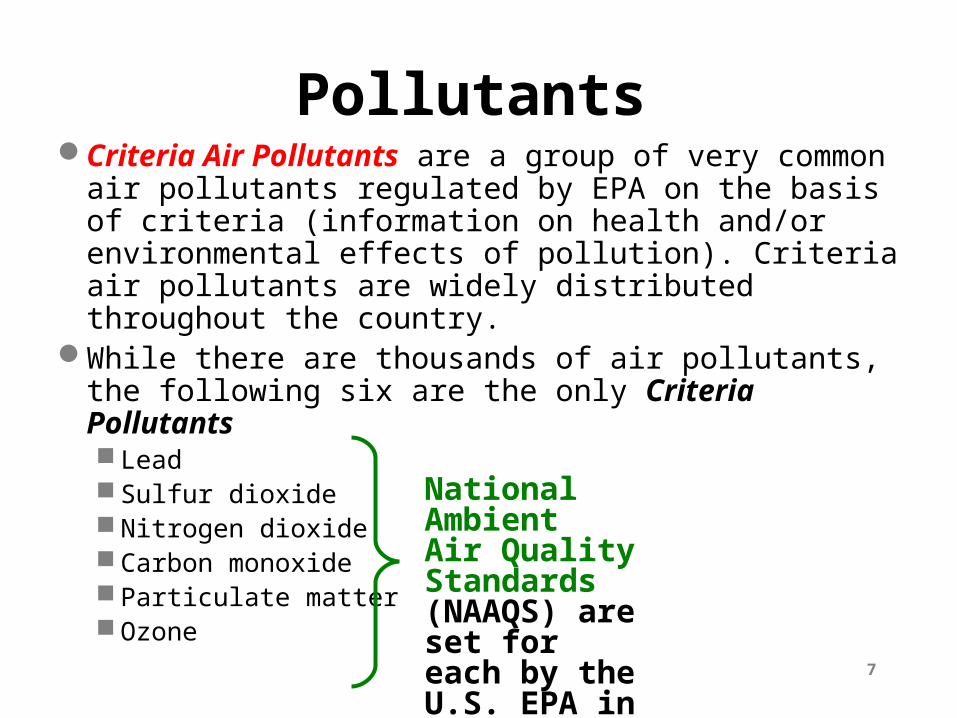
Criteria Air Pollutants are a group of very common air pollutants regulated by EPA on the basis of criteria (information on health and/or environmental effects of pollution). Criteria air pollutants are widely distributed throughout the country.
While there are thousands of air pollutants, the following six are the only Criteria Pollutants Lead Sulfur dioxide Nitrogen dioxide Carbon monoxide Particulate matter Ozone
Pollutants
National AmbientAir Quality Standards(NAAQS) are set for each by the U.S. EPA in the Clean Air Act

8
Pollutants
Of the Criteria Air Pollutants, two are particularly challenging for the Mid-Atlantic U.S.OzoneParticulate
9
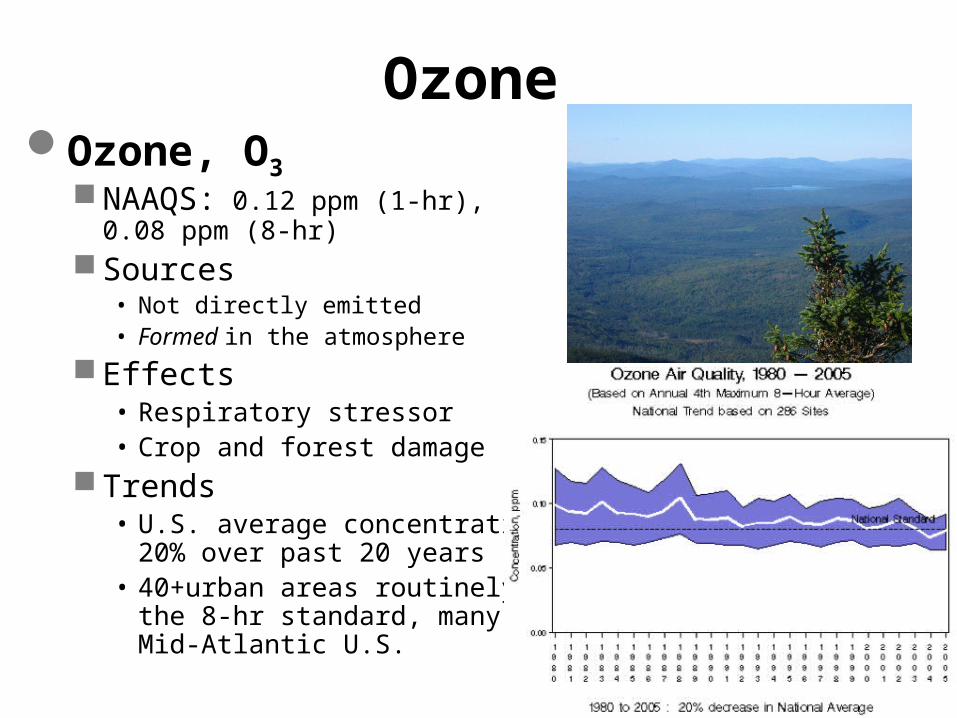
OzoneOzone, O3
NAAQS: 0.12 ppm (1-hr),0.08 ppm (8-hr)
Sources• Not directly emitted • Formed in the atmosphere
Effects • Respiratory stressor • Crop and forest damage
Trends• U.S. average concentration down
20% over past 20 years• 40+urban areas routinely exceed
the 8-hr standard, many in the Mid-Atlantic U.S.

10
Ozone is created in the atmosphere via a complex combination of sunlight-driven chemical (photochemical) reactions. These many reactions can be summarized as follows,
Ozone
NOx VOC sunlight O3 other
Reactivevolatile organic compounds
Three important ingredients Ozone

11
Ozone

12
Particulate MatterUnderstanding particulate matter (PM)
is complicated by several factors Many different particle sizes Different sources Different composition
An old standard was based on Total Suspended Particulate (TSP), those between 0.1 and 30 µm
Two air quality standards by particle size PM10 (Coarse): < 10 µm PM2.5 (Fine): < 2.5 µm
human hair(100 µm)
10 µm PM
2.5 µm PM

13
Coarse particles, PM10
NAAQS: 150 µg/m3 (24-hr),50 µg/m3 (annual)
Major sources• Windblown dust• Earthmoving
Effects • Cardiovascular distress• Respiratory distress• Visibility impairment
Trends• U.S. average PM10 down 30%
(over past 20 years)• While exceedances exist
elsewhere, the Mid-Atlantic U.S. has few problems
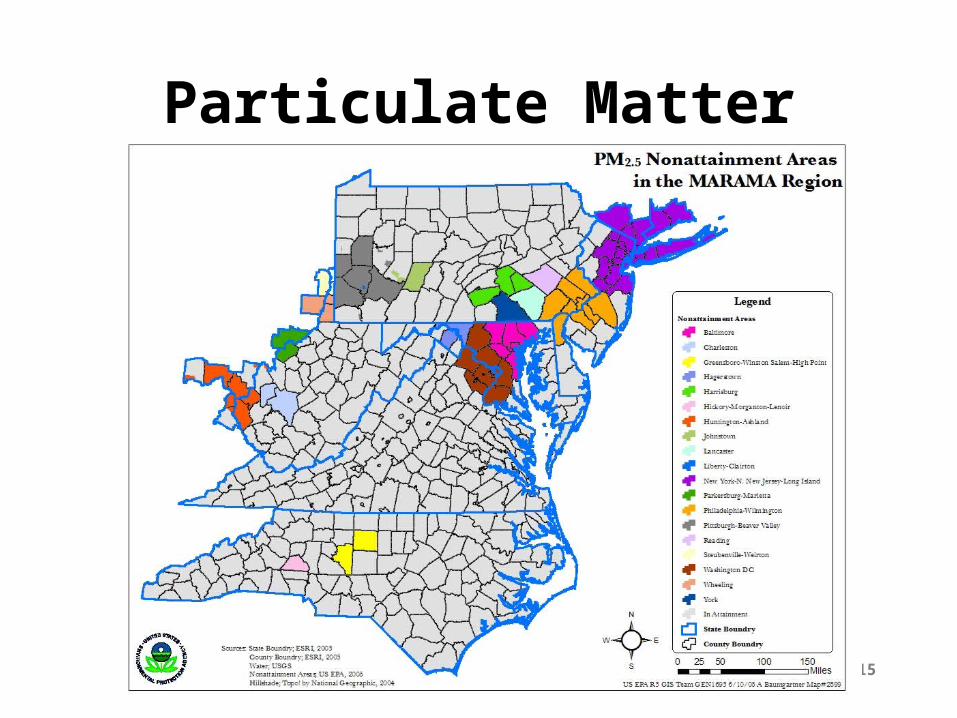
Particulate MatterFine particles, PM2.5
NAAQS: 35 µg/m3 (24-hr),15 µg/m3 (annual)
Major sources• Diesel engines• Power plants
Effects • Cardiovascular distress• Respiratory distress• Visibility impairment
Trends• U.S. average PM2.5 is down 10%
(over past 5 years)• Numerous areas exceed standard
in the East, particularly the DC to Boston urban corridor

14
Particulate MatterFormation of PM
Physical attrition (10-1000 µm) Combustion by-products (1-1000 µm) Nucleation (0.1-1 µm)
• Homogeneous nucleation: pre-cursor air pollutants forming PM in the atmosphere (secondary PM)
– Sulfur dioxide
– Nitrogen dioxide
– Ammonia
• Heterogeneous nucleation: binding to existing particles– Organics
– Metals
15
Particulate Matter

16
Ozone & Particulate MatterWhy are particulate matter and especially Ozone so
problematic? What are some of the challenges to reducing both of these pollutants?
Consider that in the Mid-Atlantic U.S., sulfates make up as much as 55% of PM2.5; much of this comes from power plants. Power plants have reduced their sulfur emissions more than 33% in this region over the past decade, yet PM2.5 concentrations remain nearly the same. How can this be?
source: http://www.epa.gov/airtrends/pm.html

17
Pollutants
While PM and ozone attainment challenges exist, four of the Criteria Air Pollutants are rarely problematicNitrogen dioxideSulfur dioxideCarbon monoxideLead

18
Nitrogen DioxideNitrogen dioxide, NO2
NAAQS: 0.053 ppm [annual] Some major sources
• Automobiles (gasoline)• Power plants (coal, natural gas)
Effects • Respiratory problems• Contribution to ozone formation• Damages waterways through deposition• Impairs visibility
Trends• U.S. average concentration down 20%• All urban areas now in compliance• Smog and haze persist as problems
19
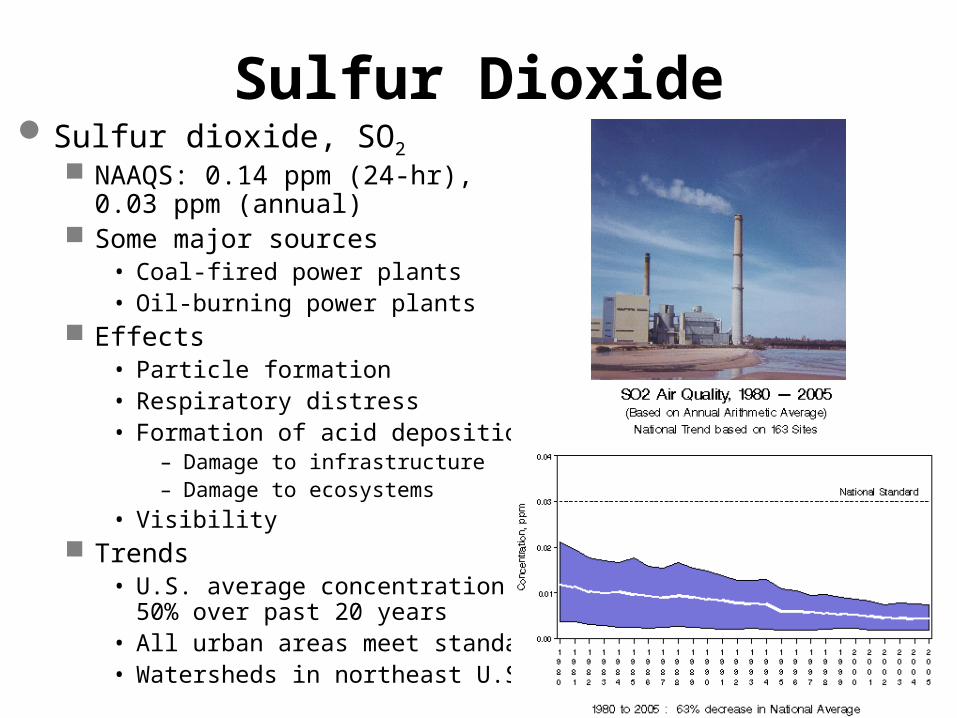
Sulfur DioxideSulfur dioxide, SO2
NAAQS: 0.14 ppm (24-hr),0.03 ppm (annual)
Some major sources• Coal-fired power plants• Oil-burning power plants
Effects • Particle formation• Respiratory distress • Formation of acid deposition
– Damage to infrastructure– Damage to ecosystems
• Visibility Trends
• U.S. average concentration down 50% over past 20 years
• All urban areas meet standard• Watersheds in northeast U.S. acidified

20
Carbon Monoxide Carbon monoxide, CO
NAAQS: 35 ppm (1-hr),9 ppm (8-hr)
Some major sources• Vehicles• Power plants • Wild fires• Wood burning stoves
Effects • Cardiovascular distress• Reduced mental acuity,
headaches• Enhance smog formation
Trends• U.S. average concentration
down 65%• Oxygenated fuels, catalytic converters,
and wood burning stoves have helpedlower emissions
• Nationally, a few areas are not in compliance (2001-2002)

21
LeadLead, Pb
NAAQS: 1.5 µg/m3 [quarterly] Some major sources
• Fuels• Smelters, battery manufacturers
Effects • Neurotoxin• Impairs brain development in infants• Permanent damage
Trends• U.S. average down more than 93% over the past 20 years due to changes in
gasoline formulations• Some localized hot spots still remain
Notes• Inhalation is main exposure route for adults (lead in particulate matter)• Ingestion is main exposure route for children (lead paint, soil)
Source: US EPA (2006)

22
Hazardous Air Pollutants (HAPs)Hazardous air pollutants (HAPs) are not
covered by ambient air quality standards but which, as defined in the Clean Air Act, may present a threat of adverse human health effects or adverse environmental effects. They tend to be found in “hotspots”, usually near their sources.
List of HAPs (EPA = 187, TRI=360)No NAAQS

23
Hazardous Air Pollutants (HAPs) Sources
• Many possible sources, dependent on specific pollutant
• Main categories: pesticides, metals, organics • Effects
– Toxicity varies by pollutant – Health impacts (cancer and non-cancer effects)– Bioaccumulative
Trends• Many emissions are decreasing due to emission monitoring,
auditing, and public reporting of emissions (TRI)
Hazardous Air Pollutants

24
Hazardous Air PollutantsTRI emission data reveals spatial patterns for one HAP,
mercury, in 2004 due to location of major mercury sources. Total Mercury Emissions (pounds/year)
source: http://www.epa.gov/triexplorer/
25
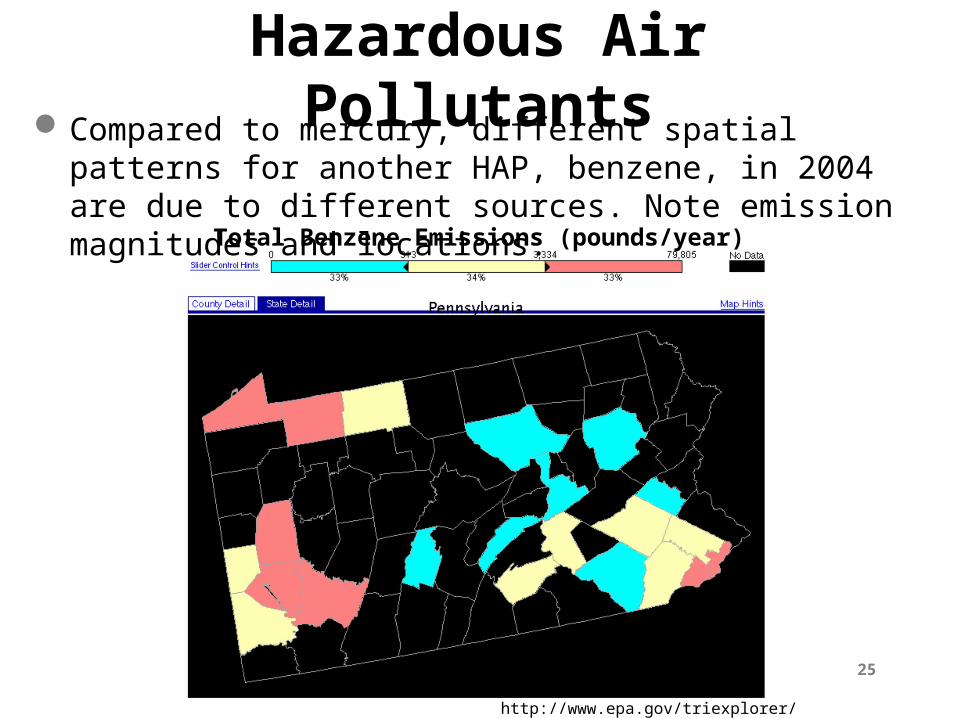
Hazardous Air PollutantsCompared to mercury, different spatial patterns for another HAP,
benzene, in 2004 are due to different sources. Note emission magnitudes and locations.
Total Benzene Emissions (pounds/year)
http://www.epa.gov/triexplorer/

26
Indoor air pollution is different than ambient (outdoor) pollution Sources are often very different for indoor pollutants
• Carbon monoxide• Formaldehyde• Particulate matter• Nitrogen oxides• Ozone• Radon• Volatile organics
Pollutants linger longer due to limited air exchange Indoor air quality is rarely monitored Limited enforcement of air quality in most indoor settings
fireplace, stove, furnace, cigarettes
carpets, paneling, press board, cigarettes
tobacco smoke, cooking, pets, dustinggas stove, kerosene heater
photocopier, printer, air cleaners
diffuses from soilpaint, solvents
Indoor Air

27
Any Questions?
Thanks for making this a great class!

28
Post Test
1. What pollutant presents the biggest challenges in the Mid-Atlantic U.S.? a) Sulfur dioxideb) Carbon monoxidec) Ozoned) Lead
2. Which is not a source of PM2.5?a) Windblown dustb) Diesel enginesc) Coal-fired power plantsd) Unpaved roads
3. Which pollutant most recently received a lower NAAQS?a) Ozoneb) Carbon monoxidec) Fine particles
d) Nitrogen dioxide

29
Further Learning
The Particle Pollution Report: Current Understanding of Air Quality and Emissions through 2003, EPA 454-R-04-002, http://www.epa.gov/airtrends/pm.html
The Ozone Report - Measuring Progress through 2003, EPA 454/K-04-001, http://www.epa.gov/air/airtrends/aqtrnd04/ozone.html
A Guide to Mid-Atlantic Regional Air Quality, Part I: The Nature of Air Pollutants, pp. 1-15. http://www.marama.org/reports/Guide-MidAtlantic_RegAQ_Final.pdf
A Guide to Mid-Atlantic Regional Air Quality, Appendix C: Air Quality Standard and Goals, pp. C1-C4. http://www.marama.org/reports/Guide-MidAtlantic_RegAQ_Final.pdf