1 Geog 090 – Quantitative Methods in Geography Geography is a diverse discipline, that seeks to...
39
1 Geog 090 – Quantitative Methods in Geography • Geography is a diverse discipline, that seeks to understand our world in terms of space and place • Geographers use quantitative approaches to describe, understand, and assess geographic phenomena • This course will provide you with an introduction to quantitative approaches in geography
-
Upload
godwin-bridges -
Category
Documents
-
view
220 -
download
3
Transcript of 1 Geog 090 – Quantitative Methods in Geography Geography is a diverse discipline, that seeks to...

1
Geog 090 – Quantitative Methods in Geography
• Geography is a diverse discipline, that seeks to
understand our world in terms of space and place
• Geographers use quantitative approaches to
describe, understand, and assess geographic
phenomena
• This course will provide you with an introduction
to quantitative approaches in geography

2
Geog 090 – Quantitative Methods in Geography
• Quantitative methods refers primarily, but not
exclusively, to statistics
• Descriptive and inferential (univariate and multi-
variate to a lesser extent) statistical methods, BUT
• Background and theory that you need to make
use of statistics properly in the context of
geography

3
Goals
• The goals of this course are: – To help students understand the purpose,
meaning, and use of statistics in geographic research.
– To introduce basic statistical methods used by geographers in research.
– To learn how to use computer spreadsheets to simplify geographic problem solving.
– To learn how to apply statistical techniques to real geographical problems.

4
• Statistical Methods for
Geography by Peter Rogerson
•Available at Student Stores
•This text is very readable and
rather concise (unlike many stats
texts that are rather verbose)
Required Textbook

5
Lectures - Where, When, and Who
• Website:
• http://www.unc.edu/courses/2006spring/geog/090/001/www

6
Grading Policy
• Assignments: 30% (6 * 50 points)
• Exam I: 20% (200 points) (Feb 21, 2006)
• Exam II: 20% (200 points) (Mar 30, 2006)
• Final Exam: 30% (300 points) (May 02,
2006)
Note: Any student failing to take an exam will score zero for that test unless a legitimate, documented reason is presented.
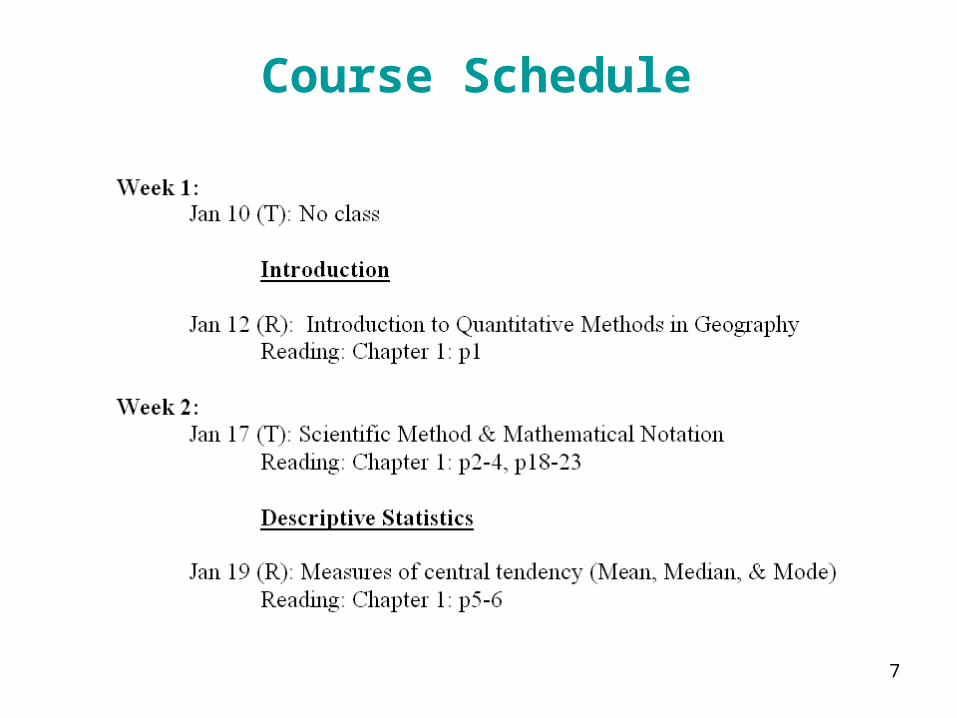
7
Course Schedule

8

9

10

11

12

13

14Source: http://www.wunderground.com/
Chapel Hill, NC (January 08, 2006)

15
Descriptive Statistics
• Measures of central tendency
– Measures of the location of the middle or the center of a distribution
– Mean, median, mode
• Measures of dispersion
– Describe how the observations are distributed
– Variance, standard deviation, range, etc

16Source: http://www.wunderground.com/
Chapel Hill, NC (January 08, 2006)

17
Chapel Hill Bend
Mean 1198.10 298.07
Stdev 191.80 82.08

18
Chapel Hill Elizabeth City
Mean 1198.10 1198.47
Stdev 191.80 220.77

19
Geographic Data & Problems: Scale
• Vector data– Point
– Line
– Area
– Scale (e.g., 1:24, 000)
• Raster data– Gridded data
– Spatial resolution (e.g., 30m)

20
GTOPO30 is a Global Digital Elevation Model (DEM) (GTOPO30, 1km)
Source: http://edc.usgs.gov/products/elevation/gtopo30/gtopo30.html

21
Landsat ETM+ image at Chapel Hill, NC (2002-05-24)(7-4-1)

22
(Source: Lillesand et al. 2004)

23Source: Bateson, Asner, & Wessman 2000, IEEE, 38, p1083-1094

24
Sources of Outliers:
(1) Data errors – First check for data recording or entry errors.
(2) Rare event – Extreme observations that for some legitimate reason do not fit within the typical range of other data values.
• a 80 degree day in January in Chapel Hill, NC
• a 500 point rise/drop in a stock market index

25
The Normal Distribution
• The most common probability distribution is the normal distribution
• The normal distribution is a continuous distribution that is symmetric and bell-shaped
Source: http://mathworld.wolfram.com/NormalDistribution.html

26
Normal Distributions
-3σ -2σ -1σ μ +1σ +2σ +3σ
f(x)
68%
95%
99.7%

27
Hypothesis Testing
• An important component of scientific method is the testing of hypotheses either through experiments or predictive forms of analysis
• A hypothesis can be defined as a tentative assumption that is made for the purpose of empirical scientific testing
• A hypothesis becomes a theory of science when repeated testing produces the same conclusion.

28
Hypothesis Testing
• Example I – Urban Heat Island Effect
– Does this effect exist?
– Is there a significant difference in temperature between urban and adjacent areas?
– Is there a significant difference in precipitation between urban and adjacent areas?

29
Hypothesis Testing
Source: http://www.ggy.uga.edu/courses/geog4300/
• Example II – Crimes Rates

30
• Hypothesis testing allows us to compare two samples in terms of some descriptive measure of those samples
• In some instances, we wish to compare more than two samples, in order to see if there are significant differences between them: Suppose we have soil moisture samples from 4 or 5 different catchments on the same day, and we want to determine whether or not any of them are significantly wetter or more drier than the others
Analysis of Variance (ANOVA)

31
Briggs & Knapps, 1995, American Journal of Botany, 82, 1024-1030
NPP = GPP - Rp

32
“Increased spring Tmin was correlated with decreased NPP by the dominant C4 grass and with increased abundance and productivity by exotic and native C3 forbs.”
Alward et al., 1999, Science, 283, p229-231

33
Northern high latitudes (40°N-70°N)
Northern middle latitudes
(23.5°N-40°N)
Geographical RegionNDVI versus
temperatureNDVI versus
precipitation
R2 p value R2 p value
Northern high latitudes 0.35 0.012 0.09 0.24
Northern middle latitudes 0.44 0.004 0.01 0.66

34
(Source: Fang et al., 2001, Science, p1723a)

35
Source: Peper et al.: Predicting Diameter, Height, Crown Width, and Leaf Area
Source: http://ohioline.osu.edu/for-fact/0035.html

36
Aboveground biomass of each tree (tons)
2/)( baMCW Mean Crown Width (MCW)
a
b
Crown Size
a: Max crown width
b: Min crown width
Pacific Northwest (PNW) Forest Inventory Analysis (FIA) database
(PNW-FIA database)

37
Annual Precipitation of Two Weather Stations in Raleigh, NCA: 1950-2004; B: 1931-2004

38
Relationship in annual precipitation between A and B (1950 – 2004)
(R2 = 0.82)

39