Genetically Modified France Genetically Modified France Marguerite Marguerite.

1
Genetically engineered transvestites reveal novel mating genes in budding yeast
Lori B. Huberman*,† and Andrew W. Murray
*,†
*Molecular and Cellular Biology and †FAS Center for Systems Biology
Harvard University, Cambridge, MA, 02138
Genetics: Early Online, published on October 11, 2013 as 10.1534/genetics.113.155846
Copyright 2013.

2
Running title: Transvestite yeast reveal mating genes
Key words: Afb1, Mating, Pheromone signaling, Robustness, Genetic Engineering
Corresponding author: Andrew W. Murray
Northwest Science Building Room 469
52 Oxford Street
Cambridge, MA 02138
Telephone: (617) 496-1350
Fax: (617) 496-1541
Email: [email protected]

3
ABSTRACT
Haploid budding yeast has two mating types, defined by the alleles of the MAT locus,
MATa and MATα. Two haploid cells of opposite mating types mate by signaling to each other
using reciprocal pheromones and receptors, polarizing and growing towards each other, and
eventually fusing to form a single diploid cell. The pheromones and receptors are necessary and
sufficient to define a mating type, but other mating type-specific proteins make mating more
efficient. We examined the role of these proteins by genetically engineering “transvestite” cells
that swap the pheromone, pheromone receptor, and pheromone processing factors of one mating
type for another. These cells mate with each other, but their mating is inefficient. By
characterizing their mating defects and examining their transcriptomes, we found Afb1 (a-factor
barrier), a novel MATα-specific protein that interferes with a-factor, the pheromone secreted by
MATa cells. Strong pheromone secretion is essential for efficient mating, and the weak mating
of transvestites can be improved by boosting their pheromone production. Synthetic biology can
characterize the factors that control efficiency in biological processes. In yeast, selection for
increased mating efficiency is likely to have continually boosted pheromone levels and the
ability to discriminate between partners who make more and less pheromone. This
discrimination comes at a cost: weak mating in situations where all potential partners make less
pheromone.

4
INTRODUCTION
Biological processes are typically defined by the genes that are necessary and sufficient
for function. However, in many cases, this minimal gene set does not encompass all the proteins
involved in a process, and additional proteins promote biological efficiency. Finding these
additional proteins may require the detection of subtle phenotypes, making it hard to know if all
the genes involved in a process have been identified. One way to answer this question is to
reengineer a pathway and ask whether the synthetic version fully mimics the natural function.
Here, we show that this form of synthetic biology illuminates how cells of the budding yeast,
Saccharomyces cerevisiae, mate efficiently.
Budding yeast can be stably maintained as haploids or diploids. Haploids mate when two
cells of opposite mating types signal to each other using reciprocal pheromones and receptors,
polarize and grow towards each other, and eventually fuse to form a single diploid. Yeast has
two mating types, a and α (Figure 1A), determined by two alternative alleles at the MAT locus,
MATa and MATα, which encode different transcription factors (Herskowitz 1988). These factors
regulate the expression of mating type-specific genes, many of which are involved with the
production and detection of the pheromones yeast cells use to signal to one another. The
pheromones (a- and α-factor) are detected by G-protein coupled receptors; MATa cells express a-
factor (Betz and Duntze 1979), which is secreted through an ATP binding cassette (ABC)
transporter (Ste6) (McGrath and Varshavsky 1989) and the α-factor receptor (Ste2) (Blumer et
al. 1988; Dohlman and Thorner 2001). MATα cells express α-factor (Kurjan and Herskowitz
1982; Singh et al. 1983) and the a-factor receptor (Ste3) (Hagen et al. 1986; Dohlman and
Thorner 2001). Pheromone binding activates a signaling pathway which produces three

5
responses: cell polarization, cell cycle arrest in G1, and increased transcription of mating-type
specific genes (Bardwell 2005).
Bender and Sprague (1989) used mutations that alter pheromone and receptor expression
to show that a cell's mating type is determined by which pheromones and receptors it expresses.
Although pheromone secretion and detection are the essential elements for mating, additional,
mating type-specific genes make mating more efficient. One of these is the MATa-specific α-
factor protease, Bar1 (Sprague Jr and Herskowitz 1981; MacKay et al. 1988), which helps MATa
cells detect an α-factor gradient and polarize towards MATα partners (Jackson and Hartwell
1990; Barkai et al. 1998). Yeast cells also express mating-type specific agglutinins, which help
cells attach to mating partners (Cappellaro et al. 1991) in liquid but individually have little effect
on mating efficiency on solid media (Lipke et al. 1989; Roy et al. 1991; de Nobel et al. 1995).
Evidence for the final, characterized MATa-specific gene was produced by Bender and Sprague
(1989) who noticed that cells expressing MATa-specific proteins and Ste3 were unable to mount
a pheromone response. The gene responsible for this was later identified as ASG7, which
terminates pheromone signaling after mating has occurred and allows diploid cells to escape
from the G1 arrest of their parental haploid cell (Kim et al. 2000; Roth et al. 2000).
Bender and Sprague (1989) used mutations at MAT and exogenous promoters to
manipulate pheromone and receptor expression. As a result, any quantitative defects in mating
could reflect incorrect levels of pheromone and receptor expression or the accessory role of other
genes in mating. To distinguish these possibilities we constructed “transvestite” strains:
genetically engineered strains that have a wild-type allele at MAT but express the pheromone,
pheromone receptor, and proteins responsible for secreting or processing pheromones that are
normally induced by the other MAT allele (Figure 1B). These strains should mate well if we

6
have swapped all the genes required for efficient mating and expressed them at the right level.
Mating defects in these engineered cells indicate the presence of additional, uncharacterized,
mating type-specific proteins or incorrect expression of the known mating genes.
By studying these genetically engineered cells, we learned more about the requirements
for efficient mating. MATa-playing-α cells (MATa cells that express α-factor and Ste3) mate
three-fold worse than genuine MATα cells. Their main defect is low α-factor secretion:
increasing α-factor production makes them mate almost as well as genuine MATα cells. In
contrast, MATα-playing-a cells (MATα cells that express a-factor, Ste6, Ste2, and Bar1) mate 60-
fold worse than genuine MATa cells. These transvestites have two defects: they express a novel,
MATα-specific a-factor blocker, which we named Afb1 (a-factor barrier), and they show a
transient as opposed to a prolonged arrest when exposed to α-factor. Our manipulations reveal
that mating is not robust to reduced levels of pheromone production.
MATERIALS AND METHODS
Yeast strains and culturing: Table S1 lists the strains we used. All strains were derived
from the W303 wild-type background (ade2-1 can1-100 his3-11,15 leu2-112 trp1-1 ura3-1)
using standard genetic techniques. All media were prepared as described (Sherman et al. 1974)
and contained 2% wt/vol of glucose. Cells were grown in Synthetic Complete media (2%
glucose) (SC) or Yeast Extract Peptone Dextrose (2% glucose) (YPD) at 30oC in culture tubes on
roller drums or on agar plates or at room temperature (25oC) for timelapse microscopy. Mating
assays used agar plates containing SC without adenine (SC-ade), SC without uracil (SC-ura), or
SC without adenine and uracil (SC-ade-ura). Bovine serum albumin (BSA) was used to reduce

7
the non-specific absorption of α-factor to glass and plastic surfaces. A 10% wt/vol stock was
prepared in deionized water and then diluted into media to 0.1% wt/vol. Synthetic α-factor
(Biosynthesis, Lewisville, TX) was suspended in dimethyl sulfoxide (DMSO) and then diluted
into either YPD + 0.1% BSA or SC + 0.1% BSA at the appropriate concentration. Yeast extract
was obtained from EMD Millipore (Billerica, MA). Peptone and yeast nitrogen base were
obtained from BD (Franklin Lakes, NJ). Bacto-agar was obtained from US Biological
(Swampscott, MA). Unless otherwise noted, all chemicals were obtained from Sigma-Aldrich
(St. Louis, MO).
Quantitative Mating Assay: Quantitative mating assays were modified from Reid and
Hartwell (1977). Briefly, cells were grown to log phase (~5x10⁶ cells/mL). 5x10
6 cells were
harvested from each strain, mixed at a 1:1 ratio, sonicated, and filtered onto a 0.22µm
nitrocellulose filter (Millipore, MA). Filters were placed on a YPD plate and incubated at 30oC
for 5 hours. To assay for the initial ratio of the haploid cells, a 2.5x10⁻⁵
dilution of the initial
mating mixture was plated onto SC-ade and SC-ura plates. After 5 hours, cells were washed off
the filters into 1 mL of deionized water and then plated onto SC-ade, SC-ura, and SC-ade-ura
plates at appropriate dilutions to produce ~400 colonies per plate. SC dropout plates were
incubated for 2 days before counting the colonies on each plate. Mating efficiencies were
determined by dividing the number of colonies on the SC-ade-ura plate by the number of
colonies on whichever of the SC-ade or SC-ura plates plated after the mating incubation had
fewer colonies. Three technical replicates were done of each mating assay and averaged for a
single biological replicate. Error bars are the standard deviation of at least 5 biological
replicates. Statistical significance was determined using Student’s t-test.
8
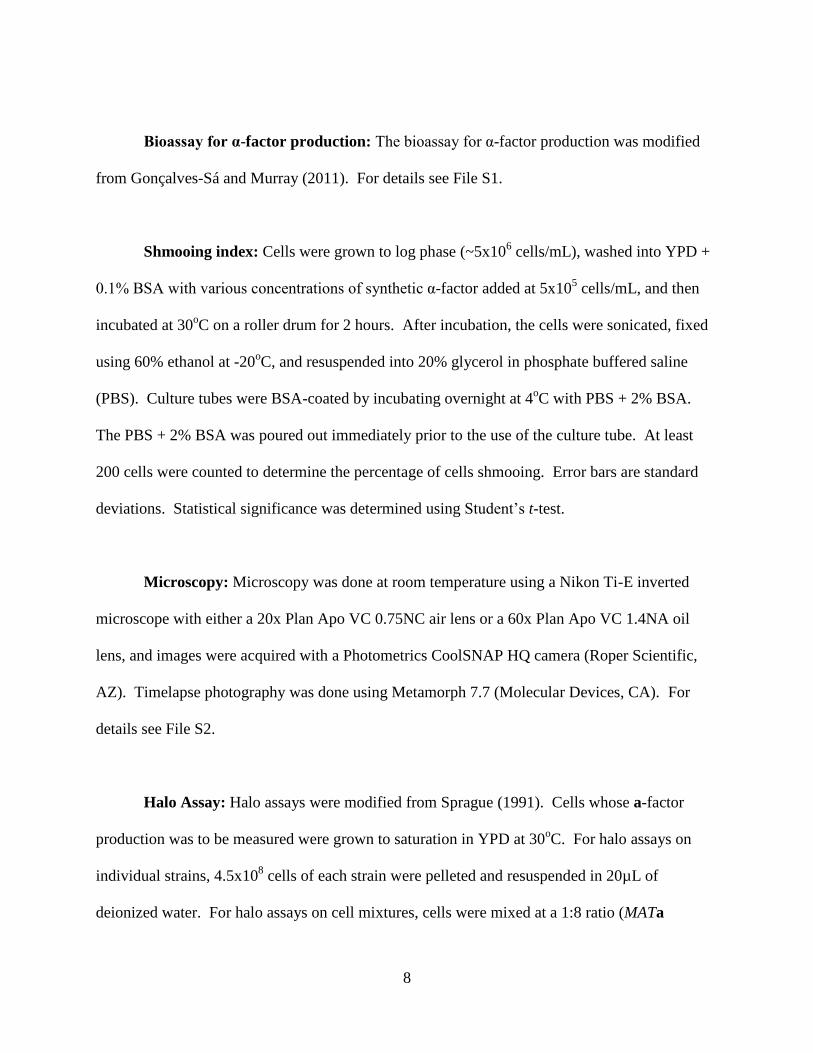
Bioassay for α-factor production: The bioassay for α-factor production was modified
from Gonçalves-Sá and Murray (2011). For details see File S1.
Shmooing index: Cells were grown to log phase (~5x10⁶ cells/mL), washed into YPD +
0.1% BSA with various concentrations of synthetic α-factor added at 5x10⁵ cells/mL, and then
incubated at 30oC on a roller drum for 2 hours. After incubation, the cells were sonicated, fixed
using 60% ethanol at -20oC, and resuspended into 20% glycerol in phosphate buffered saline
(PBS). Culture tubes were BSA-coated by incubating overnight at 4oC with PBS + 2% BSA.
The PBS + 2% BSA was poured out immediately prior to the use of the culture tube. At least
200 cells were counted to determine the percentage of cells shmooing. Error bars are standard
deviations. Statistical significance was determined using Student’s t-test.
Microscopy: Microscopy was done at room temperature using a Nikon Ti-E inverted
microscope with either a 20x Plan Apo VC 0.75NC air lens or a 60x Plan Apo VC 1.4NA oil
lens, and images were acquired with a Photometrics CoolSNAP HQ camera (Roper Scientific,
AZ). Timelapse photography was done using Metamorph 7.7 (Molecular Devices, CA). For
details see File S2.
Halo Assay: Halo assays were modified from Sprague (1991). Cells whose a-factor
production was to be measured were grown to saturation in YPD at 30oC. For halo assays on
individual strains, 4.5x10⁸ cells of each strain were pelleted and resuspended in 20µL of
deionized water. For halo assays on cell mixtures, cells were mixed at a 1:8 ratio (MATa

9
wildtype:cell type of interest) with a final cell count of 4.5x10⁸. Cells were pelleted and
resuspended in 20µL of deionized water. 10µL of each strain or strain mix was spotted onto
YPD plates and incubated overnight (~24 hours) at 30oC. Supersensitive MATα sst2Δ cells
grown to stationary phase were then sprayed over the cell spots using a martini atomizer (Item
900432, Oenophilia, Hillsborough, NC ). Plates were incubated overnight (~18 hours) at 30oC,
and pictures were taken using a Panasonic (Secaucus, NJ) Lumix DMC-TZ5 camera.
RNA isolation and sequencing: Cells were grown to log phase (5x10⁶ cells/mL) in YPD
+ 0.1% BSA at 30oC. 10 mL of the culture was harvested by spinning at 4
oC, washed in 1 mL
RNase-free ice-cold water, pelleted, and flash frozen in dry ice. 10nM α-factor was added to the
remaining culture, incubated for 2 hours at 30oC, and harvested in the same manner. RNA was
isolated as described by Collart and Oliveiro (2001) and dissolved in 1mM sodium citrate, pH
6.4. RNase-free chemicals were obtained from Invitrogen (Carlsbad, CA) except for chloroform,
which was obtained from VWR (Radnor, PA).
RNA libraries were prepared using the Illumina TruSeq kit (www.illumina.com) and
sequenced using an Illumina HiSeq 2000 with 50 base pair, single end reads with 89x mean
coverage across the genome.
Sequence analysis: To analyze the sequencing data, the RNA sequences were aligned to
the S288C reference genome r64 (downloaded from the Saccharomyces Genome Database
www.yeastgenome.org) using TopHat (Trapnell et al. 2009). We then used Cufflinks (Trapnell
et al. 2010) to look for genes with significantly different levels of gene expression between
MATa bar1Δ cells and MATα-playing-a PBAR1-BAR1 cells. Significant differences in expression

10
were identified using the default setting in Cufflinks, which tests the observed log-fold-change in
gene expression against the null hypothesis of no difference between the two samples with a
false discovery rate of 0.05 (Trapnell et al. 2010). The data discussed in this publication have
been deposited in NCBI’s Gene Expression Omnibus (Edgar et al. 2002) and are accessible
through GEO Series accession number GSE49372
(http://www.ncbi.nlm.nih.gov/geo/query/acc.cgi?acc=GSE49372).
RESULTS
Transvestite cells can mate: To find genes required for efficient mating, we constructed
two types of transvestite strains. MATa-playing-α cells are MATa cells that have been
engineered to produce α-factor and the a-factor receptor by replacing the open reading frame of
STE2 with STE3 and the open reading frames of the two a-factor genes with those of the two α-
factor genes (replacing MFA1 with MFα1 and MFA2 with MFα2) (Figure 1B). We also deleted
BAR1, which encodes the α-factor protease (Sprague Jr and Herskowitz 1981), and ASG7, which
inhibits signaling from Ste3 (Roth et al. 2000). However, these cells are still MATa at the MAT
locus and, thus, will have MATa-specific expression patterns for all genes except those we
manipulated. MATα-playing-a cells are MATα at the MAT locus but have been engineered to
produce a-factor and the α-factor receptor by replacing the open reading frame of STE3 with
STE2, MFα1 with MFA1, and MFα2 with MFA2 (Figure 1B). We also drove the expression of
BAR1 with an engineered version of the haploid specific promoter, PFUS1 (Ingolia and Murray
2007), which is expressed in both MATa and MATα cells (Trueheart et al. 1987), and the
expression of the a-factor transporter, STE6 with the MFα1 promoter. Since we tested mating

11
efficiency on solid media, we did not manipulate the expression of the mating agglutinins, which
function mainly when cells mate in liquid (Lipke et al. 1989; Roy et al. 1991).
We asked if the manipulated genes are the only mating-type specific proteins required for
efficient mating. Crossing these cells with wild-type cells of their original mating type (e.g.
MATα-playing-a crossed to MATα) has a potential caveat. When two wild-type cells mate, the
combination of the transcription factors expressed from MATa and MATα turns off the
pheromone and receptor genes of both mating types (Haber 1998), and the zygotes escape
pheromone-induced G1 arrest (Roth et al. 2000). But zygotes produced by crossing a
transvestite to a wild-type cell of the same mating type will keep expressing pheromones and
receptors from both mating types (since both parents have the same MAT locus), raising the
concern that these zygotes respond to their own pheromones and remain arrested in G1. To
measure the mating efficiency of these crosses, we selected for viable diploids by crossing
transvestite cells and wild-type cells with complementary nutritional requirements. We obtained
both MATa-playing-α/MATa and MATα-playing-a/MATα diploids. Most of these diploids
progress normally through the cell cycle and have normal cell morphology (Figure 1C). We did
find an occasional population of MATα-playing-a/MATα diploids with abnormal morphology,
suggesting delayed progression through G1, but even these are capable of budding (Figure 1C).
The ability of these diploids to bud indicates that it is possible to measure the mating efficiency
of transvestites crossed with wild-type cells.
We used quantitative mating assays to measure the mating efficiency of the transvestite
cells. Cells of the two mating types are incubated together and then plated on media that
distinguishes diploid cells from either parental haploid. When wild-type MATa cells are mated
with wild-type MATα cells, 66% of haploids form diploids (Figure 1D). However, the mating

12
efficiency of the MATa-playing-α cells crossed with MATa cells is three-fold lower than that of a
wild-type cross, and the mating efficiency of the MATα-playing-a cells crossed with MATα cells
is about 60-fold lower than the efficiency of a wild-type cross (Student’s t-test, p<10-6
) (Figure
1D). These mating defects are synergistic: crossing the transvestite strains to each other
decreases mating efficiency about 700-fold, (Student’s t-test, p<10-6
) (Figure 1D). Our
observation that transvestites can mate with unmanipulated strains with the same MAT locus,
confirms earlier work showing that pheromones and receptors define a cell's mating type (Bender
and Sprague 1989). But the low mating efficiency of the transvestite crosses implies that there
are additional requirements for efficient mating.
MATa-playing-α cells produce too little α-factor: We studied the mating defects of
transvestite cells. MATa-playing-α cells mate three-fold less efficiently than genuine MATα cells
(Figure 1D). Because the engineered genes in this strain encode the pheromone and pheromone
receptor, the best candidates for this difference were the ability of the MATa-playing-α cells to
respond to a-factor and to produce α-factor.
We began by testing the response to a-factor. We made mating mixtures of MATa-
playing-α cells expressing YFP under the pheromone-inducible promoter, PFUS1, and MATa cells
expressing mCherry under the ACT1 promoter and assayed for the expression of YFP in the
MATa-playing-α cells after 2.5 hours. The expression of YFP in the MATa-playing-α cells
indicates that they can successfully detect a-factor using the a-factor receptor and activate
pheromone-induced genes (Figure 2A). The two cell types mated to form zygotes that continue
to signal to themselves, thus forming diploid cells, which express both YFP under the FUS1
promoter and mCherry under the ACT1 promoter (Figure 2A). Since the G-protein and

13
downstream components of the pheromone signaling pathway should be the same in MATa and
MATα cells (Bardwell 2005), we asked if reduced pheromone production is the cause of the
mating defect.
Pheromone production is important for zygote formation (Kurjan 1985; Michaelis and
Herskowitz 1988), and MATa cells prefer the MATα cell that produces the highest amount of α-
factor (Jackson and Hartwell 1990). Since we manipulated pheromone genes to make the
transvestites, we measured the pheromone production of MATa-playing-α cells using a bioassay.
We grew cells in rich medium, filtered out the cells, incubated the medium with MATa cells
lacking the α-factor protease, Bar1, measured the fraction of cells that arrest and shmoo (the
shmooing index), and compared this data to a standard curve generated with synthetic α-factor.
Unstimulated, MATa-playing-α cells produce about 70 times less α-factor than MATα cells
(Student’s t-test, p=0.01) (Figure 2B). To measure the α-factor production of stimulated cells,
we mixed the α-factor producing cells in a 10:1 mixture with MATa bar1Δ cells (which produce
a-factor and do not destroy α-factor) and measured the α-factor present in the supernatant.
Stimulated MATa-playing-α cells produce 20-fold less α-factor than stimulated wild-type MATα
cells (Student’s t-test, p=9x10⁻⁶
) (Figure 2B).
To test the effect of reduced pheromone production in MATα cells, we knocked out
MFα1, which is the majority α-factor producer in MATα cells (Kurjan 1985). This reduces α-
factor production 12-fold compared to wild-type MATα cells in unstimulated cells (Student’s t-
test, p=0.02) and 9-fold in stimulated cells (Student’s t-test, p=10-5
) (Figure 2B). We compared
the mating efficiency of MATα mfα1Δ cells, which have decreased mating efficiency (Kurjan
1985), to that of MATa-playing-α cells and determined that MATα mfα1Δ cells only mate 1.5-
fold more efficiently than MATa-playing-α cells (Student’s t-test, p=0.004) (Figure 2C). This

14
suggests that the reduced mating efficiency of the MATa-playing-α cells is due, at least in part, to
low α-factor production.
To test this hypothesis, we increased α-factor production in the MATa-playing-α cells by
expressing MFα1 from the TDH3 promoter. This promoter is not pheromone-regulated, but it is
one of the most highly expressed promoters in the yeast genome (Krebs 1953; McAlister and
Holland 1985) and should increase α-factor production to at least wild-type MATα levels.
Unstimulated MATa-playing-α PTDH3-MFα1 cells secrete twice as much α-factor as unstimulated
MATα cells (Student’s t-test, p=0.04), but when stimulated, MATa-playing-α PTDH3-MFα1 cells
secrete 5-fold more α-factor than stimulated MATα cells (Student’s t-test, p=10-4
) (Figure 2B),
suggesting that α-factor production is regulated by both post-translational mechanisms, such as
pheromone maturation and secretion and transcription of the pheromone genes. If low α-factor
production accounts for the weak mating of MATa-playing-α cells, MATa-playing-α PTDH3-MFα1
cells should have a mating efficiency approaching that of wild-type MATα cells, which is indeed
what we found (Figure 2C). This confirms previous results, which showed that sufficient α-
factor production is important for efficient mating (Kurjan 1985) and shows that the principle
defect of MATa-playing-α cells is insufficient α-factor production. This defect could reflect a
difference in the strengths of the MFA1 versus the MFα1 promoter or differences in the
translation or processing of α-factor between MATa and MATα cells. Our analysis also shows
that there are no additional MATa-specific genes, beyond those we manipulated (STE2, MFA1,
MFA2, BAR1, and ASG7), that interfere with the ability of MATα cells to mate.
AFB1 encodes a novel a-factor barrier protein: We examined the decreased mating
efficiency of the MATα-playing-a cells. Because pheromone production is important for

15
efficient mating (Kurjan 1985; Michaelis and Herskowitz 1988), we investigated a-factor
production of MATα-playing-a cells. Both α-factor and a-factor go through several processing
steps before secretion (Betz and Duntze 1979; Kurjan and Herskowitz 1982). But while α-factor
is secreted as a small, unmodified peptide (Kurjan and Herskowitz 1982), mature a-factor is
modified with a 15 carbon farnesyl group, causing it to be very hydrophobic (Betz and Duntze
1979; Chen et al. 1997) and hard to quantify biochemically. We therefore used a bioassay to
measure the relative a-factor production of the MATα-playing-a cells: we plated patches of a-
factor producing cells and then sprayed the plates with a suspension of MATα cells that were
made supersensitive to pheromone by deleting SST2, which encodes a GTPase activating protein
that reduces the duration of signaling from the pheromone-activated G protein (Chan and Otte
1982a; Chan and Otte 1982b; Dohlman et al. 1996; Apanovitch et al. 1998). The a-factor
secreted by the patch of cells arrests the MATα sst2Δ tester cells in G1, producing a halo of
growth inhibition (Chan and Otte 1982a; Chan and Otte 1982b); the halo's diameter increases
with the amount of a-factor produced by the cell patch (Figure 3A). The halo produced by
MATα-playing-a cells is smaller than that of wild-type MATa cells, implying that MATα-playing-
a cells secrete less a-factor than wild-type MATa cells (Figure 3B).
We considered two explanations for the low a-factor secretion of MATα-playing-a cells:
MATα-playing-a cells secrete less a-factor than MATa cells, or MATα cells secrete a protein that
provides a barrier to a-factor that is analogous to the MATa-specific α-factor protease, Bar1. We
tested for the presence of a MATα-specific a-factor blocker secreted from MATα-playing-a cells
by comparing the halo sizes of two mixtures of cells: MATa cells mixed with MATα-playing-a
cells and MATa cells mixed with MATa cells that lack the genes encoding a-factor and, thus,
produce no a-factor (MATa mfa1Δ mfa2Δ). If the MATα-playing-a cells secrete an a-factor

16
blocker, we would expect the halo size of the MATa cells mixed with MATα-playing-a cells to be
smaller than that of the MATa cells mixed with pheromone-less MATa cells because the a-factor
blocker would interfere with the a-factor from both the MATα-playing-a cells and the MATa
cells. However, if there is no a-factor blocker, we would expect the halo size of the MATa cells
mixed with MATα-playing-a cells to be larger than that of the MATa cells mixed with
pheromone-less MATa cells because both the MATa cells and the MATα-playing-a cells are
capable of secreting a-factor. The halo produced by MATa cells mixed with MATα-playing-a
cells is smaller than the halo produced by MATa cells mixed with pheromone-less MATa cells,
indicating that MATα-playing-a cells secrete an a-factor blocker (Figure 3C).
We searched for the gene responsible for this activity by comparing the transcriptomes of
MATa and MATα-playing-a cells. Although the gene expression of pheromone-stimulated MATa
cells has been investigated, the extreme hydrophobicity of a-factor has made similar experiments
on pheromone-stimulated MATα cells difficult (Roberts et al. 2000). The MATα-playing-a cells
make it possible to study the transcriptome of pheromone-stimulated cells that are MATα at the
MAT locus but are stimulated by α-factor in a controlled fashion. We chose a concentration of
pheromone, 10nM, in a regime in which MATa bar1Δ and MATα-playing-a cells with BAR1
under its endogenous promoter have a similar shmooing index (Figure 4A), to compare the
transcriptomes of stimulated and unstimulated MATa and MATα-playing-a cells using RNA
sequencing.
Just as MATα cells do not secrete Bar1 to cleave their own α-factor (Sprague Jr and
Herskowitz 1981), we would not expect MATa cells to secrete an a-factor blocker to inhibit their
own a-factor. Thus, we hypothesized that a MATα-specific a-factor blocker would be expressed
more highly in both pheromone-stimulated and unstimulated MATα-playing-a than MATa cells.

17
Ten genes fit this criterion and of these, only one, YLR040C, is annotated as encoding a secreted
protein that is not already known to be important in mating (Yeast Genome Database,
http://www.yeastgenome.org) (see Table S2).
YLR040C was previously identified as an α-specific gene by its reduced transcription in a
MATα cell that lacked the transcription factor Matα1 (Galgoczy et al. 2004), which induces
expression of α-specific genes (Strathern et al. 1981). It has also been shown to be translated by
ribosome profiling (Brar et al. 2012) and localized to the cell wall (Hamada et al. 1999; Giaever
et al. 2002). Deletion of YLR040C was reported as having no effect on mating (Galgoczy et al.
2004). We found that in unstimulated cells the gene is expressed 11-fold more strongly in
MATα-playing-a than in MATa cells and that its transcription is not significantly induced when
MATα-playing-a cells are exposed to pheromone (see Table S2). The protein is conserved in
yeasts that experienced the whole genome duplication around 100 million years ago and is also
found in some yeasts, such as Hansenula polymorpha, that substantially predate this event
(Wolfe and Shields 1997; Dietrich et al. 2004; Dujon et al. 2004; Kellis et al. 2004) (Figure 3D).
The experiments described below demonstrate that YLR040C encodes a protein that provides an
a-factor barrier function, leading us to name this gene AFB1 for a-factor barrier.
To determine whether AFB1 is indeed the a-factor blocker, we knocked it out in MATα-
playing-a cells. The halos produced by MATα-playing-a afb1Δ cells are larger than those of
MATα-playing-a AFB1 cells, indicating that deleting AFB1 increases the amount of pheromone
secreted from a patch of MATα-playing-a cells (Figure 3B). The halo around the MATα-playing-
a afb1Δ cells, however, is still smaller than the halo produced by wild-type MATa cells
suggesting that MATα-playing-a cells secrete less a-factor than wild-type MATa cells (Figure
3B). We also placed AFB1 under a strong (ACT1) promoter in MATa cells and observed a

18
decrease in halo size compared to wild-type MATa cells, indicating that Afb1 is able to block a-
factor secreted by MATa cells (Figure 3B).
To test whether Afb1 is responsible for blocking a-factor produced by other cells, we
made cell mixtures of MATa cells with MATα-playing-a afb1Δ cells and compared the halo
produced by this mixture to the halo produced by the mixtures of MATa cells with MATα-
playing-a cells and to the halo produced by MATa cells with MATa mfa1Δ mfa2Δ cells. As
expected from our other results, the mixture of MATa cells with MATα-playing-a afb1Δ cells has
a slightly larger halo than the MATa cells mixed with MATa mfa1Δ mfa2Δ cells and a
significantly larger halo than the MATa cells mixed with MATα-playing-a cells (Figure 3C).
This result indicates that when Afb1 is not present in the cell mixtures, the a-factor from the
wild-type MATa cells as well as that from the MATα-playing-a cells is free to interact with the
supersensitive MATα cells. Taken together, our results provide strong evidence that Afb1 has an
a-factor barrier function.
We asked whether the expression of AFB1 affected the mating efficiency of MATα-
playing-a cells. We crossed MATα-playing-a afb1Δ cells with wild-type MATα cells and
observed a five-fold increase in mating efficiency over a similar cross with MATα-playing-a cells
(Student’s t-test, p<10-6
) (Figure 3E). However, deleting AFB1 from wild-type MATα cells does
not reduce their mating efficiency (Figure 3E), perhaps because small changes in a-factor
production do not have a large effect on mating efficiency (Michaelis and Herskowitz 1988).
We tested this possibility in two ways. The first was to delete MFA1 from wild-type MATa cells.
We saw a small decrease in the halo size of MATa mfa1Δ compared to that of wild-type MATa
cells, but as previously reported (Michaelis and Herskowitz 1988), the mating efficiency of
MATa mfa1Δ cells was statistically indistinguishable from that of MATa MFA1 cells (Figure 3B

19
and 3E). We also tested the mating efficiency of MATa cells with AFB1 placed under the ACT1
promoter. These cells produce a smaller halo than wild-type MATa cells (Figure 3B) but mate
slightly better than wild-type MATa cells, implying that there is a range of a-factor production
that results in efficient mating, at least in the absence of additional mutations (Student’s t-test,
p=0.03) (Figure 3E).
MATα-playing-a cells shmoo but arrest only transiently in the presence of
pheromone: Although the expression of AFB1 in MATα-playing-a cells was responsible for a
portion of the reduced mating efficiency of MATα-playing-a cells, MATα-playing-a afb1Δ cells
still mate 12-fold worse than wild-type MATa cells (Student’s t-test, p<10-6
) (Figure 3E). We
hypothesized that the response of MATα-playing-a cells to pheromone could also reduce their
mating efficiency.
There are three cellular responses to pheromone stimulation: altered gene expression, cell
polarization, and cell cycle arrest (Bardwell 2005). We compared the transcriptomes of MATα-
playing-a and MATa cells both with and without exposure to α-factor (see Table S2), excluding
those genes, such as STE3 and BAR1, that had been removed during the construction of the
strains. Twenty-one genes showed a more than two-fold variation in both comparisons. Ten
genes showed a more than two-fold variation when comparing the two stimulated cell types but
were not significantly different when comparing the unstimulated cells, and another 8 genes
showed the opposite pattern. As expected, known α-specific genes, such as the MATα-specific
agglutinin gene, SAG1, were expressed more strongly in MATα-playing-a cells than in MATa
cells, and known a-specific genes, such as the a-specific agglutinin gene, AGA2, were expressed
less strongly in MATα-playing-a cells than in MATa cells. Despite our attempts to engineer their

20
expression to match the levels seen in MATa cells, three important a-specific genes, STE2,
MFA1, and MFA2 are expressed at five-fold, seven-fold, and 120-fold lower levels, respectively,
in MATα-playing-a cells compared to MATa cells (see Table S2).
We assayed cell polarization (Segall 1993; Butty et al. 1998) by measuring the shmooing
index of MATα-playing-a cells stimulated with known quantities of synthetic α-factor. We found
that MATα-playing-a PBAR1-BAR1 cells have a similar shmooing index to MATa bar1Δ cells at
low concentrations of α-factor, indicating that the MATα-playing-a cells are as sensitive to low
concentrations of α-factor as MATa cells (Figure 4A) and suggesting that BAR1 is not expressed
in MATα cells. Because efficient mating in MATa x MATα crosses depends on the secretion of
Bar1 by the MATa cells, we investigated the pheromone response of MATα-playing-a cells that
express BAR1 from a mutant version of the pheromone-induced FUS1 promoter (Trueheart et al.
1987): the mutant promoter, PFUS1*, was selected to have a low basal and a high pheromone-
stimulated level of expression (Ingolia and Murray 2007). These cells make fewer shmoos at
50nM α-factor than MATα-playing-a PBAR1-BAR1 cells (which lack detectable Bar1 activity)
make at 2nM α-factor, indicating that MATα-playing-a PFUS1*-BAR1 cells are able to secrete
Bar1 (Student’s t-test, p=0.02) (Figure 4A and 4B). In contrast, the MATα-playing-a PFUS1*-
BAR1 cells make significantly more shmoos than wild-type MATa cells at each concentration of
α-factor tested (Student’s t-test, p<0.005) (Figure 4B), suggesting that MATα-playing-a PFUS1*-
BAR1 cells secrete less Bar1 than wild-type MATa cells. This difference is unlikely to be the
sole remaining cause of the mating defect of MATα-playing-a PFUS1*-BAR1 cells: reducing the
expression of Bar1 in MATa cells, by expressing it from the FUS1* promoter, does not reduce
their mating efficiency (Figure 4C).

21
We observed α-factor-induced cell cycle arrest (Chang and Herskowitz 1990) in a
microfluidic device. Pheromone stimulation arrests MATa cells in G1 through phosphorylation
of Far1, a protein that binds to cyclin-dependent kinase/cyclin complexes (Chang and
Herskowitz 1990; Tyers and Futcher 1993; Peter and Herskowitz 1994). When MATa bar1Δ
cells are exposed to 10nM α-factor, their cell cycle remains arrested for many hours while they
form multiple successive shmoos (Figure 4D and see File S3). However, even at this high α-
factor concentration, MATα-playing-a bar1Δ cells form shmoos but arrest only transiently
(Figure 4D and see File S4).
The transient cell cycle arrest in MATα-playing-a cells could be due to a difference in the
response of MATα and MATa cells to pheromone stimulation or the inhibition of Ste2 by MATα-
specific proteins in the MATα-playing-a cells. We tried to find the responsible genes by looking
for differential expression of genes that might have an effect on cell cycle arrest between
pheromone-stimulated MATa and MATα-playing-a cells. We manipulated the expression of
three candidates, PCL1, GYP8, and TOS4, which had at least a two-fold difference in expression
between stimulated MATa and MATα-playing-a cells and a plausible connection to cell cycle
control (see Table S2). None of these manipulations altered the pheromone-induced cell cycle
arrest of either MATa or MATα-playing-a cells (Data not shown).
How robust is mating?: Mating would be robust to variation in pheromone levels if
substantial increases or decreases in pheromone expression had no effect on mating efficiency.
The mating of the transvestite strains to each other suggests that mating efficiency is not robust
to variation in pheromone production. Mating MATa-playing-α cells to wild-type MATa cells
reduces mating frequency three-fold, and mating MATα-playing-a cells to wild type MATα cells

22
reduces mating 60-fold, relative to a wild type MATa x MATα cross, but the mating frequency of
the cross between the two transvestites is reduced 700-fold, suggesting that mating defects are
synergistic (Student’s t-test, p<10-6
) (Figure 1D). If this synergism is largely due to reduced
pheromone production by the transvestite strains, increasing pheromone production should
increase the efficiency of the inter-transvestite cross. We increased α-factor production from
MATa-playing-α cells by placing MFα1 under the control of the TDH3 promoter and a-factor
production from MATα-playing-a cells by deleting AFB1. When crossed to each other, these
strains mate 90 times better than the cross between the original MATa-playing-α and MATα-
playing-a cells. Thus, after improving pheromone production, the inter-transvestite cross is only
eight-fold less efficient than a standard MATa x MATα cross (Student’s t-test, p<10-6
) (Figure 5).
If reduced pheromone production is the primary cause of the weak mating of the inter-
transvestite cross, the cross between a MATα strain making less α-factor and a MATα-playing-a
cell should mimic the inter-transvestite cross. The mating efficiency of the cross between MATα
mfα1Δ cells, which produce less α-factor than wild-type MATα cells, and MATα-playing-a cells
is statistically indistinguishable from that of the double transvestite cross (Figure 2B and 5).
DISCUSSION
Our experiments show that genetic engineering can be used to investigate the factors that
control the efficiency of mating in budding yeast. We tested the idea that previous research had
found all the genes that control mating efficiency by engineering transvestite strains that switch
the mating genes of one mating type for those that are normally expressed in its partner. The
behavior of these strains led to two conclusions: there are still more genes that control mating,

23
such as the a-factor barrier protein, Afb1, and mating is not robust to reductions in pheromone
production.
Engineering efficient maters: Investigating the pheromone production of the
transvestite strains allowed us to account for a significant portion of their mating defects.
Unstimulated MATa-playing-α cells secrete 70-fold less α-factor than wild-type MATα cells, and
stimulated MATa-playing-α cells secrete 20-fold less α-factor than stimulated MATα cells.
Increasing the α-factor production of the MATa-playing-α cells increased their mating efficiency
to nearly that of wildtype, showing that the main defect of the MATa-playing-α cells is low α-
factor production and that the level of α-factor secretion is important for efficient mating. The
observation that α-factor secretion is still pheromone-inducible, even when α-factor expression is
driven by a strong, constitutive promoter, demonstrates that pheromone processing and export
respond to pheromone stimulation. Indeed, Ste13, a protein required for the maturation of α-
factor (Julius et al. 1983), is pheromone-induced (Achstetter 1989).
The mating defects of MATα-playing-a cells are more complex. We determined that
these cells do not make as much a-factor as wild-type MATa cells and that at least part of this is
due to the expression of the novel a-factor blocker, Afb1. Increasing the a-factor production of
MATα-playing-a cells by deleting AFB1 causes a five-fold increase in their mating efficiency,
indicating that sufficient a-factor expression is important for efficient mating as a MATa cell.
We were unable to engineer MATα cells to mate efficiently as MATa cells. There are two
possible explanations for the remaining defect: even after the removal of Afb1, the MATα-
playing-a cells make less a-factor than MATa cells, and MATα-playing-a cells only arrest

24
transiently in response to α-factor. We suspect both contribute to the reduced mating of MATα-
playing-a cells.
Similar pheromone and receptor swaps have been done on other fungi, including
Cryptococcus neoformans (Stanton et al. 2010) and Ustilago maydis (Bölker et al. 1992). Like
the strains we constructed, the engineered versions of these organisms could mate to cells that
bore the same genes at the mating type locus. In Candida albicans, a-a or α-α matings can be
induced by enhancing autocrine signaling or the presence of the opposite pheromone (Alby et al.
2009). Studying the mating defects of engineered transvestites in other fungi, should identify
additional genes involved in their mating pathways.
AFB1 encodes a novel MATα-specific a-factor barrier protein: Studies on
pheromone-induced genes in MATα cells were hampered by the difficulties in working with a-
factor. We avoided these by looking at the pattern of gene expression in MATα-playing-a cells,
which would still express α-specific genes but would increase their expression in response to α-
rather than a-factor. We argued that novel α-specific genes would be identified by higher
expression in MATα-playing-a than in MATa cells. Mixing experiments suggested that MATα-
playing-a cells produced an extracellular factor that interfered with the action of a-factor,
prompting us to look for the secreted product of a MATα-specific gene. This computational
sieve produced a single gene, YLR040C, which had previously been identified as a gene
regulated by the MATα-specific transcription factor, Matα1 (Galgoczy et al. 2004). Removing
YLR040C increased a-factor production from MATα-playing-a cells and the mating efficiency of
MATα-playing-a cells, leading us to rename YLR040C AFB1 for a-factor barrier. There have
been previous searches for a protein with a-factor barrier function. The first reported a

25
supersensitive MATα mutant, which mapped to a location on Chromosome XII over 600
kilobases away from AFB1 (Steden et al. 1989). The second reported the detection of MATα-
specific a-factor endopeptidase activity, but the gene responsible for this was not identified, and
the protein was not purified (Marcus et al. 1991). Without being able to manipulate the genes
involved in these studies, it is impossible to assess their effect on a-factor activity or stability or
their relationship to AFB1.
Deleting AFB1 increased the mating efficiency of MATα-playing-a cells. Sequence
analysis shows Afb1 is conserved as far as Hansenula polymorpha and contains an N-terminal
signal sequence and C-terminal motif that suggests it is a GPI-anchored protein (Hamada et al.
1999) but lacks other detectable motifs. In particular, Afb1 shows no sequence homology with
any other protease but contains a number of conserved aromatic residues (Figure 3D). Our
inability to find Afb1 throughout the ascomycete fungi has two possible interpretations: either
the protein evolves too rapidly to be detected by standard tools that use sequence homology to
identify orthologs, or the protein evolved within in one branch of the ascomycete lineage, rather
than in its last common ancestor. Unusually rapid evolution of a single protein or independent
evolution of the same function in different lineages may also explain why the α-factor degrading
protease, Bar1, in S. cerevisiae is not the closest homolog of the same protein in C. albicans
(Schaefer et al. 2007).
We speculate that Afb1 acts to bind and sequester a-factor rather than to degrade it. The
biological function of Afb1 may mirror that of Bar1, which promotes the efficient mating of
MATa cells by keeping the α-factor concentration at the plasma membrane within the narrow
range needed for accurate pheromone gradient detection (Barkai et al. 1998). Since Afb1 is
predicted to be GPI-anchored, it is possible that the function of Afb1 closely mimics that of Bar1

26
trapped in the cell wall of MATa cells: creating a pheromone sink that makes it both more likely
that two cells of the same mating type will avoid each other (Jin et al. 2011) and easier to
distinguish between two, close, potential partners (Rappaport and Barkai 2012). It is also
possible that Afb1 in S. cerevisiae acts like Bar1 in C. albicans (Alby et al. 2009): decreasing the
threat of autocrine signaling caused by leaky repression of a-factor in MATα cells.
MATα-playing-a cells only arrest transiently in response to pheromone: In MATa
cells, exposure to α-factor leads to a prolonged cell cycle arrest. In contrast, MATα-playing-a
cells show only a transient arrest, even though their ability to shmoo is statistically
indistinguishable from wild-type MATa cells. This result surprised us because MATa and MATα
cells arrest the cell cycle in the same fashion: by signaling through Far1 (Peter and Herskowitz
1994; Bardwell 2005).
There are two possible explanations for the transient cell cycle arrest of MATα-playing-a
cells. The first is that MATa and MATα cells have evolved to respond to pheromone stimulation
in subtly different ways and that MATα cells shmoo but do not experience enduring arrest.
Although it is important for cells to be in the same phase of the cell cycle during nuclear fusion,
it is possible that transient arrest of MATα cells is sufficient to allow for the formation of
zygotes, while a lasting arrest is required for MATa cells. Because α-factor is more diffusible,
we suspect that initial signaling is usually from α to MATa cells, meaning that it is the
MATa cells that arrest first and, thus, need to wait until the α cells receive a strong enough
signal to arrest, implying that fusion would usually occur shortly after the arrest of the MATα cell
but at a longer and more variable time after the arrest of the MATa cell.

27
The second possibility is that interactions between Ste2 and proteins present in the
MATα-playing-a cells make the cells keep cycling, like cells that express both Ste3 and Asg7
(Bender and Sprague 1989; Roth et al. 2000). We looked for genes that might be responsible for
the lack of enduring arrest in MATα-playing-a cells by focusing on genes that are differentially
expressed in pheromone-stimulated MATa and MATα-playing-a cells and might not have been
identified in earlier work. Although we tested the effect of deleting or overexpressing several
candidate genes individually, we did not find an individual gene responsible for the transient cell
cycle arrest in MATα-playing-a cells.
Robustness of mating: Characterizing the mating defects of the transvestite strains
allowed us to improve our understanding of the pheromone response of MATα cells and study the
robustness of mating efficiency to changes in gene expression. We investigated changing the
expression levels of three proteins: Bar1, α-factor, and a-factor.
The α-factor protease, Bar1, helps MATa cells to detect an α-factor gradient and choose a
mating partner (Sprague Jr and Herskowitz 1981; Jackson and Hartwell 1990; Barkai et al.
1998). Reducing Bar1 expression by using an engineered FUS1 promoter (Ingolia and Murray
2007) reduces the concentration of α-factor required to get 50% of the cells to shmoo four-fold.
This change appears to have little effect on mating: expressing BAR1 under PFUS1* in MATa cells
leaves mating unimpaired, suggesting that mating efficiency is robust to substantial changes in
Bar1 expression.
Mating efficiency is not robust to reductions in α-factor secretion, a result that might have
been predicted from work that showed that cells make graded responses to increasing levels of
pheromone stimulation (Moore 1983; Takahashi and Pryciak 2008). Previous studies have

28
shown that agglutination, shmoo formation, and pheromone-induced transcription increase with
increasing α-factor concentration (Moore 1983; Takahashi and Pryciak 2008). Decreased α-
factor production leads to a fusion defect and, thus, a decrease in mating efficiency (Brizzio et al.
1996). We show that an approximately 10-fold reduction in α-factor production in otherwise
wild-type cells, such as MATα mfα1Δ cells, results in a two-fold reduction in mating efficiency
when mated to a wild-type partner. Mating MATα mfα1Δ cells to a compromised partner, such
as the MATα-playing-a cells, results in a synergistic reduction in mating efficiency. Although
reduced levels of a-factor production have also been shown to cause a cell fusion defect and a
decrease in mating efficiency (Brizzio et al. 1996), the precise regulation of a-factor production
does not appear to be as important to mating efficiency as precise regulation of α-factor
production. MATa mfa1Δ cells have a mating efficiency that is indistinguishable from wildtype
(Michaelis and Herskowitz 1988), and reducing the a-factor production of MATa cells by
overexpressing AFB1 actually causes a slight increase in mating efficiency, indicating that the
ideal quantity of a-factor production may be less than the amount of a-factor produced by wild-
type MATa cells but greater than the amount of a-factor produced by MATα-playing-a cells.
Taken together, these results argue for a molecular arms race in pheromone production.
Cells prefer the partner that makes the most pheromone (Jackson and Hartwell 1990), possibly
because this is the only indicator of fitness available to a potential mating partner. We speculate
that both MATa and MATα cells have evolved to produce higher and higher concentrations of
pheromone, resulting in the need for proteins such as Bar1 and Afb1 to improve gradient
detection in dense mating mixtures. Once such functions have been evolved, they imply that
mutations that reduce pheromone production back to ancestral levels will decrease mating
efficiency because the pheromone antagonists overwhelm the lower pheromone levels.

29
ACKNOWLEDGEMENTS
We thank V. Denic, R. Gaudet, C. Hunter, and members of the Murray laboratory for
reading and commenting on the manuscript. We also thank J. Gonçalves-Sá for thoughtful
discussion and M. Piel for strains. This work was supported by National Institute of General
Medical Sciences Grant P50GM068763 of the National Centers for Systems Biology Program
and a National Science Foundation Graduate Research Fellowship and Ashford Fellowship to
L.B.H.

30
LITERATURE CITED
Achstetter, T., 1989 Regulation of α-factor production in Saccharomyces cerevisiae: a-factor
pheromone-induced expression of the MFα1 and STE13 genes. Mol. Cell. Biol. 9: 4507-4514.
Alby, K., D. Schaefer and R. J. Bennett, 2009 Homothallic and heterothallic mating in the
opportunistic pathogen Candida albicans. Nature 460: 890-893.
Apanovitch, D. M., K. C. Slep, P. B. Sigler and H. G. Dohlman, 1998 Sst2 is a GTPase-
activating protein for Gpa1: Purification and characterization of a cognate RGS-Gα protein pair
in yeast. Biochemistry (N. Y.) 37: 4815-4822.
Bardwell, L., 2005 A walk-through of the yeast mating pheromone response pathway. Peptides
26: 339-350.
Barkai, N., M. D. Rose and N. S. Wingreen, 1998 Protease helps yeast find mating partners.
Nature 396: 422-423.
Bender, A., and G. Sprague, 1989 Pheromones and pheromone receptors are the primary
determinants of mating specificity in the yeast Saccharomyces cerevisiae. Genetics 121: 463-
476.
Betz, R., and W. Duntze, 1979 Purification and partial characterization of a factor, a mating
hormone produced by mating-type-a cells from Saccharomyces cerevisiae. Eur. J. Biochem. 95:
469-475.

31
Blumer, K. J., J. E. Reneke and J. Thorner, 1988 The STE2 gene product is the ligand-binding
component of the α-factor receptor of Saccharomyces cerevisiae. J. Biol. Chem. 263: 10836-
10842.
Bölker, M., M. Urban and R. Kahmann, 1992 The a mating type locus of U. maydis specifies
cell signaling components. Cell 68: 441-450.
Brar, G. A., M. Yassour, N. Friedman, A. Regev, N. T. Ingolia et al, 2012 High-resolution view
of the yeast meiotic program revealed by ribosome profiling. Science 335: 552-557.
Brizzio, V., A. E. Gammie, G. Nijbroek, S. Michaelis and M. D. Rose, 1996 Cell fusion during
yeast mating requires high levels of a-factor mating pheromone. J. Cell Biol. 135: 1727-1739.
Butty, A. C., P. M. Pryciak, L. S. Huang, I. Herskowitz and M. Peter, 1998 The role of Far1p in
linking the heterotrimeric G protein to polarity establishment proteins during yeast mating.
Science 282: 1511-1516.
Cappellaro, C., K. Hauser, V. Mrśa, M. Watzele, G. Watzele et al, 1991 Saccharomyces
cerevisiae a-and α-agglutinin: Characterization of their molecular interaction. EMBO J. 10:
4081-4088.
Chan, R. K., and C. A. Otte, 1982a Physiological characterization of Saccharomyces cerevisiae
mutants supersensitive to G1 arrest by a factor and α factor pheromones. Mol. Cell. Biol. 2: 21-
29.

32
Chan, R. K., and C. A. Otte, 1982b Isolation and genetic analysis of Saccharomyces cerevisiae
mutants supersensitive to G1 arrest by a factor and α factor pheromones. Mol. Cell. Biol. 2: 11-
20.
Chang, F., and I. Herskowitz, 1990 Identification of a gene necessary for cell cycle arrest by a
negative growth factor of yeast: FAR1 is an inhibitor of a G1 cyclin, CLN2. Cell 63: 999-1011.
Chen, P., S. K. Sapperstein, J. D. Choi and S. Michaelis, 1997 Biogenesis of the Saccharomyces
cerevisiae mating pheromone a-factor. J. Cell Biol. 136: 251-269.
Collart, M. A., and S. Oliviero, 2001 Preparation of yeast RNA. Current protocols in molecular
biology 23: 13.12.1-13.12.5.
de Nobel, H., J. Pike, P. N. Lipke and J. Kurjan, 1995 Genetics of a-agglutinin function in
Saccharomyces cerevisiae. Molecular and General Genetics MGG 247: 409-415.
Dietrich, F. S., S. Voegeli, S. Brachat, A. Lerch, K. Gates et al, 2004 The Ashbya gossypii
genome as a tool for mapping the ancient Saccharomyces cerevisiae genome. Science 304: 304-
307.
Dohlman, H. G., J. Song, D. Ma, W. E. Courchesne and J. Thorner, 1996 Sst2, a negative
regulator of pheromone signaling in the yeast Saccharomyces cerevisiae: Expression,
localization, and genetic interaction and physical association with Gpa1 (the G-protein α
subunit). Mol. Cell. Biol. 16: 5194-5209.
Dohlman, H. G., and J. W. Thorner, 2001 Regulation of G protein-initiated signal transduction in
yeast: Paradigms and principles. Annu. Rev. Biochem. 70: 703-754.

33
Dujon, B., D. Sherman, G. Fischer, P. Durrens, S. Casaregola et al, 2004 Genome evolution in
yeasts. Nature 430: 35-44.
Edgar, R., M. Domrachev and A. E. Lash, 2002 Gene expression omnibus: NCBI gene
expression and hybridization array data repository. Nucleic Acids Res. 30: 207-210.
Galgoczy, D. J., A. Cassidy-Stone, M. Llinás, S. M. O'Rourke, I. Herskowitz et al, 2004
Genomic dissection of the cell-type-specification circuit in Saccharomyces cerevisiae.
Proceedings of the National Academy of Sciences 101: 18069-18074.
Giaever, G., A. M. Chu, L. Ni, C. Connelly, L. Riles et al, 2002 Functional profiling of the
Saccharomyces cerevisiae genome. Nature 418: 387-391.
Gonçalves-Sá, J., and A. Murray, 2011 Asymmetry in sexual pheromones is not required for
ascomycete mating. Current Biology 21: 1337-1346.
Haber, J. E., 1998 Mating-type gene switching in Saccharomyces cerevisiae. Annu. Rev. Genet.
32: 561-599.
Hagen, D. C., G. McCaffrey and G. F. Sprague Jr, 1986 Evidence the yeast STE3 gene encodes a
receptor for the peptide pheromone a factor: Gene sequence and implications for the structure of
the presumed receptor. Proc. Natl. Acad. Sci. U. S. A. 83: 1418-1422.
Hamada, K., H. Terashima, M. Arisawa, N. Yabuki and K. Kitada, 1999 Amino acid residues in
the ω-minus region participate in cellular localization of yeast glycosylphosphatidylinositol-
attached proteins. J. Bacteriol. 181: 3886-3889.

34
Herskowitz, I., 1988 Life cycle of the budding yeast Saccharomyces cerevisiae. Microbiol. Rev.
52: 536-553.
Ingolia, N. T., and A. W. Murray, 2007 Positive-feedback loops as a flexible biological module.
Curr. Biol. 17: 668-677.
Jackson, C. L., and L. H. Hartwell, 1990 Courtship in S. cerevisiae: Both cell types choose
mating partners by responding to the strongest pheromone signal. Cell 63: 1039-1051.
Jin, M., B. Errede, M. Behar, W. Mather, S. Nayak et al, 2011 Yeast dynamically modify their
environment to achieve better mating efficiency. Science signaling 4: ra54.
Julius, D., L. Blair, A. Brake, G. Sprague and J. Thorner, 1983 Yeast α factor is processed from a
larger precursor polypeptide: The essential role of a membrane-bound dipeptidyl
aminopeptidase. Cell 32: 839-852.
Kellis, M., B. W. Birren and E. S. Lander, 2004 Proof and evolutionary analysis of ancient
genome duplication in the yeast Saccharomyces cerevisiae. Nature 428: 617-624.
Kim, J., E. Bortz, H. Zhong, T. Leeuw, E. Leberer et al, 2000 Localization and signaling of Gβ
subunit Ste4p are controlled by a-factor receptor and the a-specific protein Asg7p. Science
Signaling 20: 8826-8835.
Krebs, E. G., 1953 Yeast glyceraldehyde-3-phosphate dehydrogenase I. electrophoresis of
fractions precipitated by nucleic acid. J. Biol. Chem. 200: 471-478.

35
Kurjan, J., 1985 α-factor structural gene mutations in Saccharomyces cerevisiae: Effects on α-
factor production and mating. Mol. Cell. Biol. 5: 787-796.
Kurjan, J., and I. Herskowitz, 1982 Structure of a yeast pheromone gene (MFα): A putative α-
factor precursor contains four tandem copies of mature α-factor. Cell 30: 933-943.
Lipke, P., D. Wojciechowicz and J. Kurjan, 1989 AGα1 is the structural gene for the
Saccharomyces cerevisiae α-agglutinin, a cell surface glycoprotein involved in cell-cell
interactions during mating. Mol. Cell. Biol. 9: 3155-3165.
MacKay, V. L., S. Welch, M. Y. Insley, T. R. Manney, J. Holly et al, 1988 The Saccharomyces
cerevisiae BAR1 gene encodes an exported protein with homology to pepsin. Proceedings of the
National Academy of Sciences 85: 55-59.
Marcus, S., C. Xue, F. Naider and J. Becker, 1991 Degradation of a-factor by a Saccharomyces
cerevisiae α-mating-type-specific endopeptidase: Evidence for a role in recovery of cells from
G1 arrest. Mol. Cell. Biol. 11: 1030-1039.
McAlister, L., and M. J. Holland, 1985 Differential expression of the three yeast glyceraldehyde-
3-phosphate dehydrogenase genes. J. Biol. Chem. 260: 15019-15027.
McGrath, J. P., and A. Varshavsky, 1989 The yeast STE6 gene encodes a homologue of the
mammalian multidrug resistance P-glycoprotein. Nature 340: 400-404.
Michaelis, S., and I. Herskowitz, 1988 The a-factor pheromone of Saccharomyces cerevisiae is
essential for mating. Mol. Cell. Biol. 8: 1309-1318.

36
Moore, S. A., 1983 Comparison of dose-response curves for α factor-induced cell division arrest,
agglutination, and projection formation of yeast cells. Implication for the mechanism of α factor
action. J. Biol. Chem. 258: 13849-13856.
Peter, M., and I. Herskowitz, 1994 Direct inhibition of the yeast cyclin-dependent kinase Cdc28-
Cln by Far1. Science 265: 1228-1231.
Rappaport, N., and N. Barkai, 2012 Disentangling signaling gradients generated by equivalent
sources. J. Biol. Phys. 38: 267-278.
Reid, B. J., and L. H. Hartwell, 1977 Regulation of mating in the cell cycle of Saccharomyces
cerevisiae. J. Cell Biol. 75: 355-365.
Roberts, C. J., B. Nelson, M. J. Marton, R. Stoughton, M. R. Meyer et al, 2000 Signaling and
circuitry of multiple MAPK pathways revealed by a matrix of global gene expression profiles.
Science Signaling 287: 873-880.
Roth, A. F., B. Nelson, C. Boone and N. G. Davis, 2000 Asg7p-Ste3p inhibition of pheromone
signaling: Regulation of the zygotic transition to vegetative growth. Science Signaling 20: 8815-
8825.
Roy, A., C. Lu, D. Marykwas, P. Lipke and J. Kurjan, 1991 The AGA1 product is involved in
cell surface attachment of the Saccharomyces cerevisiae cell adhesion glycoprotein a-agglutinin.
Mol. Cell. Biol. 11: 4196-4206.
Schaefer, D., P. Côte, M. Whiteway and R. J. Bennett, 2007 Barrier activity in Candida albicans
mediates pheromone degradation and promotes mating. Eukaryotic cell 6: 907-918.

37
Segall, J. E., 1993 Polarization of yeast cells in spatial gradients of α mating factor. Proceedings
of the National Academy of Sciences 90: 8332-8336.
Sherman, F., G. Fink and C. Lawrence, 1974 Methods in Yeast Genetics. Cold Spring Harbor
Laboratory Press, New York.
Singh, A., E. Y. Chen, J. M. Lugovoy, C. N. Chang, R. A. Hitzeman et al, 1983 Saccharomyces
cerevisiae contains two discrete genes coding for the α-factor pheromone. Nucleic Acids Res.
11: 4049-4063.
Sprague Jr, G. F., and I. Herskowitz, 1981 Control of yeast cell type by the mating type locus: I.
identification and control of expression of the a-specific gene BAR1. J. Mol. Biol. 153: 305-321.
Sprague, G. F.,Jr, 1991 Assay of yeast mating reaction. Methods Enzymol. 194: 77-93.
Stanton, B. C., S. S. Giles, M. W. Staudt, E. K. Kruzel and C. M. Hull, 2010 Allelic exchange of
pheromones and their receptors reprograms sexual identity in Cryptococcus neoformans. PLoS
genetics 6: e1000860.
Steden, M., R. Betz and W. Duntze, 1989 Isolation and characterization of Saccharomyces
cerevisiae mutants supersensitive to G1 arrest by the mating hormone a-factor. Molecular and
General Genetics MGG 219: 439-444.
Strathern, J., J. Hicks and I. Herskowitz, 1981 Control of cell type in yeast by the mating type
locus: The α1-α2 hypothesis. J. Mol. Biol. 147: 357-372.

38
Takahashi, S., and P. M. Pryciak, 2008 Membrane localization of scaffold proteins promotes
graded signaling in the yeast MAP kinase cascade. Current Biology 18: 1184-1191.
Trapnell, C., L. Pachter and S. L. Salzberg, 2009 TopHat: Discovering splice junctions with
RNA-seq. Bioinformatics 25: 1105-1111.
Trapnell, C., B. A. Williams, G. Pertea, A. Mortazavi, G. Kwan et al, 2010 Transcript assembly
and quantification by RNA-seq reveals unannotated transcripts and isoform switching during cell
differentiation. Nat. Biotechnol. 28: 511-515.
Trueheart, J., J. D. Boeke and G. R. Fink, 1987 Two genes required for cell fusion during yeast
conjugation: Evidence for a pheromone-induced surface protein. Mol. Cell. Biol. 7: 2316-2328.
Tyers, M., and B. Futcher, 1993 Far1 and Fus3 link the mating pheromone signal transduction
pathway to three G1-phase Cdc28 kinase complexes. Mol. Cell. Biol. 13: 5659-5669.
Wolfe, K. H., and D. C. Shields, 1997 Molecular evidence for an ancient duplication of the entire
yeast genome. Nature 387: 708-712.

39
Figure 1. Yeast cells expressing the pheromone and receptor of the opposite mating type are capable of forming
zygotes with cells of their original mating type. A. MATa cells express the pheromone a-factor, the α-factor
receptor, Ste2, and the α-factor protease, Bar1. MATα cells express the pheromone α-factor and the a-factor
receptor, Ste3. B. MATα-playing-a cells are MATα cells that express a-factor instead of α-factor, Ste2 instead of
Ste3, and the α-factor protease, Bar1. MATa-playing-α cells are MATa cells that express α-factor instead of a-
factor, Ste3 instead of Ste2, and are bar1Δ. C. The indicated diploid strains were grown in YPD, and pictures were
taken using DIC with 20x magnification. The right panel shows abnormal morphologies indicative of cells secreting
pheromones that they can respond to. D. Mating efficiency of the indicated crosses. Mating efficiencies are the
percentage of diploids that form colonies on double dropout plates relative to the number of colonies formed on
single dropout plates. Error bars are standard deviations. Matings were performed as described in Materials and
Methods.
Figure 2. Low mating efficiency of MATa-playing-α cells is due to low α-factor production. A. MATa-playing-α
PFUS1-YFP cells in a mating mixture with MATa PACT1-mCherry cells. Yellow indicates YFP expression. Red indicates
mCherry expression. The orange cell is a diploid expressing both YFP and mCherry. The picture was taken 2.5
hours after mixing the cells using DIC and fluorescence at 20x magnification. B. α-factor production is measured by
growing cells in YPD, harvesting the supernatant, and exposing MATa bar1Δ cells to the supernatant. The
shmooing index of the MATa bar1Δ cells is measured and then compared to a standard curve, produced with
synthetic α-factor, to determine the amount of α-factor present in the media. Error bars are standard deviations.
C. Mating efficiency relative to a wild-type cross between MATa and MATα cells. Matings were performed as
described in Materials and Methods. Error bars are standard deviations.
Figure 3. AFB1 encodes a novel a-factor blocker. A. Halo assays are done by letting cell patches grow on YPD
overnight and then spraying super-sensitive MATα sst2Δ cells over the cell patches. Where a-factor produced by
the cell patches has diffused into the YPD, the MATα sst2Δ cells cannot grow, forming a halo around the cell patch
with a size that corresponds to the amount of a-factor secretion. B. Halo assays done on various cell patches
containing a single cell type. MATa mfa1Δ mfa2Δ is a negative control, and MATa is a positive control. White bars

40
indicate the width of the halo. The halo assays were repeated multiple times, and the rank order of the halo sizes
is consistent. C. Halo assays done on cell patches containing two cell types at a 1:8 ratio of MATa cells to the
experimental cell of interest. White bars indicate the width of the halo. The halo assays were repeated multiple
times, and the rank order of the halo sizes is consistent. D. Sequences were obtained from the Yeast Genome
Order Browser (http://ygob.ucd.ie) and Blast searches of fungal genomes at NCBI. Sequences were aligned in
Jalview using the MAFFT-L-INS-I option, and the aligned core that follows the signal sequence and precedes the GPI
anchorage sequence is shown. Amino acids are colored with a scheme that represents chemically similar amino
acids in similar colors, and universally conserved amino acids are highlighted in red in the consensus sequence.
Full species names: Saccharomyces cerevisiae, Saccharomyces mikatae, Saccharomyces kudriavzevii,
Saccharomyces bayanus, Candida glabrata, Kazachstania africanus, Kazachstania naganishii, Naumovzyma castelli,
Naumovzyma dairenensis, Tetraspora blattae, Tetraspora phaffi, Vanderwaltomyzoa polyspora,
Zygosaccharomyces rouxii, Torulaspora delbruckii, Kluveromyces lactis, Saccharomyces kluyveri, Eremothecium
cymbalariae, and Hansenula/Ogataea polymorpha. Of these, Z. rouxii, T. delbrueckii, K. lactis, S. kluyveri, E.
cymbalariae, and H. polymorpha did not undergo a whole genome duplication. E. Mating efficiency of the
indicated crosses relative to a wild-type cross between MATa and MATα cells. Matings were performed as
described in Materials and Methods. Error bars are standard deviations.
Figure 4. MATα-playing-a cells shmoo but arrest transiently in the presence of pheromone. A. Shmooing indices
of MATa bar1Δ cells and MATα-playing-a PBAR1-BAR1 cells exposed to known concentrations of α-factor. Error bars
are standard deviations. B. Shmooing indices of MATa cells and MATα-playing-a PFUS1*-BAR1 cells exposed to
known concentrations of α-factor. Error bars are standard deviations. C. Mating efficiency relative to a wild-type
cross between MATa and MATα cells. Matings were performed as described in Materials and Methods. Error
bars are standard deviations. D. MATa bar1Δ cells shmooing and MATα-playing-a bar1Δ cells shmooing and
budding when incubated with SC plus 10nM α-factor in a microfluidic chamber. Pictures were taken using DIC with
60x magnification 8 hours after the addition of α-factor. White arrows point to buds.

41
Figure 5. Mating is not robust to changes in pheromone production. Mating efficiency relative to a wild-type
cross between MATa and MATα cells. Matings were performed as described in Materials and Methods. Note the
logarithmic scale for mating efficiency. Error bars are standard deviations.

42
Fig
ure
1

43
Figure 2

44
Figure 3

45
Fig
ure
4

46
Figure 5