1 GENDER EQUALITY IN SECONDARY AND TERTIARY EDUCATION: WHAT’S HAPPENING TO OUR GIRLS? The...
29
1 GENDER EQUALITY IN SECONDARY AND TERTIARY EDUCATION: WHAT’S HAPPENING TO OUR GIRLS? The Experience of Rwanda Dr Shirley Randell AM
-
Upload
rudy-brach -
Category
Documents
-
view
213 -
download
0
Transcript of 1 GENDER EQUALITY IN SECONDARY AND TERTIARY EDUCATION: WHAT’S HAPPENING TO OUR GIRLS? The...

1
GENDER EQUALITY IN SECONDARY AND TERTIARY EDUCATION:
WHAT’S HAPPENING TO OUR GIRLS?
The Experience of Rwanda
Dr Shirley Randell AM

2
Primary Net Enrollment Rates, Rwanda, 1998/99 to 2005
0
20
40
60
80
100
1998
/99
2000
/01
2002
/03
2005
Goal-2
008
NERGirls
NERBoys
Primary net enrollment rates increasing
School fees abolished in 2003
Girls outnumber boys in enrolments at primary level
On path to realize universal primary enrollment (UPE) by 2015
Source: NEPAD Secretariat and UNIFEM Rwanda. Independent Review Report on the Progress and Prospects of Gender Mainstreaming in Rwanda, 2000-2005, May 2006.; FAWE website; MINEDUC, Education Sector Strategic Plan, 2003.

3
Girls’ Net Enrollment Rates as a Percentage of Boys, Rwanda, 2005
102.7
85.5
67.7
0 20 40 60 80 100 120
HigherEducation
Secondary
Primary
Gender disparities in enrollments begin to emerge at secondary level
By university, only 4 out of 10 students are girls
These disparities become even more apparent if we look at the types of schools attended
Source: FAWE website
4
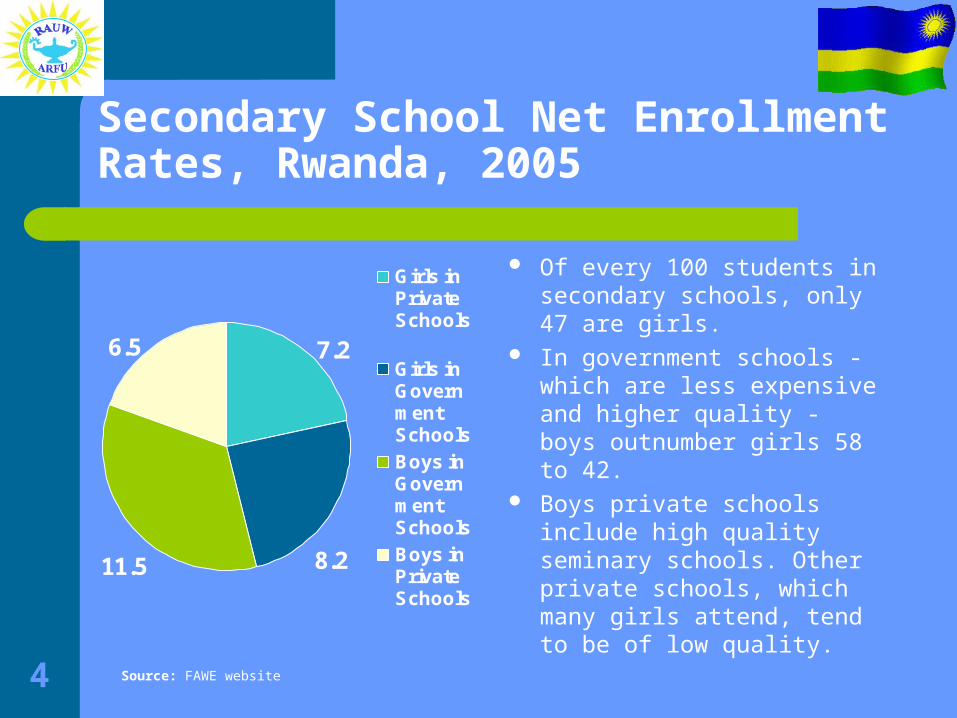
Secondary School Net Enrollment Rates, Rwanda, 2005
11.5
6.5 7.2
8.2
Girls inPrivateSchools
Girls inGovernmentSchools
Boys inGovernmentSchools
Boys inPrivateSchools
Of every 100 students in secondary schools, only 47 are girls.
In government schools -which are less expensive and higher quality - boys outnumber girls 58 to 42.
Boys private schools include high quality seminary schools. Other private schools, which many girls attend, tend to be of low quality.Source: FAWE website

5
Total Enrollment in Higher Education Institution, by Gender, Rwanda, 2005
0
2000
4000
6000
8000
10000
12000
14000
16000
18000
2001
Boys
2001
Girls
2002
Boys
2002
Girls
2003
Boys
2003
Girls
2004
Boys
2004
Girls
2005
Boys
2005
Girls
Public Univ. Private Univ.
Though total enrollment in primary, secondary and tertiary continues to grow, girls comprise only 40 percent of university students.
The disparity is more stark within public universities: girls make up only 27.2% of students in 2005.
Source: NEPAD Secretariat and UNIFEM Rwanda. Independent Review Report on the Progress
and Prospects of Gender Mainstreaming in Rwanda, 2000-2005, May 2006.

6
So what is happening to
Female Students in Rwanda?

7
Social and Institutional Barriers to Girls’ Education
Direct DiscriminationIndirect DiscriminationIn-school factorsOut-of-school factors

8
Social and Institutional Barriers to Girls’ Education (cont)
Historically marginalizedTraditional gender rolesLack of adequate facilitiesGender-biased curriculum, classrooms,
assessmentLack of female teacher role models Insecurity in schools – gender-based
violence

9
Social and Institutional Barriers to Girls’ Education (cont)
Low performance on examinationsGender discrimination in
admissionsPrioritization of mathematics and
sciencesPoverty

10
Historical Marginalization
Under the colonial regime, girls’ schools were introduced a full 40 years after boys’.
Curriculum has been designed to reinforce girls’ socialized roles, such as hygiene, secretarial skills, and home economics.
Positive attitudes towards girls’ education are slow to evolve.

11
Traditional Gender Roles
Especially in rural areas, girls continue to be responsible for a range of household tasks, such as fetching water, gathering firewood, and cooking.
Girls are also often tasked with caring for younger siblings or aged and sick relatives, especially those suffering from HIV/Aids.
These tasks may prevent girls from attending school, or limit the time they can devote to their studies.

12
Lack of Adequate Facilities
Many schools lack separate toilet and dormitory facilities for boys and girls.
This, together with poverty and the lack of access to sanitary pads, may cause adolescent girls to stay home during their monthly periods.
The resulting higher rates of absenteeism affect learning and performance on examinations.

13
Gender Biased Curriculum
Masculinity in the curriculum, classroom, and in assessment methods are a major barrier to girls’ education.
There is a need for student-centred teaching, a gender equitable learning environment, and curriculums that are relevant to girls.
The lack of female teachers, particularly in math and science courses, is a further impediment to girls.

14
Insecurity in Schools
Girls who encounter harassment, intimidation or violence in their school environments may be afraid to attend school.
School environments where teachers and students are heavily male dominated are easy places for girls to encounter violence.
Girls who are abused in their homes or communities experience trauma, decreasing their performance at school.
15
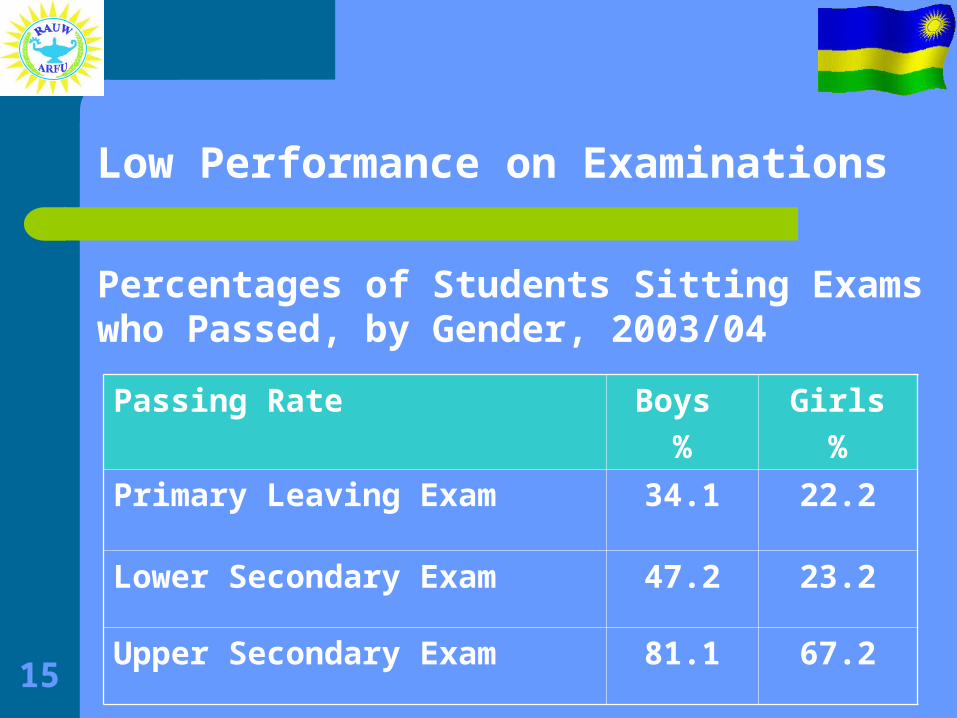
Low Performance on Examinations
Passing Rate Boys
%
Girls
%
Primary Leaving Exam 34.1 22.2
Lower Secondary Exam 47.2 23.2
Upper Secondary Exam 81.1 67.2
Percentages of Students Sitting Exams who Passed, by Gender, 2003/04

16
Low Performance on Examinations (cont)
Gender Distribution of Students who Passed Examinations
Year
Primary Leaving
Lower Secondary
Upper Secondary
Boys %
Girls %
Boys %
Girls %
Boys
%
Girls
%
2002/
2003
58 42 66 34 52 48
2004/
2005
61 39 66 34 59 41

17
Low Performance on Examinations (cont)
Boys consistently out-perform girls on national examinations at all levels. For the year 2004/05, boys comprised almost two-thirds of students who passed exams at all levels.
Social factors, such as gender roles and high rates of absenteeism, entrench girls’ low performance throughout their schooling.
This has a cyclical effect, as girls are admitted to lower quality secondary schools, perform worse on secondary school exams, and ultimately are admitted in lower numbers, and to lower quality, universities.

18
Gender Discrimination in Admissions (cont)
In addition to lower performance on examinations, gender discrimination is obvious in the admissions practices of government universities.
Girls who pass their examinations are being excluded in greater numbers from public universities than their male counterparts.
Scholarships are awarded for high marks in science and technology.

19
Gender Discrimination in Admissions (cont)
In 2003/04, of every 100 students who passed their exams, 48 were women and 52 men.
19.1% of those who passed were admitted to government universities.
8.18% of girls who passed were admitted, while 15.16% of boys were admitted.
For every 100 girls who passed, 8 were offered admission; for every 100 boys, 15 were given a place.
Boys Girls Margin
Students who Passed, per 100
52 48 4%
Students Admitted, per 100
15 8 7%
Gender Bias is Obvious in this Example!

20
Gender Discrimination in Admissions (cont)
In 2004/05, 59% of those who passed their exams were boys, 41% girls, a margin of 18%.
Men constituted 72% of those who enrolled in public universities, but women only 28%
In numeric terms, 10,671 boys and 7,424 girls passed their exams.
9,657 men and 3,621 women enrolled in public universities.
Men Women
% Passed Exams
59 41
% Enrolled in Uni.
72 28
Number passed 10,671 7,424Number enrolled
9,657 3,621
Girls’ enrollment rates in public universities is not proportionate to the number passing their exams!!

21
Prioritization of Maths and Sciences
Vision 2020, the Government of Rwanda’s plan for development and poverty eradication, is focused on developing the Information and Communication Technologies (ICT) sector.
The educational system must develop a skilled labor force to drive the development of this sector.
Statistically, boys are more likely to pursue science and technology subjects both in secondary school and at university.
Admission to science and technology courses at public universities, and coveted government scholarships in these fields, more commonly go to men.

22
Prioritization of Maths and Sciences (cont)
0% 20% 40% 60% 80% 100%
All Science and Maths
Mechanics & Automotives
Electricity
Biology & Chemistry
Mathematics & Physics
Girls (%) Boys (%)
Gender Distribution of Students in Science and Maths Courses, Rwanda, 2005
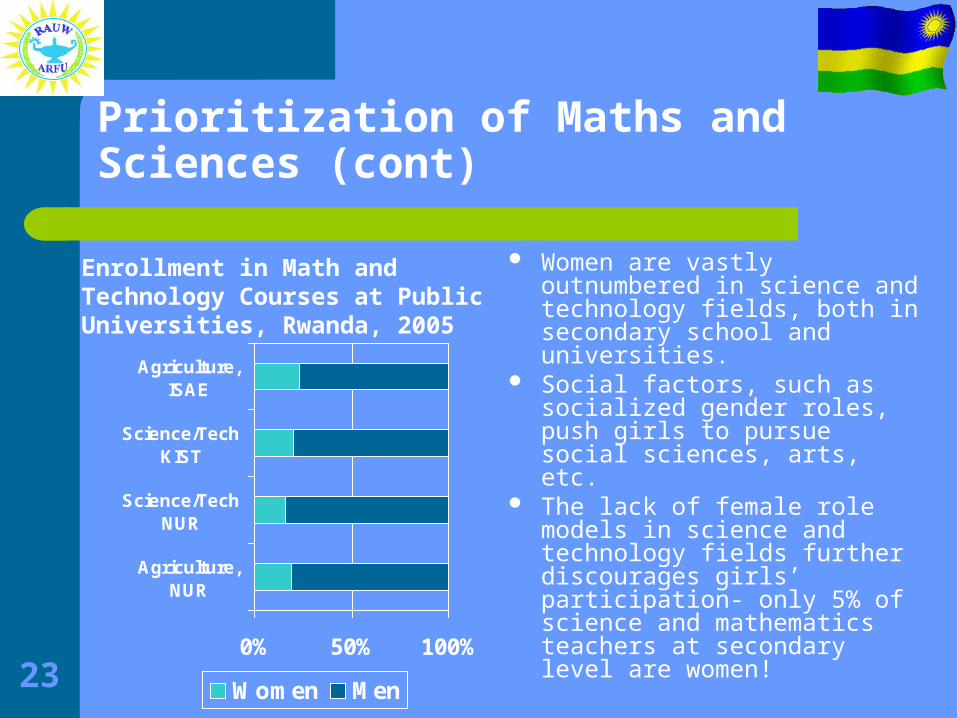
23
Prioritization of Maths and Sciences (cont)
0% 50% 100%
Agriculture,NUR
Science/TechNUR
Science/TechKIST
Agriculture,ISAE
Women Men
Women are vastly outnumbered in science and technology fields, both in secondary school and universities.
Social factors, such as socialized gender roles, push girls to pursue social sciences, arts, etc.
The lack of female role models in science and technology fields further discourages girls’ participation- only 5% of science and mathematics teachers at secondary level are women!
Enrollment in Math and Technology Courses at Public Universities, Rwanda, 2005

24
Women’s Empowerment Programmes- The KIST Example
In 2006, KIST introduced an affirmative action programme for 200 women who narrowly failed their exams.
Though fraught with problems and resistance, 93 students passed, and were enrolled in 2007.
These students contributed to gender parity in several courses, particularly sciences. Girls continue to lag in engineering courses.
% Women Before EP
% Women After
% Change due to EP
Biology 29.6 47.9 18.3
Chemistry
29.7 46.4 16.7
Mathematics
34.4 40.8 6.4
Physics 21.9 29.6 7.7
Comp. Eng.
20.9 23.6 2.7

25
Poverty
With the elimination of primary school fees in 2003, enrollment rates increased substantially.
Nonetheless, in a 2005 citizen report card survey, 42% of households reported that the costs associated with education, such as books, uniforms, and lunches, were a substantial barrier to their children’s educations.
Poverty remains a significant barrier to education for particular disadvantaged groups, such as orphan headed households, street children and rural children.
Poverty is even more of a barrier at the secondary and tertiary levels.

26
Low Completion Rates
Although Rwanda should be commended for its success in increasing primary enrollment rates, completion rates remain far below the average for Sub-Saharan Africa.
2005 Primary Completion Rate
2008 Goal (Ed. Sector Strategic Plan)
Average Completion Rate for SSA
>50% 72% 61%
•According to the recent Core Welfare Indicators Questionnaire, 35% of families withdraw their children due to the high costs associated with primary education, such as books and uniforms.
•An additional 30% cite failure on the primary school leaving exam as the reason their children drop out.

27
Conclusions
Rwanda’s success in increasing primary and secondary enrollment is largely due to a strong policy environment, well-budgeted objectives and firm development goals.
Achieving gender parity in education is a focal point of these policies. Rwanda has seen tremendous success at the primary school level.
Nevertheless, more needs to be done to promote gender equality at the secondary and tertiary levels, and to improve the performance indicators of girl students at all levels.

28
Recommendations
Put in place affirmative action measures, particularly at the university level, and to promote women’s involvement in mathematics and science courses.
Make good on budgetary commitments to address the sources of girls’ absenteeism, such as inadequate facilities.
Ensure that gender equality commitments are upheld at the local level, within schools and at the local district levels.

29
Recommendations (cont)
Place particular attention on developing girls’ interest in mathematics and sciences at the primary and secondary levels. The example of FAWE girls’ school can serve as a model.
Design measures to improve girls’ retention rates and to lift girls’ performance on examinations.