1 FUNDING COMMITTEE REPORT: REVENUE SOURCES Dennis B. Martinez, Committee Chair Library District...
32
1 FUNDING COMMITTEE REPORT: REVENUE SOURCES Dennis B. Martinez, Committee Chair Library District Commission Meeting February 9, 2007 Updated 02-12-2007
-
Upload
chester-york -
Category
Documents
-
view
215 -
download
2
Transcript of 1 FUNDING COMMITTEE REPORT: REVENUE SOURCES Dennis B. Martinez, Committee Chair Library District...

1
FUNDING COMMITTEE REPORT:REVENUE SOURCES
Dennis B. Martinez, Committee ChairLibrary District Commission Meeting
February 9, 2007
Updated 02-12-2007
2
Makeup of Finance Workgroup
• Library District Commissioners (4)
• Library Staff
• Budget Department
• Finance Department
• Legal Department
• Office of the City Manager
3
Resources
• Bexar County
• Bexar County Appraisal District
• State Comptroller

4
Purpose of Presentation
• SAPL Bench Marks
• Funding Case Studies
• Recap
• Possible Local Sources of Revenue
• Funding Scenarios

5
$0.00 $20.00 $40.00 $60.00 $80.00 $100.00 $120.00 $140.00
Toronto PublicTampa-Hillsborough Co.
St. Louis PublicSt. Louis County Lib. Dist.
Seattle PublicSan Jose City
San Francisco PublicSan Diego Public
San Diego CountySalt Lake County
Salt Lake City PublicSacramento
Phoenix Public (Maricopa)Philadelphia Free
Orange CountyOakland Public
NY PublicMultnomah CountyMinneapolis Public
Milwaukee PublicMiami-Dade Public
LA Public CountyLA Public
King CountyKansas City Public
JacksonvilleIndianapolis-Marion County
Houston PublicHarris County
Fort WorthEnoch Pratt (Baltimore)
El PasoDetroit Public
DenverDallas Public
Corpus ChristiCleveland Public
Cinncinati & Hamilton CoChicago Public
Charlotte & MecklenbergCarnegie of Pittsburgh
Boston PublicBaltimore County
Austin
Per Capita Operating Expenditures 2005San Antonio Public Library spends $13.33 per capita on operations.
The median of these libraries is $35.48.
$13.33
*Source: PLDS Statistical Report 2005

6
Texas Libraries ComparisonPLDS Statistical Report - 2006
*Source: PLDS Statistical Report 2005
Service Population
Items per Capita
Number of Libraries
Population per Library location
Door Count per Capita
Operating Expenditures
Operating Expenditures per Capita
San Antonio
1,575,300 1.3 23 68,491 2.5 $21,006,449 13.33
Austin 687,061 2.4 22 31,230 4.6 $17,232,123 25.08
Dallas 1,224,000 3.4 24 51,000 3.8* $25,691,979 20.99
El Paso 563,662 1.7 12 46,972 3.1 $6,907,232 12.25
Fort Worth* 534,694 2.16 15 35,646 4.8 $13,899,156 25.99
Houston 2,060,555 2.0 38 54,225 2.1 $34,677,745 16.83

7
FUNDING CASE STUDIES
San Francisco Public Library
Las Vegas/Clark County Library District
King County Library System
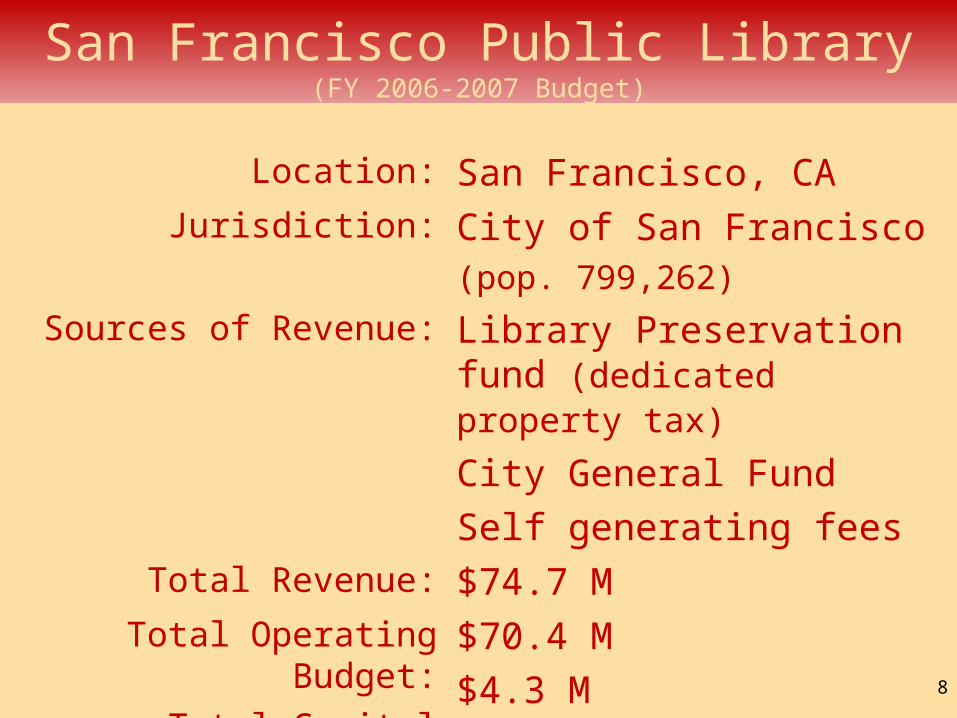
8
San Francisco Public Library(FY 2006-2007 Budget)
Location: San Francisco, CAJurisdiction: City of San Francisco
(pop. 799,262)
Sources of Revenue: Library Preservation fund (dedicated property tax) City General FundSelf generating fees
Total Revenue: $74.7 MTotal Operating Budget:
Total Capital Budget:$70.4 M$4.3 M

9
Las Vegas-Clark County Library District
(FY 2006-2007 Budget)
Location: Las Vegas, NVJurisdiction: City of Las Vegas & Clark
County (pop. 1,400,000)Sources of Revenue: Property tax
Consolidated sales taxFees & fines
Total Revenue: $66.7 MTotal Operating Budget:
Total Capital Budget:$51.9 M$14.3 M
10
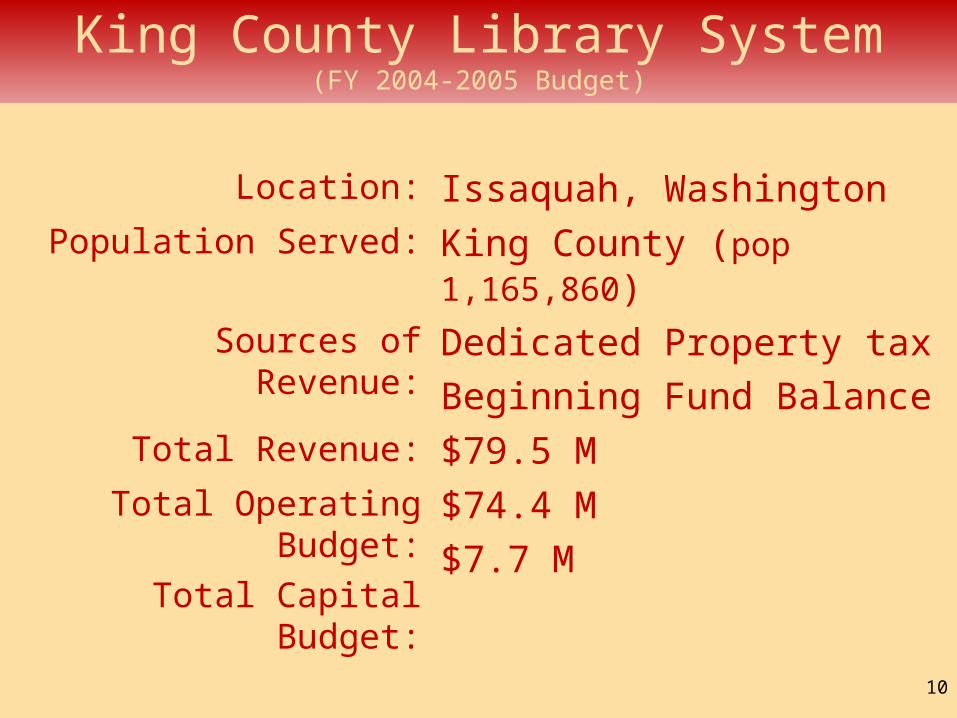
King County Library System(FY 2004-2005 Budget)
Location: Issaquah, WashingtonPopulation Served: King County (pop
1,165,860)Sources of Revenue: Dedicated Property tax
Beginning Fund BalanceTotal Revenue: $79.5 MTotal Operating
Budget:Total Capital Budget:
$74.4 M$7.7 M

11
RECAP

12
How do we
get there?
Increase and stabilize public
funding
Seek new sources of
sustainable funding
Increase and stabilize public
funding
Seek new sources of
sustainable funding

13
Public Funding
Opportunities
Sales tax
Property tax
Impact fees
Unanticipated revenue
enhancements from city-
owned utilities
State funding
Federal funding
Library Authority/District
Sales tax
Property tax
Impact fees
Unanticipated revenue
enhancements from city-
owned utilities
State funding
Federal funding
Library Authority/District

14
What now?
Develop creative
and sustainable
funding mechanisms
to respond to the
needs of the new
century library
Develop creative
and sustainable
funding mechanisms
to respond to the
needs of the new
century library

15
LOCAL SOURCES OF REVENUE AND TRENDS
Possible Under Current PolicyProperty TaxSales and Use Tax Fees and Fines
Possible With Policy ChangeCPS Energy RevenueSAWS Revenue

16
COSA Property Tax Trends
5 Year History-CoSA Property Tax Collection-$ in millions-
137.3146.9
159.9 167.2
178.4
100.0
150.0
200.0
250.0
FY 2002 FY 2003 FY 2004 FY 2005 FY 2006
History (4% to 8% growth)
Projection (3% to 4% growth)5 Year Projection-CoSA Property Tax Collection
-$ in millions-
191.0 198.8 205.5 212.4 219.8
100.0
150.0
200.0
250.0
FY 2007 FY 2008 FY 2009 FY 2010 FY 2011

17
COSA Sales and Use Tax TrendsHistory (2% to 9% growth)
Projection (4% to 5% growth)
5 Year History- General Fund Sales Tax Revenue-$ in Millions-
173.43163.01148.49138.96140.08136.81
$100.00
$125.00
$150.00
$175.00
$200.00
FY 2001 FY 2002 FY 2003 FY 2004 FY 2005 FY 2006 (re-estimate)
5 Year Projection- General Fund Sales Tax Revenue -$ in Millions-
$100.00
$125.00
$150.00
$175.00
$200.00
$225.00
FY 2007 FY 2008 FY 2009 FY 2010 FY 2011
18
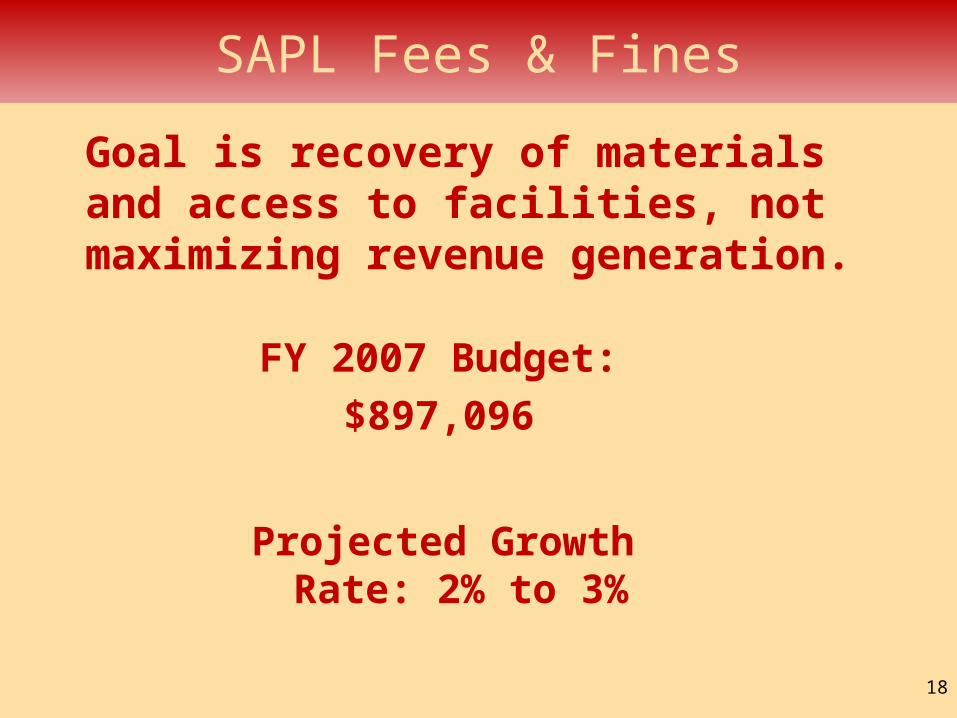
SAPL Fees & Fines
Goal is recovery of materials and access to facilities, not maximizing revenue generation.
Projected Growth Rate: 2% to 3%
FY 2007 Budget:$897,096
19
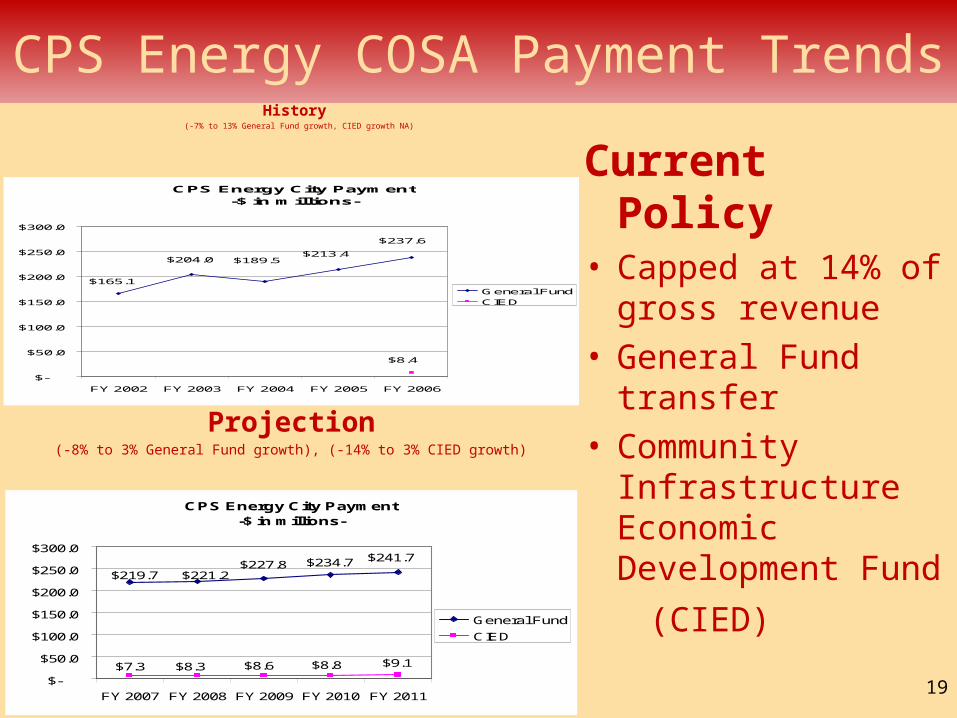
CPS Energy COSA Payment Trends
Current Policy• Capped at 14% of
gross revenue• General Fund
transfer• Community
Infrastructure Economic Development Fund
(CIED)
History (-7% to 13% General Fund growth, CIED growth NA)
CPS Energy City Payment-$ in millions-
$165.1
$204.0 $189.5$213.4
$237.6
$8.4
$-
$50.0
$100.0
$150.0
$200.0
$250.0
$300.0
FY 2002 FY 2003 FY 2004 FY 2005 FY 2006
General Fund
CIED
CPS Energy City Payment-$ in millions-
$219.7 $221.2$227.8 $234.7 $241.7
$7.3 $8.3 $8.6 $8.8 $9.1
$-
$50.0
$100.0
$150.0
$200.0
$250.0
$300.0
FY 2007 FY 2008 FY 2009 FY 2010 FY 2011
General Fund
CIED
Projection(-8% to 3% General Fund growth), (-14% to 3% CIED growth)

20
CPS Energy Revenue
CIED Fund Projects Include:• Health Research at UTHSC & electrical
infrastructure for growth at UTSA main campus ($3.6M).
• Westover Valley construction of underground electrical supply lines ($1.3M).
CIED Criteria:• Positive cost-benefit analysis• Non General Fund purpose• Infrastructure or economic development
project

21
SAWS COSA Payment Trends
Current Policy(capped at 5% of gross
revenue)
• General Fund transfer
Capacity• Transfer of 2.7%
has been made each year since 1992
History (1% to 25% growth)
Projection (-5% to 2% growth)5 Year History- SAWS City Payment
-$ in Millions-
9.868.529.589.309.03
$0.0
$2.0
$4.0
$6.0
$8.0
$10.0
FY 2007 FY 2008 FY 2009 FY 2010 FY 2011
5 Year History- SAWS City Payment-$ in Millions-
10.308.36.96.36.375.53
$0.0$2.0$4.0$6.0$8.0
$10.0$12.0
FY 2001 FY 2002 FY 2003 FY 2004 FY 2005 FY 2006(Estimate)
22
FUNDING SCENARIOS

23
AssumptionsExample scenarios are presented to stimulate discussion and are not all inclusive. A comprehensive expenditure budget will be presented next month.
Sales Tax (2006 Tax Year)
• Source: Texas Comptroller web site.
• Does not include unincorporated Bexar.
Property Tax (2007 Taxable Value)
• Source: Bexar County Appraisal District.
• Includes all of Bexar County.
• Net of tax assessor/collector fees and 97.5% collection rate.
• Assumes mandatory exemptions.

24
SCENARIO 1
Property Tax per $100 valuation
Operating 4 cent
Capital ½ cent
Revenue Generated
$33,155,410
SAPL’s Current General Fund Budget $24,900,000
$40,076,528
Fees and Fines $897,096
$3,524,022
$2,500,000
Maintenance Fund (CIED/SAWS)

25
SCENARIO 2
Sales Tax (1/8 cent)
Revenue Generated
$20,956,523
SAPL’s Current General Fund Budget $24,900,000
Fees and Fines $ 897,096
General Fund (Personnel)
$17,186,096
$2,500,000Maintenance Fund (CIED/SAWS)
$41,539,715

26
SCENARIO 3
Sales Tax (1/8 cent)
Property Tax per $100 valuation
Operating 2 cent
Capital ½ cent
Revenue Generated
$20,956,523
$16,223,188
SAPL’s Current General Fund Budget $24,900,000
$44,100,829
Fees and Fines $ 897,096
$ 3,524,022
$ 2,500,000Maintenance Fund (CIED/SAWS)

27
SCENARIO 4
Sales Tax (1/8 cent total)
Operating Share of Sales Tax 60%
Maintenance/Capital Share of Sales Tax 40%
Revenue Generated
$12,573,913
SAPL’s Current General Fund Budget $24,900,000
$49,853,618
Fees and Fines $897,096
$8,382,609
$22,000,000
COSA General Fund
Bexar County General Fund $6,000,000

28
SCENARIO 5
Sales Tax (1/8 cent)Property Tax per $100 valuation
Operating 2 cent
Capital ½ cent
Revenue Generated
$20,956,523
$16,223,188
SAPL’s Current General Fund Budget $24,900,000
$61,286,925
Fees and Fines $897,096
$3,524,022
General Fund (Personnel)
$17,186,096$2,500,000
Maintenance Fund (CIED/SAWS)

29
$0.00 $20.00 $40.00 $60.00 $80.00 $100.00 $120.00 $140.00
Toronto PublicTampa-Hillsborough Co.
St. Louis PublicSt. Louis County Lib. Dist.
Seattle PublicSan Jose City
San Francisco PublicSan Diego Public
San Diego CountySalt Lake County
Salt Lake City PublicSacramento
Phoenix Public (Maricopa)Philadelphia Free
Orange CountyOakland Public
NY PublicMultnomah CountyMinneapolis Public
Milwaukee PublicMiami-Dade Public
LA Public CountyLA Public
King CountyKansas City Public
JacksonvilleIndianapolis-Marion County
Houston PublicHarris County
Fort WorthEnoch Pratt (Baltimore)
El PasoDetroit Public
DenverDallas Public
Corpus ChristiCleveland Public
Cinncinati & Hamilton CoChicago Public
Charlotte & MecklenbergCarnegie of Pittsburgh
Boston PublicBaltimore County
Austin
Per Capita Operating Expenditures 2005San Antonio Public Library spends $13.33 per capita on operations.
The median of these libraries is $35.48.
$13.33
*Source: PLDS Statistical Report 2005
S1: $23.20
S4: $28.47
S5: $36.67
S2: $26.37
S3: $25.76

30
$0.00 $20.00 $40.00 $60.00 $80.00 $100.00 $120.00 $140.00
Toronto PublicTampa-Hillsborough Co.
St. Louis PublicSt. Louis County Lib. Dist.
Seattle PublicSan Jose City
San Francisco PublicSan Diego Public
San Diego CountySalt Lake County
Salt Lake City PublicSacramento
Phoenix Public (Maricopa)Philadelphia Free
Orange CountyOakland Public
NY PublicMultnomah CountyMinneapolis Public
Milwaukee PublicMiami-Dade Public
LA Public CountyLA Public
King CountyKansas City Public
JacksonvilleIndianapolis-Marion County
Houston PublicHarris County
Fort WorthEnoch Pratt (Baltimore)
El PasoDetroit Public
DenverDallas Public
Corpus ChristiCleveland Public
Cinncinati & Hamilton CoChicago Public
Charlotte & MecklenbergCarnegie of Pittsburgh
Boston PublicBaltimore County
Austin
Per Capita Operating Expenditures 2005San Antonio Public Library spends $13.33 per capita on operations.
The median of these libraries is $35.48.
$13.33
*Source: PLDS Statistical Report 2005
S1: $23.20
S4: $28.47
S5: $36.67
S2: $26.37
S3: $25.76

31
The
Library:
A Powerful
Tool
for
Economic
Developm
ent
Educational Opportunities
Skilled Workforce
Higher Literacy LevelsIncreased
Economic Growth

32
"He who cannot change the very fabric of his thought will never
be able to change reality."– Anwar al-Sadat