Tony Monteiro, AA2TX VP, Engineering AMSAT Forum Dayton Hamvention 2011 AMSAT FOX.
Upload
ashlyn-wilsonCategory
view
232download
0
1
Fully Digital HF Radios
Phil Harman VK6APH
Dayton Hamvention – 17th May 2008
2
Overview
• Software Defined Radios are now providing performance equal to the best Analogue designs
• There’s is a new trend in HF SDR radios that eliminates most of the Analogue components.
• In effect the antenna is connected directly to an Analogue to Digital Converter (ADC).
• So how does this next generation of SDRs work? • How well do they work?
3
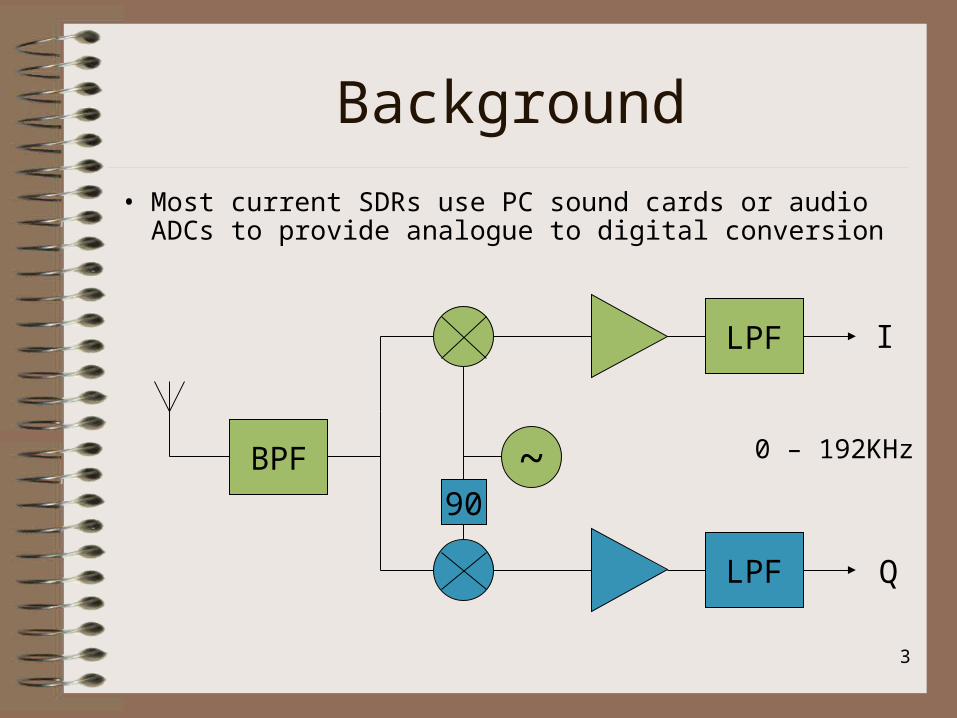
Background
• Most current SDRs use PC sound cards or audio ADCs to provide analogue to digital conversion
BPF ~90
LPF
LPF
0 – 192KHz
I
Q
4
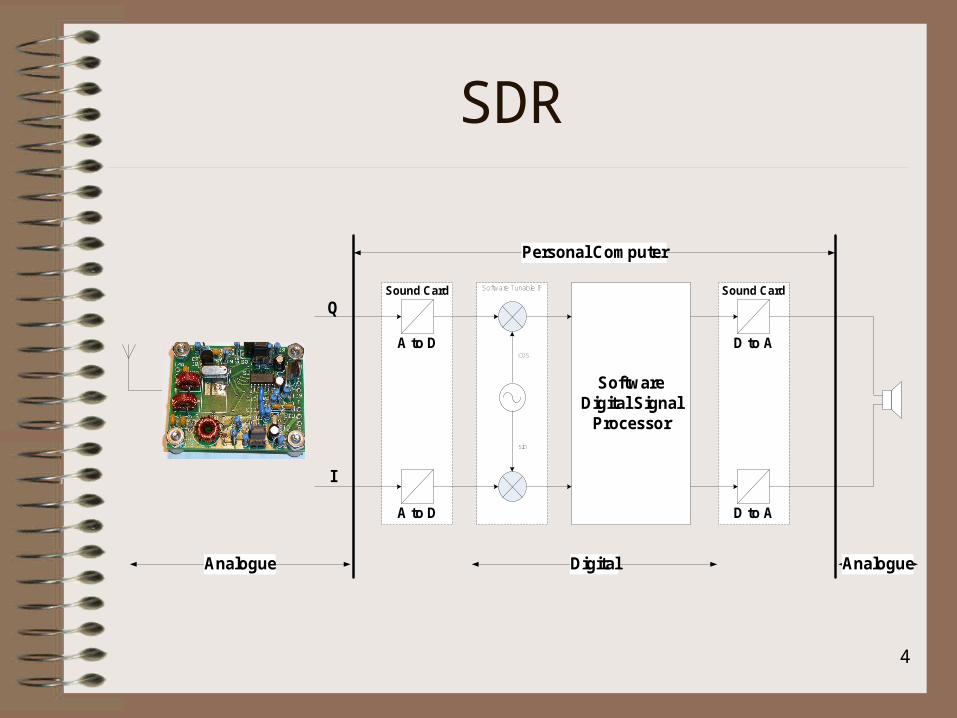
SDR
Software Tunable IFSound Card
A to D
A to D
sin
cos
SoftwareDigital Signal
Processor
Sound Card
D to A
D to A
Digital AnalogueAnalogue
Personal Computer
I
Q

5
Performance
• Bandscope width restricted to sound card sampling rate e.g. max of 192KHz
• Image response– e.g. Receiver tuned to 14.100kHz, with 10kHz
IF, then image will be at 14.080kHz
6
Performance
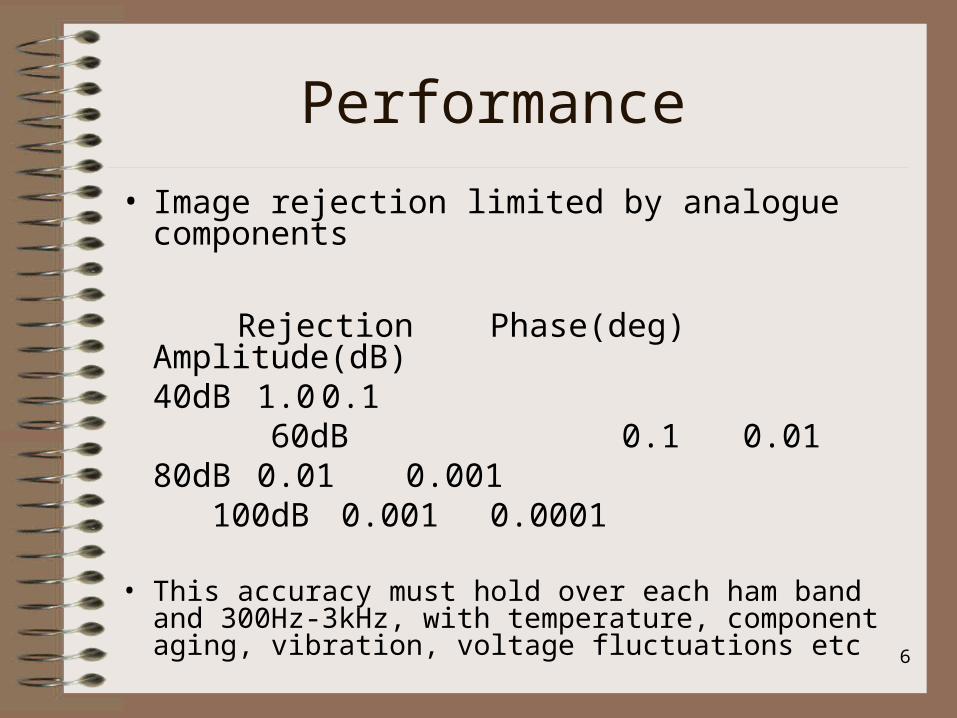
• Image rejection limited by analogue components
Rejection Phase(deg) Amplitude(dB) 40dB 1.0 0.1
60dB 0.1 0.0180dB 0.01 0.001
100dB 0.001 0.0001
• This accuracy must hold over each ham band and 300Hz-3kHz, with temperature, component aging, vibration, voltage fluctuations etc
7
Performance
• We can compensate digitally for consistent phase and amplitude errors
• Automatically and manually
8
I & Q Error Correction
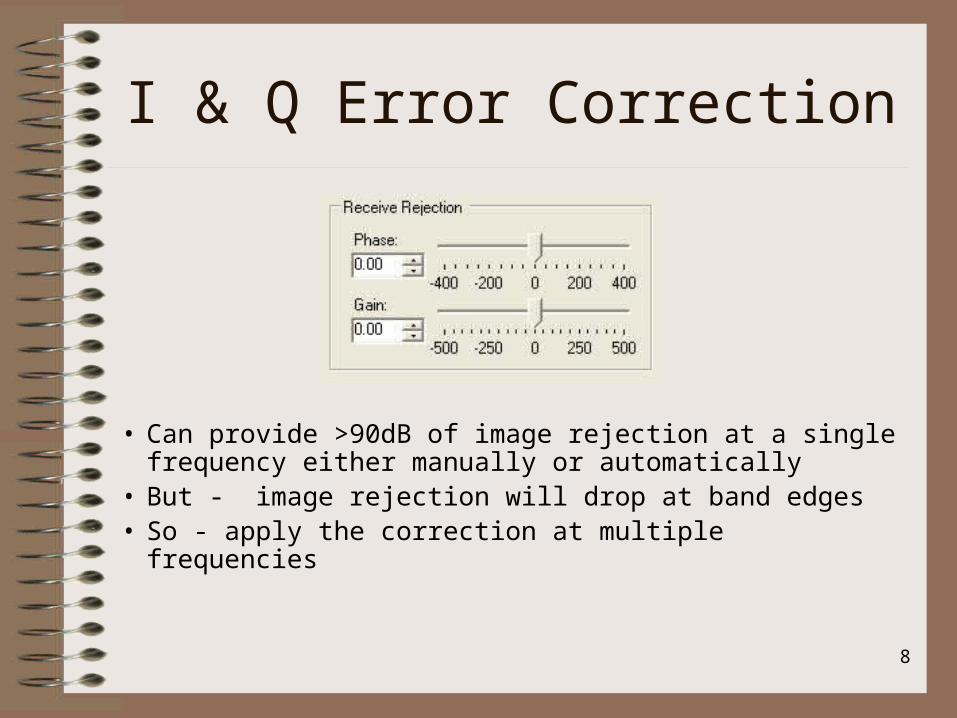
• Can provide >90dB of image rejection at a single frequency either manually or automatically
• But - image rejection will drop at band edges• So - apply the correction at multiple frequencies
9
I & Q Error Correction
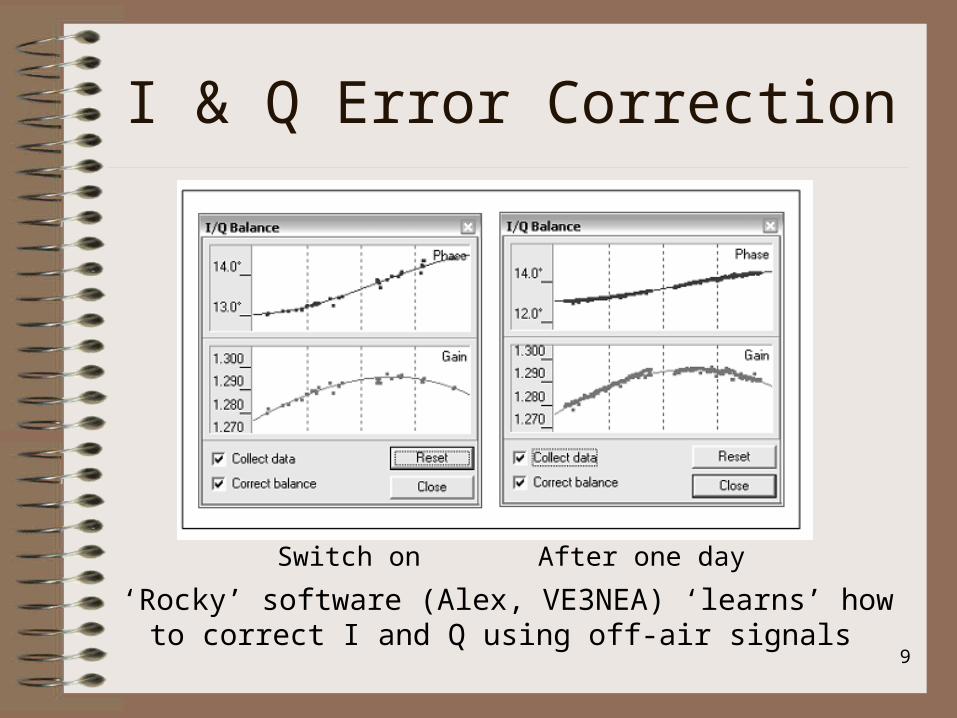
‘Rocky’ software (Alex, VE3NEA) ‘learns’ how to correct I and Q using off-air signals
Switch on After one day

10
I & Q Error Correction
• Not the full solution since:– We need enough, strong signals, for the calibration to
work
– The calibration will change with SWR, temperature etc
– Needs doing on each band
– It’s time consuming
• This doesn’t mean it not a solvable problem – some really smart people are working on it!
11
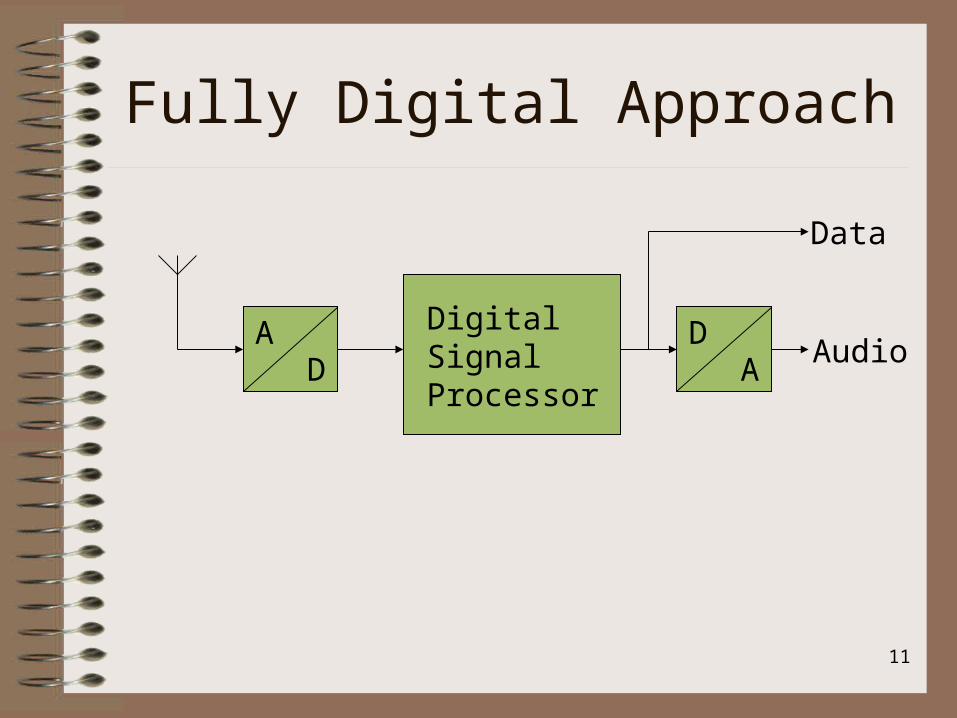
Fully Digital Approach
AD A
DDigital Signal Processor
Data
Audio
12
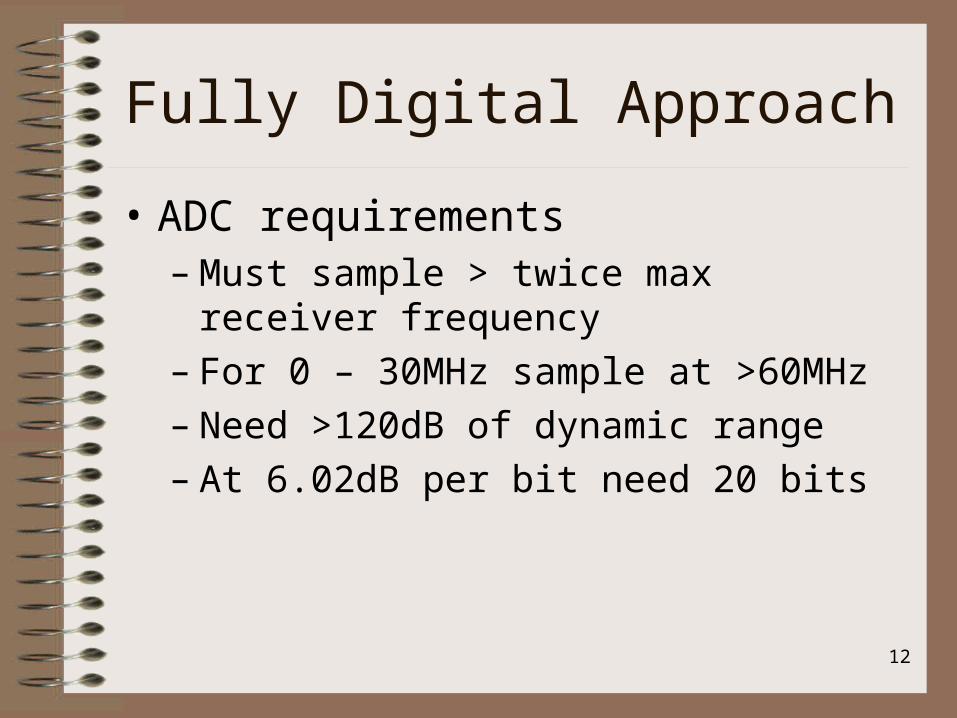
Fully Digital Approach
• ADC requirements– Must sample > twice max receiver frequency– For 0 – 30MHz sample at >60MHz– Need >120dB of dynamic range– At 6.02dB per bit need 20 bits

13
Fully Digital Approach
• ADC – how much can we afford?
• For $100– Linear Technology - LT2208– Sample rate – 130Msps– Input bandwidth – 700MHz– Bits – 16– Wide band noise floor - 78dBFS
14
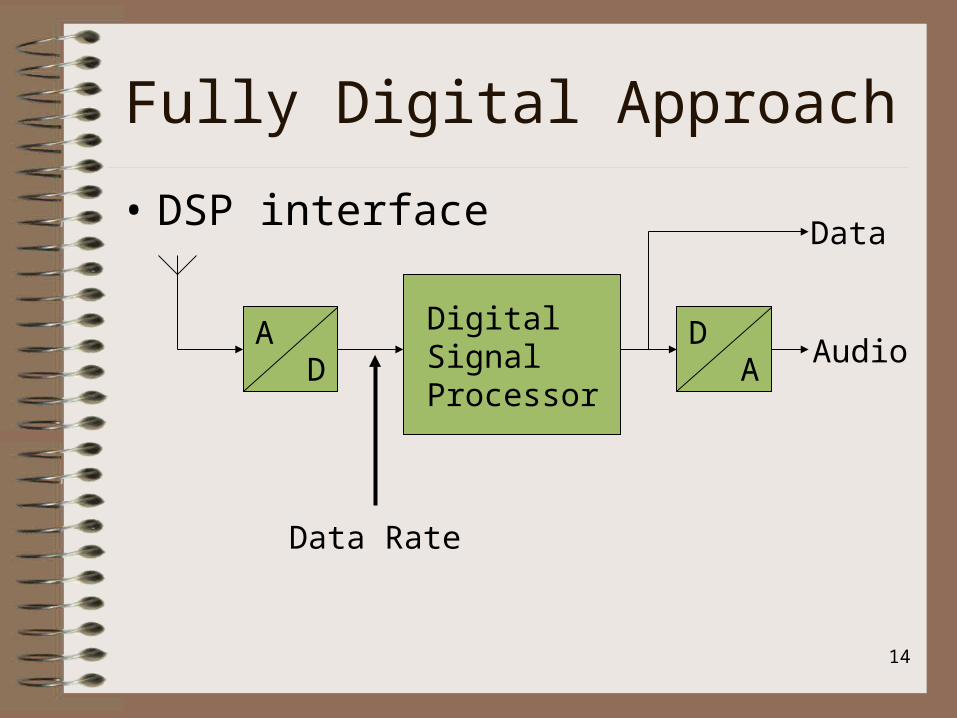
Fully Digital Approach
• DSP interface
AD A
DDigital Signal Processor
Data
Audio
Data Rate
15
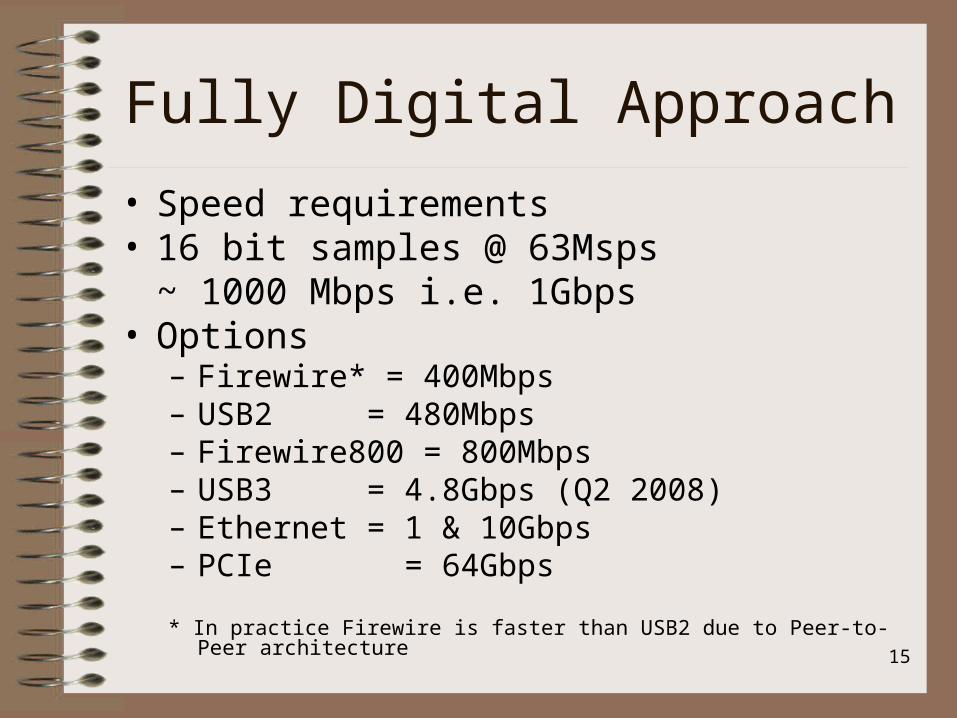
Fully Digital Approach
• Speed requirements• 16 bit samples @ 63Msps
~ 1000 Mbps i.e. 1Gbps• Options
– Firewire* = 400Mbps– USB2 = 480Mbps– Firewire800 = 800Mbps – USB3 = 4.8Gbps (Q2 2008) – Ethernet = 1 & 10Gbps– PCIe = 64Gbps
* In practice Firewire is faster than USB2 due to Peer-to-Peer architecture
16
Fully Digital Approach
• DSP requirements• PC – Quad Core PC
– Processor speed OK, limitation is getting data in and out of the processors' main address space
• PlayStation 3– Processor Speed OK, limited to 100T Ethernet or
USB2 interface
• Expect to process 4~6MHz of spectrum
17
Fully Digital Approach
• Digital to Analogue Conversion (DAC)
• For Audio output need 16 bits at 8ksps
= 128ksps
• Modern sound cards/chips do > 4Mbps
18
Fully Digital Approach
• Reality Check!
• ADC not meet our needs
• USB2 or Firewire will give 240Mbps to PC
• Enough for a 60MHz wide bandscope or 6 simultaneous receivers each 300kHz wide
• So we compromise!
19
Fully Digital Approach
• With Analogue radios we don’t process 0 - 30MHz simultaneously
• We process a single frequency and a narrow bandwidth e.g. 3kHz
• Can we apply the same process to a fully digital radio?
• Yes! We use Digital Down Conversion which is based on Decimation.
20
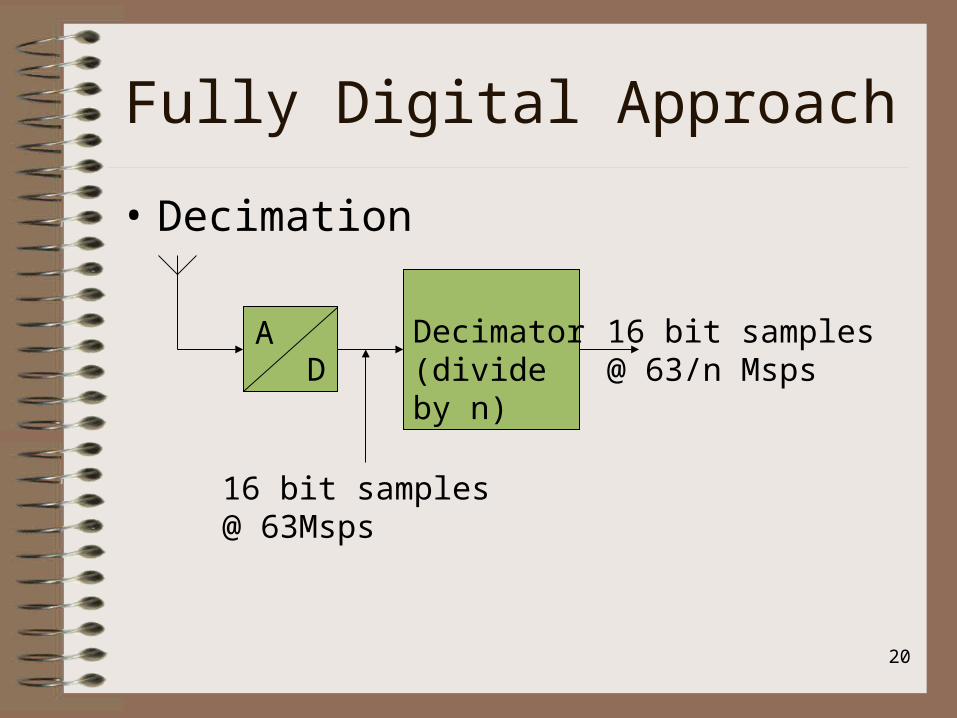
Fully Digital Approach
• Decimation
AD
Decimator(divide by n)
16 bit samples @ 63Msps
16 bit samples@ 63/n Msps
21
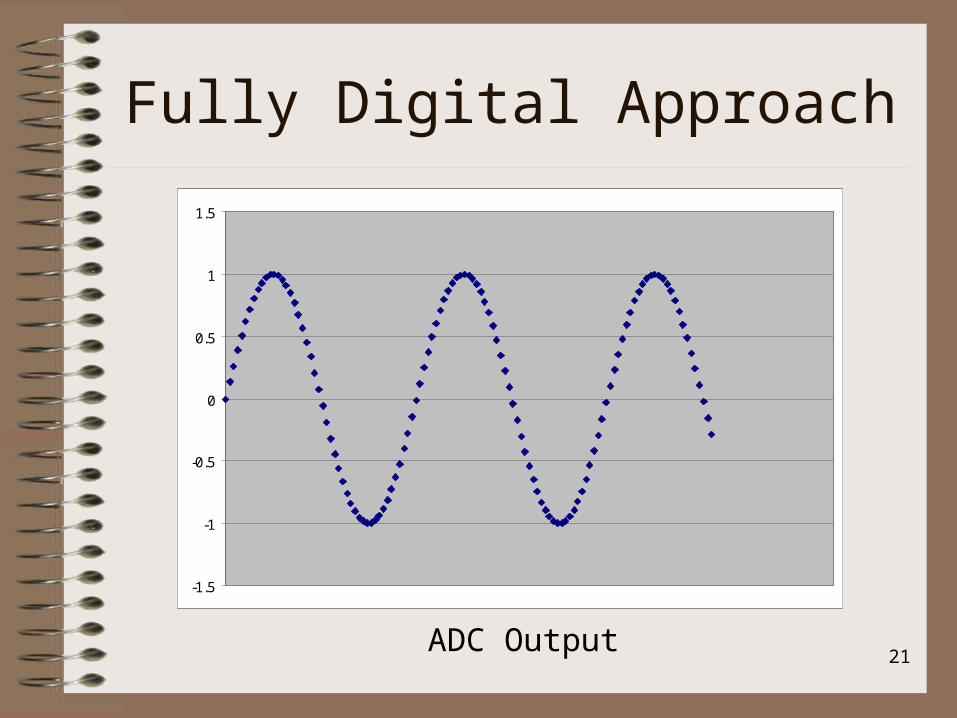
Fully Digital Approach
-1.5
-1
-0.5
0
0.5
1
1.5
ADC Output

22
Fully Digital Approach
-1.5
-1
-0.5
0
0.5
1
1.5
ADC Output – Decimate by 3
23
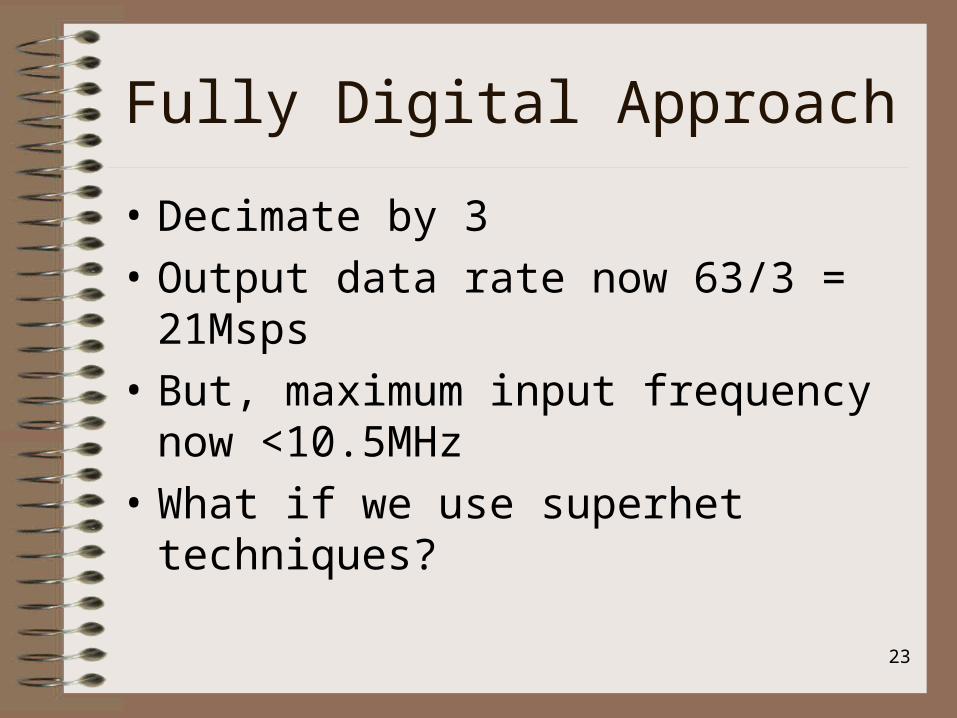
Fully Digital Approach
• Decimate by 3
• Output data rate now 63/3 = 21Msps
• But, maximum input frequency now <10.5MHz
• What if we use superhet techniques?

24
Digital Down Conversion
25
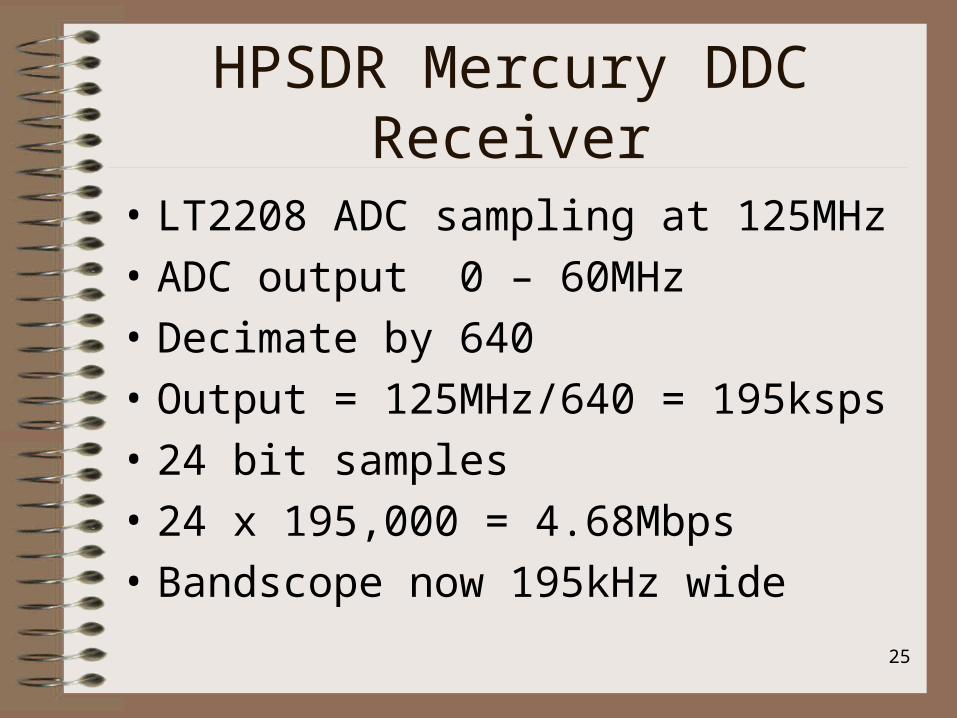
HPSDR Mercury DDC Receiver
• LT2208 ADC sampling at 125MHz
• ADC output 0 – 60MHz
• Decimate by 640
• Output = 125MHz/640 = 195ksps
• 24 bit samples
• 24 x 195,000 = 4.68Mbps
• Bandscope now 195kHz wide
26
HPSDR Mercury DDC Receiver
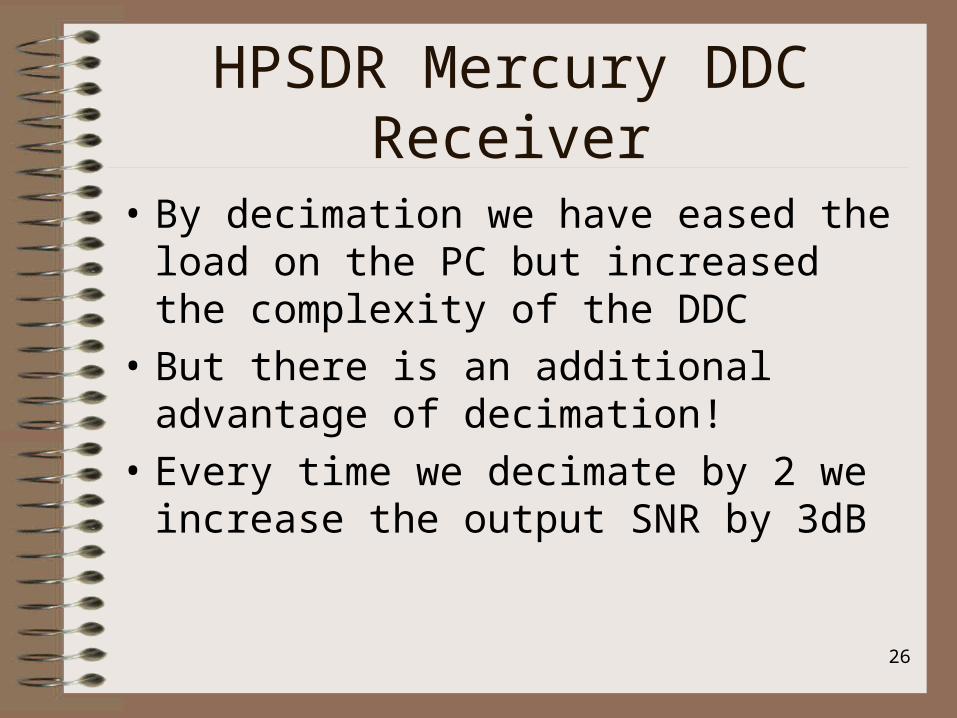
• By decimation we have eased the load on the PC but increased the complexity of the DDC
• But there is an additional advantage of decimation!
• Every time we decimate by 2 we increase the output SNR by 3dB
27
HPSDR Mercury DDC Receiver
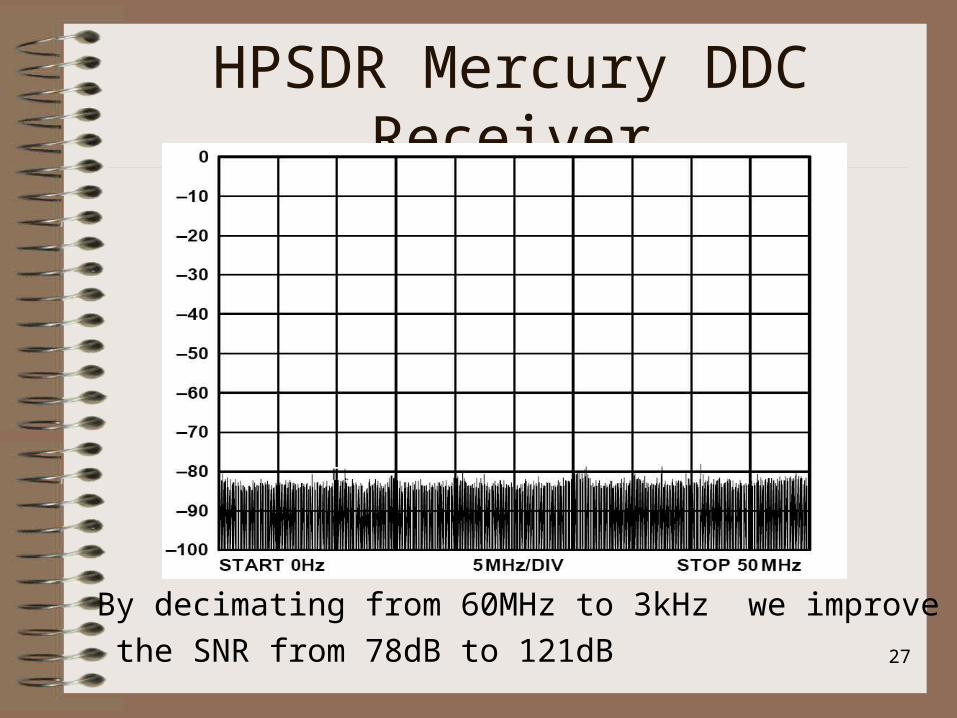
By decimating from 60MHz to 3kHz we improve
the SNR from 78dB to 121dB
28
Performance
• Standard way of measuring receiver performance• 3rd Order Intermodulation Products• Inject two equal amplitude signals in the antenna
socket• Any non-linear stages will create 2nd harmonics• These mix with the fundamentals to produce 3rd
order IP
29
Performance
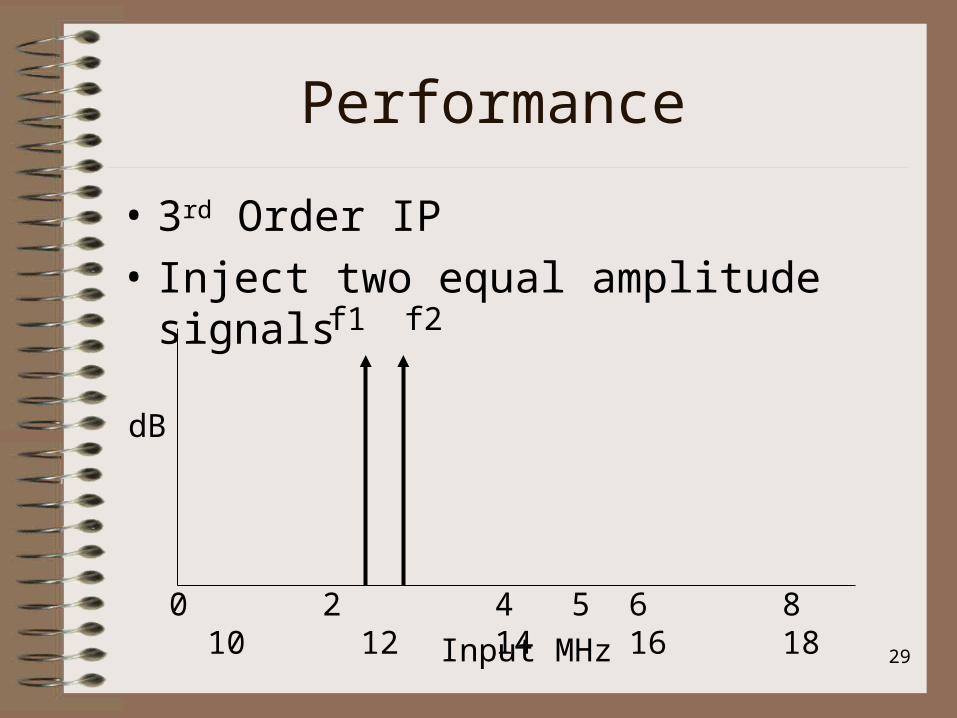
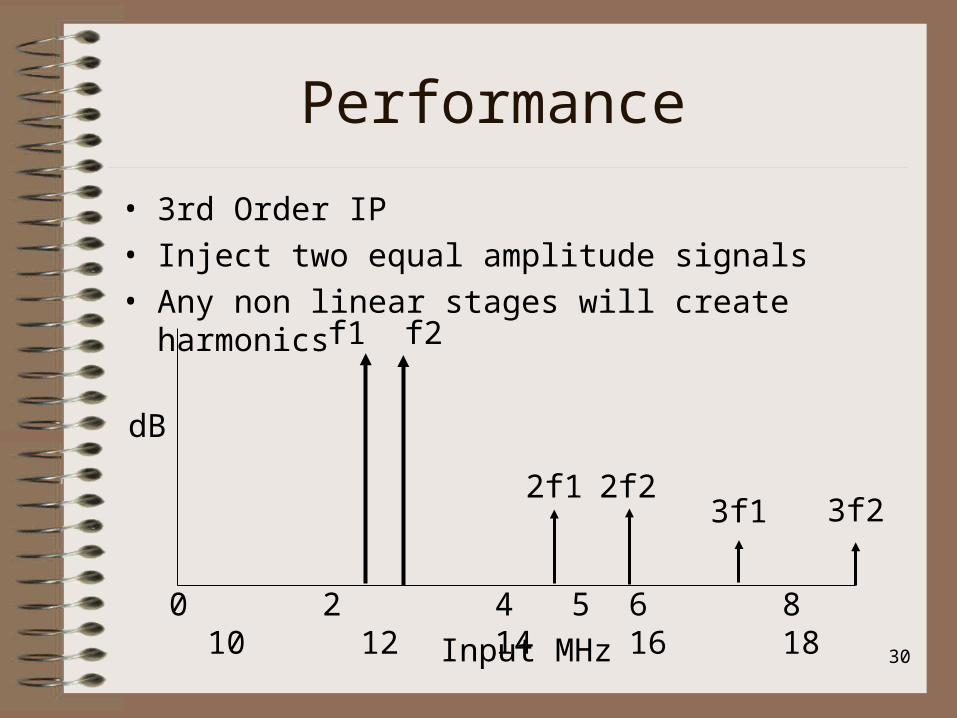
• 3rd Order IP
• Inject two equal amplitude signals
0 2 4 5 6 8 10 12 14 16 18
Input MHz
dB
f1 f2
30
Performance
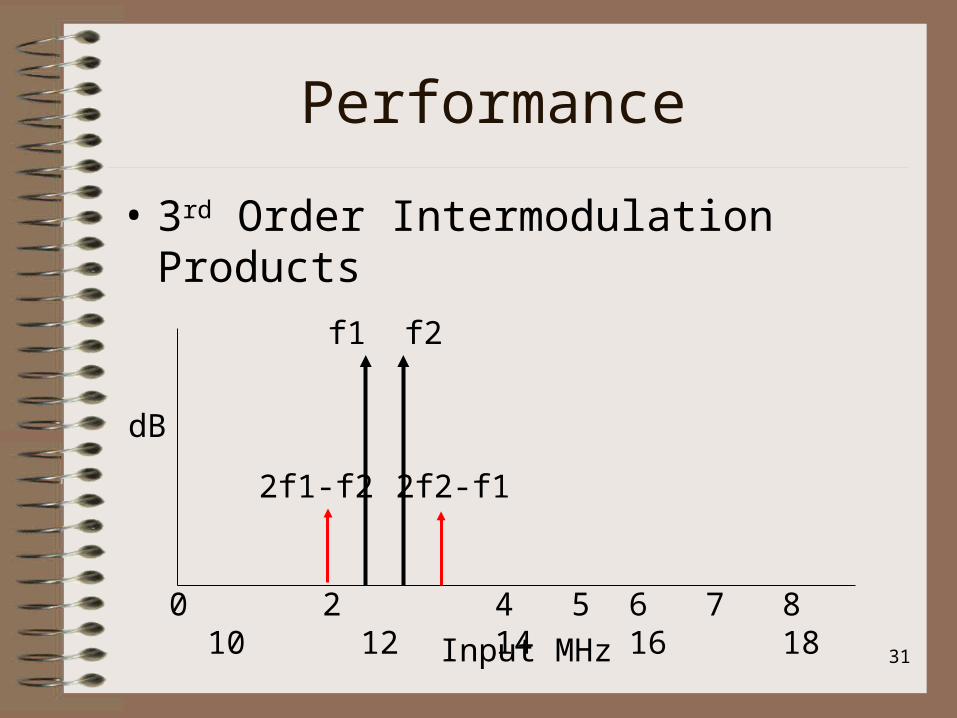
• 3rd Order IP
• Inject two equal amplitude signals
• Any non linear stages will create harmonics
0 2 4 5 6 8 10 12 14 16 18
Input MHz
dB
f1 f2
2f1 2f23f1 3f2
31
Performance
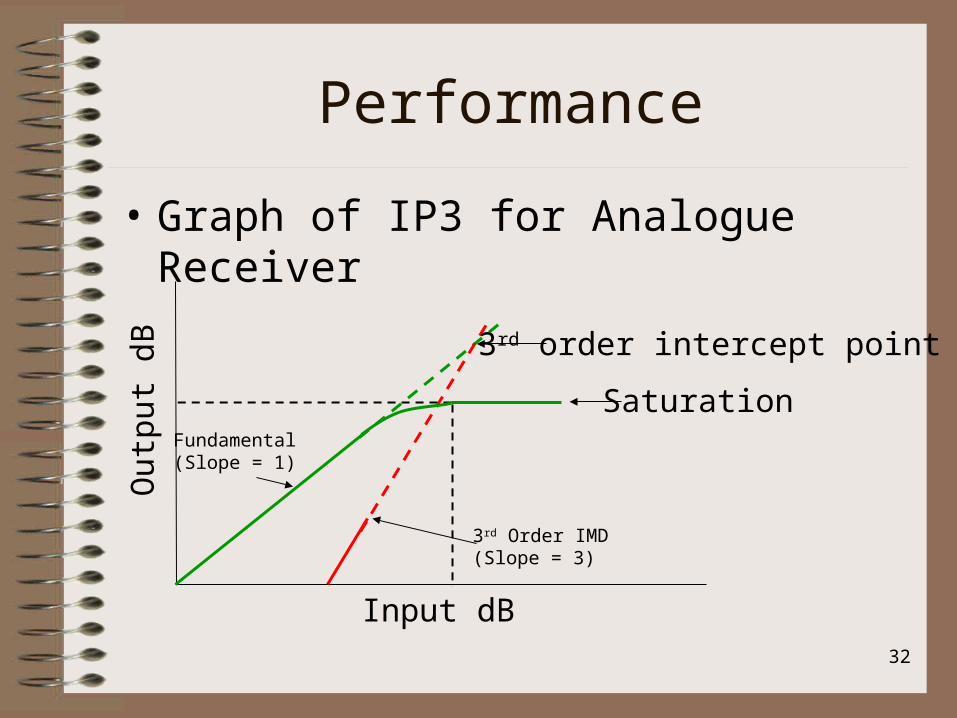
• 3rd Order Intermodulation Products
0 2 4 5 6 7 8 10 12 14 16 18
Input MHz
dB
f1 f2
2f1-f2 2f2-f1
32
Performance
• Graph of IP3 for Analogue Receiver
Input dB
Out
put d
B
Saturation
3rd order intercept point
Fundamental(Slope = 1)
3rd Order IMD(Slope = 3)
33
Performance
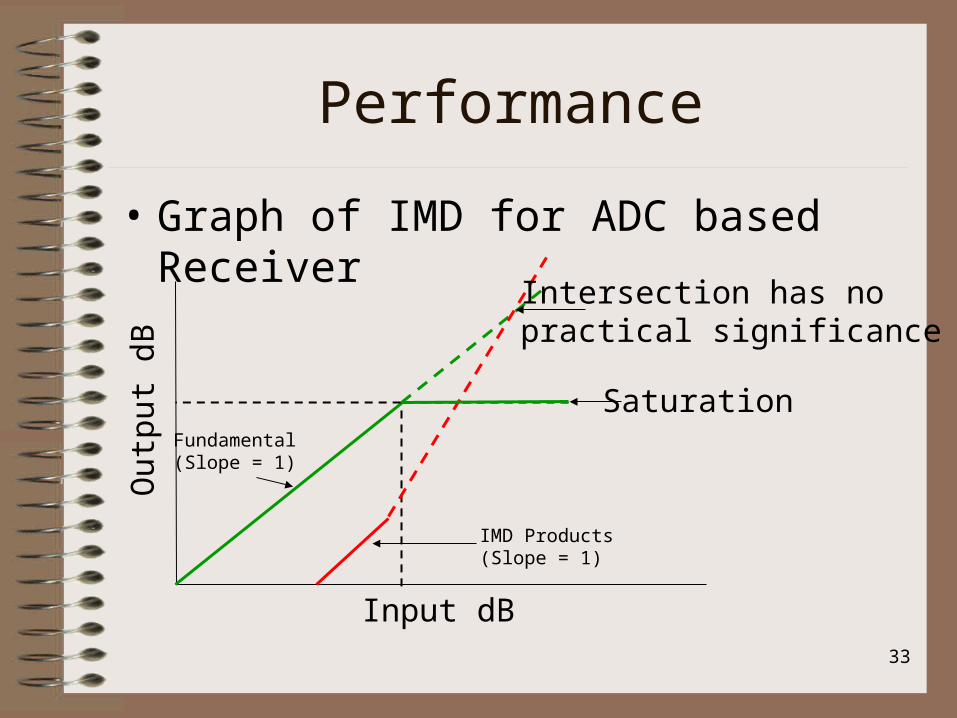
• Graph of IMD for ADC based Receiver
Input dB
Out
put d
B
Saturation
Intersection has nopractical significance
Fundamental(Slope = 1)
IMD Products(Slope = 1)
34
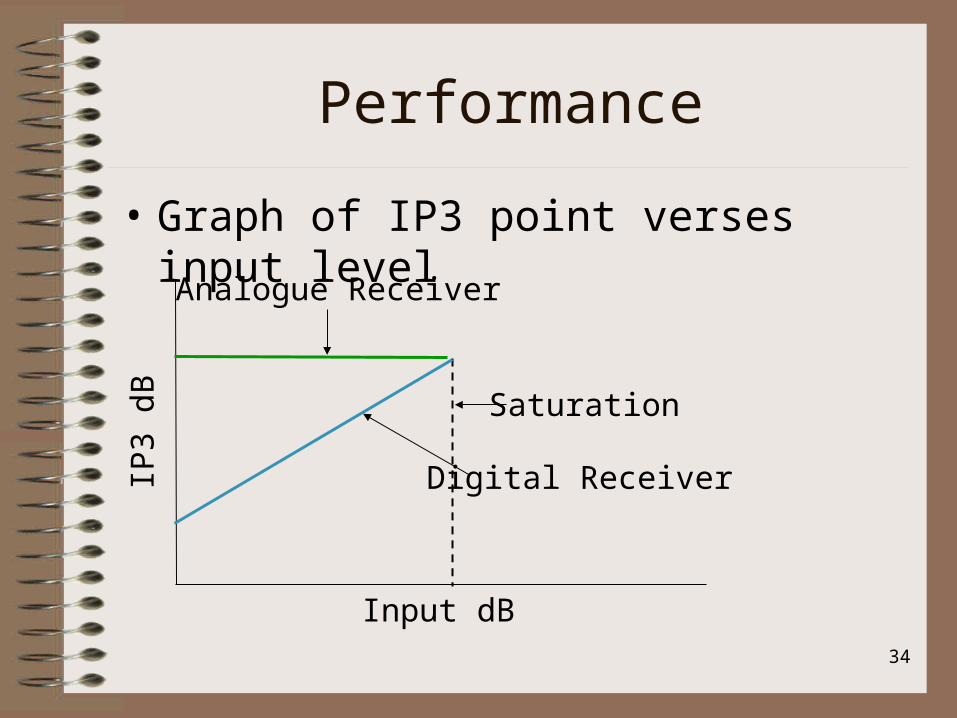
Performance
• Graph of IP3 point verses input level
Input dB
IP3
dB Saturation
Analogue Receiver
Digital Receiver
35
Performance
• What causes IMD to vary with input level?– Fewer bits are used at low input levels– Non ideal ADC performance
36
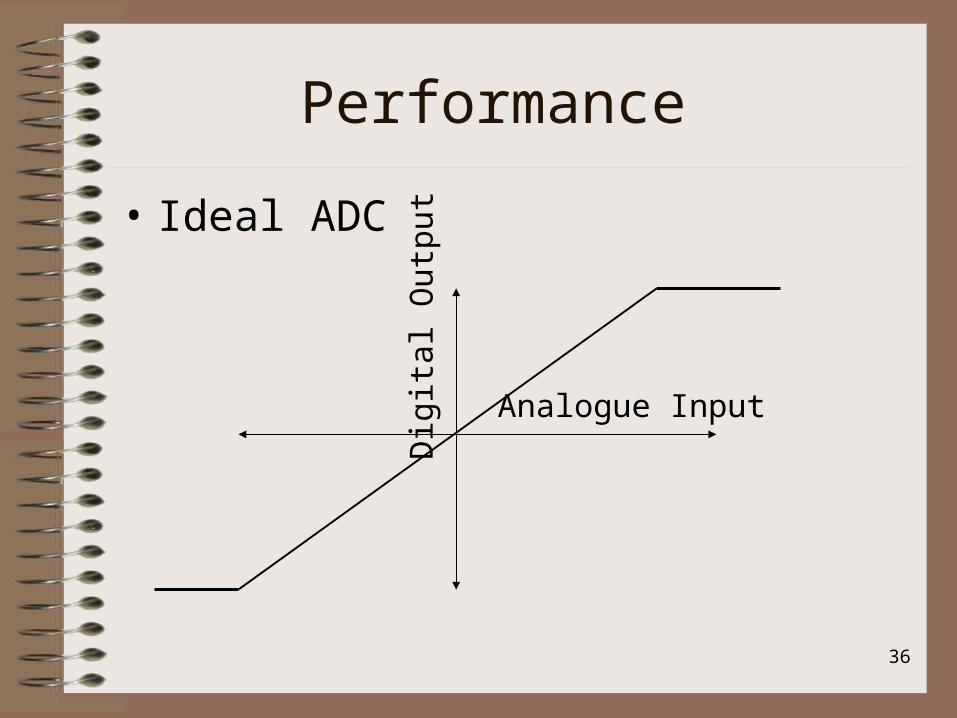
Performance
• Ideal ADC
Analogue Input Dig
ital
Out
put
37
PerformancePerformance
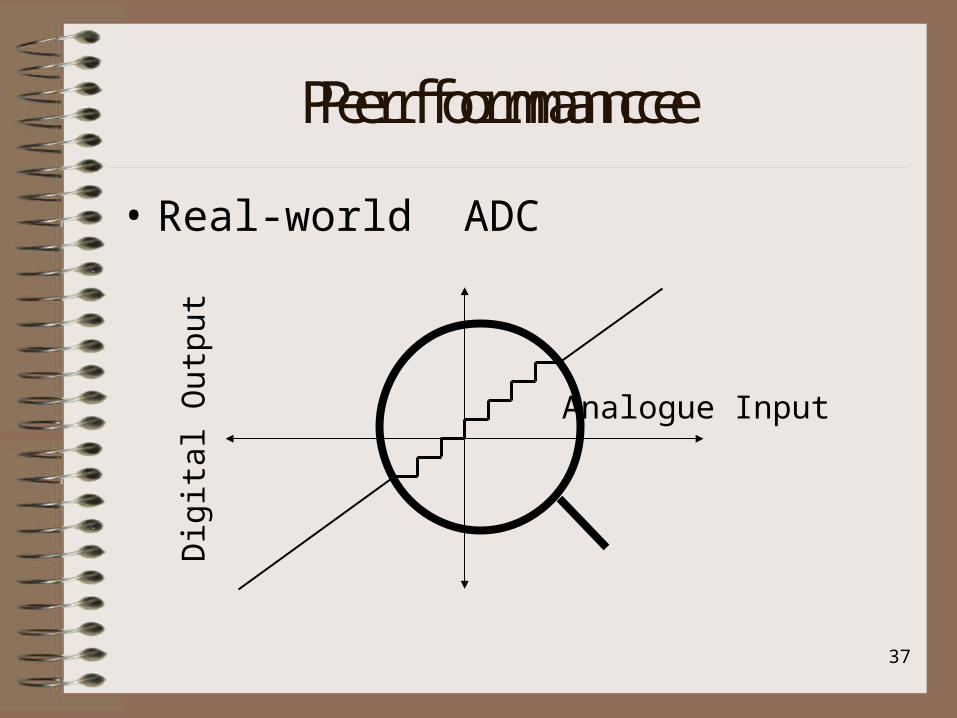
• Real-world ADC
Analogue Input
Dig
ital
Out
put

38
PerformancePerformance
• Real-world ADC
Analogue Input
Dig
ital
Out
put
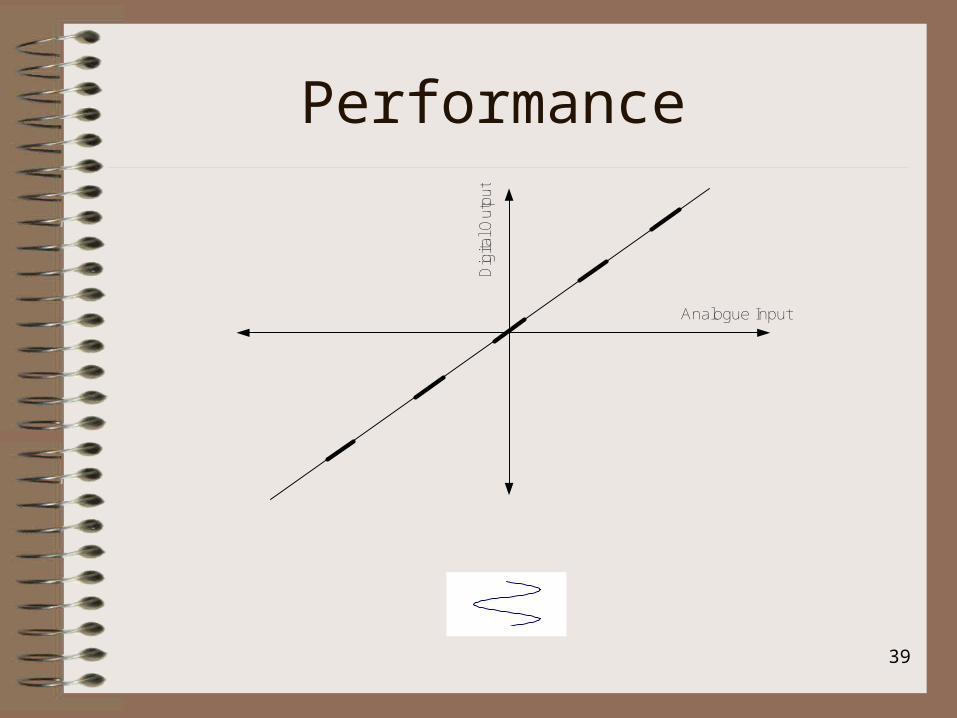
39
Performance
Analogue Input
Dig
ital O
utpu
t
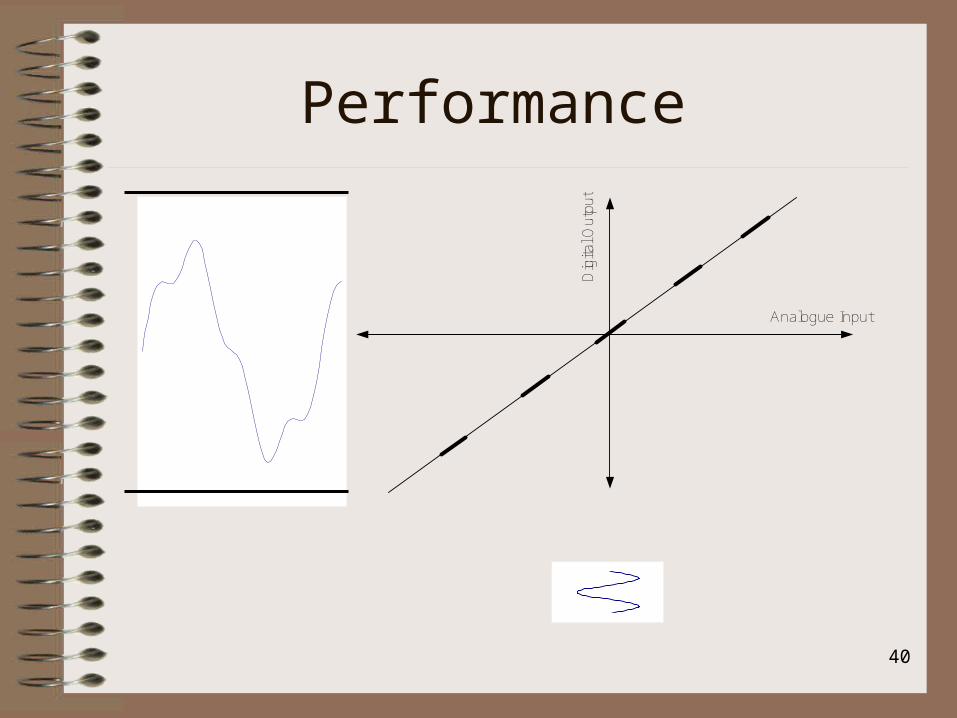
40
Performance
Analogue Input
Dig
ital O
utpu
t
41
Performance
• Sources of dither – In band signals and noise– Out of band signals and noise– Internal pseudorandom noise – Added external signal– As long as all the external signals don’t
add….. Then big signals are your friend.
42
Fully Digital HF Radios
• Summary– Fully digital receivers perform differently to
analogue ones– IP3 measurements are not meaningful.– Large signals can improve the performance of
digital receivers– In practice……