1 Fresno Catalytic Community Convening February 4 th, 2015.
84
1 Fresno Catalytic Community Convening February 4 th , 2015
-
Upload
arabella-simpson -
Category
Documents
-
view
214 -
download
0
Transcript of 1 Fresno Catalytic Community Convening February 4 th, 2015.

1
Fresno Catalytic Community Convening
February 4th, 2015

2
WELCOME & CONTEXT SETTING
3
MEETING RESULTS: 1. Update on accountability structure 2. Review tenets of continuous improvement with a high
level perspective of what is it and what is needed3. Solidify list of data needs with identification of gaps
and potential strategies4. Secure action commitments from group participants

4
CHECK-IN: • What is your name? • What organization are you representing? • What does success for you look like today?

5
Partner Engagement Evolution in Collective Impact
© Strive 2013
What is needed in a collective impact context
6
DRAFT FRESNO ACCOUNTABILITY STRUCTURE

7
TCM Role – Systems HubA primary goal of The Children’s Movement is to connect and focus the various bodies of work shown in the graphic below around the central issue of Grade-Level Reading

8
Fresno C2C Goals &
Outcomes
Partnership Board
Operations Team
K-12/Higher Ed/Career
Action Team
Community Steering
Committee
Continuous Improvemen
t Team
Prenatal – 3rd Grade
Action Team

99
Levels of Engagement for Leadership
Typical Engagement Opportunities
Advisory Board Board of Directors Taskforce
Key Characteristics:
Giving feedback on strategy with no commitment to act
Key Characteristics:
Overseeing legal and financial responsibilities with guidance on strategy and overall direction
Key Characteristics:
Focus on developing recommendations for action and engaging in active advocacy on behalf of the proposed solutions
Partnership
Key Characteristics:
Commit to changing behavior of individuals and organizations to achieve a collective result
New Type of Engagement
10
This work requires a complete paradigm shift.
For example, we are moving from a focus on institutions at the center……..

1111

12
To the child at the center……..

1313
14
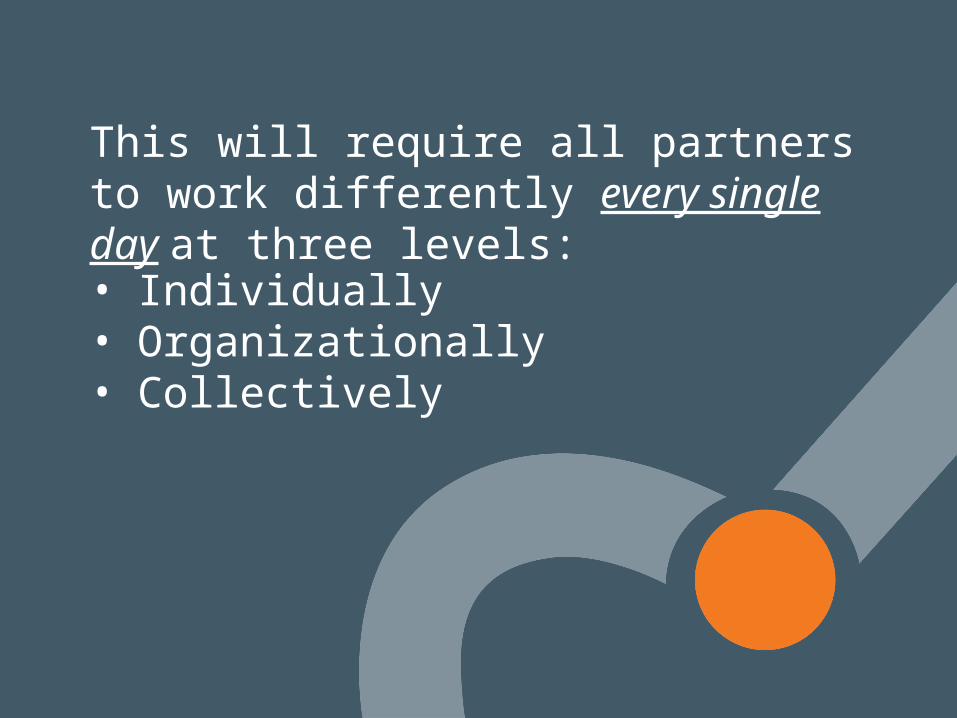
This will require all partners to work differently every single day at three levels:
• Individually• Organizationally• Collectively

1515
IndividuallyOrganizationallyCollectivelyIndividual leadership team members build awareness of the work and align where possible throughout the community
Organizations represented on theleadership table align work to partnershipoutcomes, commit to using data andidentify best practices
Leadership table works together to drive systems change by mobilizing thecommunity and championing advocacyto support evidence based change
Leadership can take action . . .

1616
Examples of Leadership Action
Type of Action Early Stage Middle Stage Late Stage
Individual
Organization
Collective
Speak to the work of the partnership regularly in the community at events or on a board
Advocate for collection and utilization of data on a non-profit board of use of data to inform decision on the board of a philanthropy
Adopt partnership outcomes as a part of strategic plan and ensure staff understand connection to overall vision
Provide programmatic data on work related to a partnership outcome to enable continuous improvement
Change work of organization – practitioner, investor, policymaker – to adopt or support practices identified as impactful
Champion mobilization campaign to engage and tap into community resources to support outcome improvement
Develop and champion a policy and advocacy agenda to remove barriers and spread best practices identified by partnership
Partnership Development
Leverage partner resources to align and support development of partnership structure
Work to get on the board of key orgs /partners or speak to groups that are struggling to find ways to engage

1717
“What can we do collectively as the leadership table to drive systems change by supporting evidence based practice, mobilizing the community and championing advocacy?”
Action CommitmentsClear commitments to take tangible action within a specified timeframe
“What can my organization do to align our work to the partnership outcomes, use data
differently and identify best practices?”

18
Continuous Improvement Overview
Overview & Capacity Needs
© Strive 2013
19
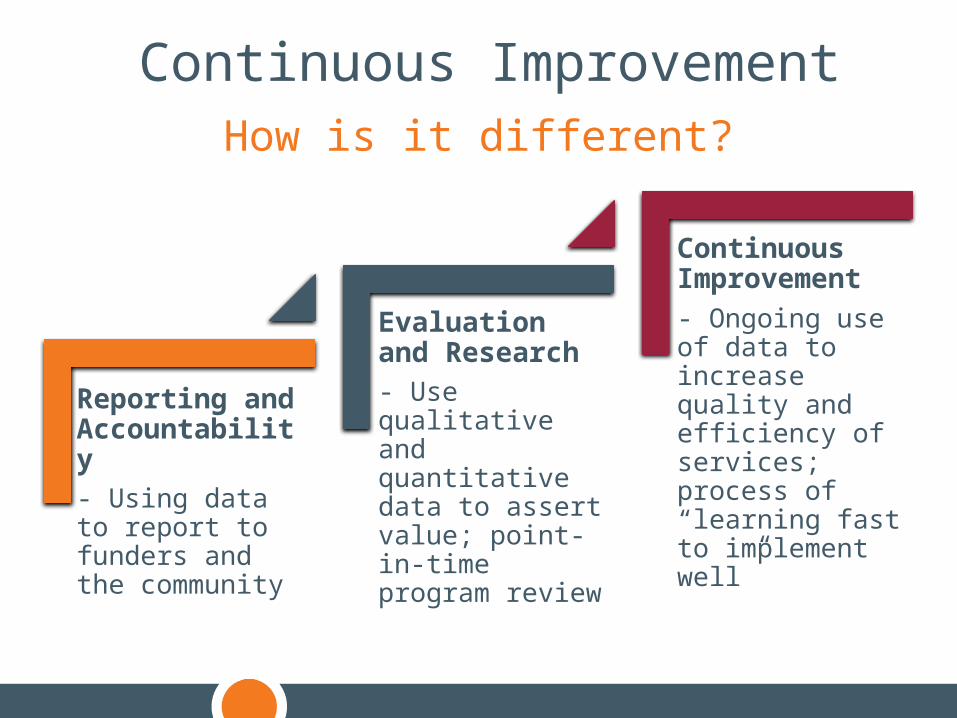
Reporting and Accountability- Using data to report to funders and the community
Evaluation and Research- Use qualitative and quantitative data to assert value; point-in-time program review
ContinuousImprovement- Ongoing use of data to increase quality and efficiency of services; process of “learning fast to implement well”
Continuous ImprovementHow is it different?

20January February March April
20%
25%
30%
35%
40%
45%
50%
55%
60%
65%
70%Elk WoodsLake PortMadison
Project Measure: Percent of students at proficiency in 3rd grade reading
Team of grade-level teachers review
benchmark assessment data; adopt action step
Small test of change:Engaged tutoring
partners to provide intensive support during class time
Small test: Intensive supports helped.
Tried pulling students out of class for deeper
intervention.
Small test: Additional staff from partners engaged to create
smaller learning groups in classes
Returned students to class for partners to
provide intensive supports
Analytics to Drive Action
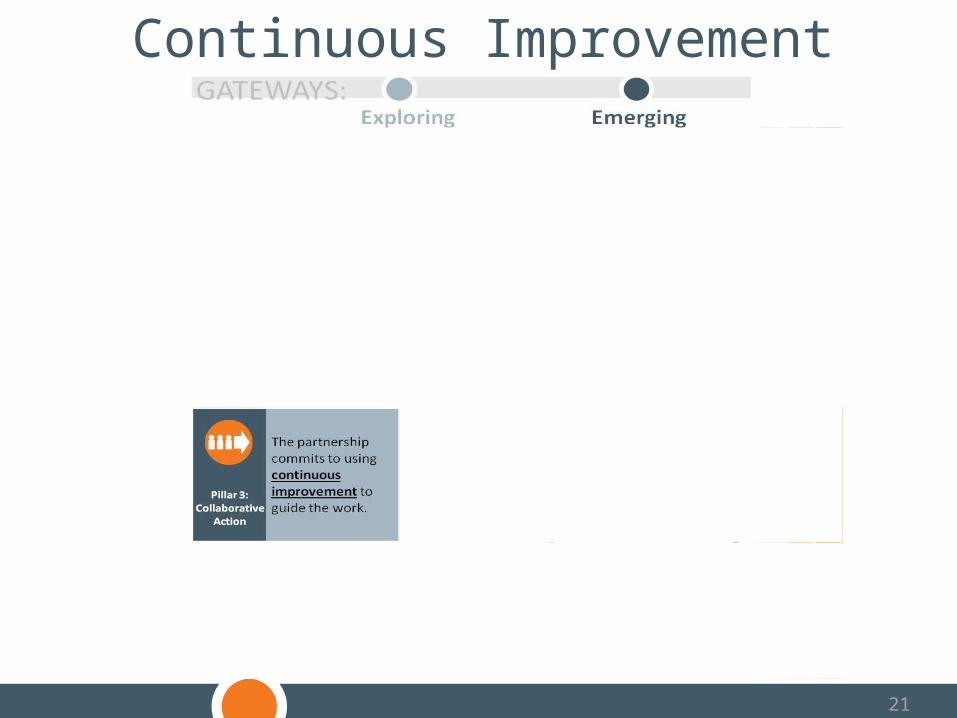
2121
Continuous Improvement

2222
Myth: Everyone already understands it
2323
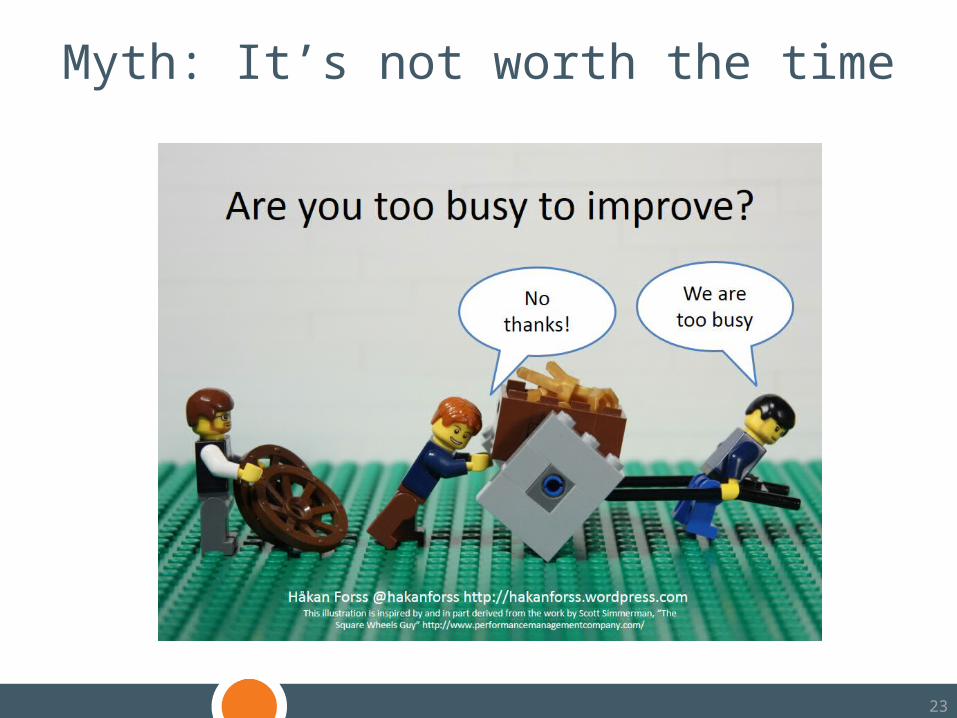
Myth: It’s not worth the time

2424
Myth: Not every process can be improved

2525
What is Continuous Improvement?
Continuous Improvement“An ongoing effort to improve the quality of products, services, or processes. These efforts can seek "incremental" improvement over time or "breakthrough" improvement all at once. Delivery (customer valued) processes are constantly evaluated and improved in the light of their efficiency, effectiveness and flexibility.”
-Wikipedia
Kaizen
KAI = Change
ZEN = Good
Japanese for improvement or change for the best; refers to philosophy or practices that focus upon continuous improvement.

26
BACKBONE FUNCTION ROLES: DATA SUPPORT CAPACITY

2727
Backbone Function RolesEngage Partners & CommunityBring together the necessary community partners to support the work, including engagement ofthe broader community as well as executive-level individuals for the leadership table.
CommunicationsDevelop a set of key messages about the partnership and communicate them regularly to internalpartners and the broad community. Establish the necessary mechanisms for communicating about the partnership (newsletter, website, etc.). Release an annual report card to the community that effectively communicates the importance and meaning of the data for each of the partnership’s community-level outcomes. Enable the flow of information between the different groups within the partnership.
Fundraising &DevelopmentDevelop and implement a plan forsecuring funding and resources to advance the partnership’s work. Tap into existing relationships to build financial support for the partnership.
Data SupportEnable the access, analysis, and utilizationof data to support the partnership.
• Data Access- enables necessary datathat is crucial to advancing the work of the partnership to be accessed and used for data-driven decision making.
• Data Analysis- analyzes data according to the partnership’s needs.
• Data Coaching- trains and supportspartnership and network members in the process of using data for continuous improvement.

2828
Enable the access, analysis, and utilization of data to support the partnership.
• Data Access- enables necessary datathat is crucial to advancing the work of the partnership to be accessed and used for data-driven decision making.
• Data Analysis- analyzes data according to the partnership’s needs.
• Data Coaching- trains and supportspartnership and network members in the process of using data for continuous improvement.
Data Support
2929
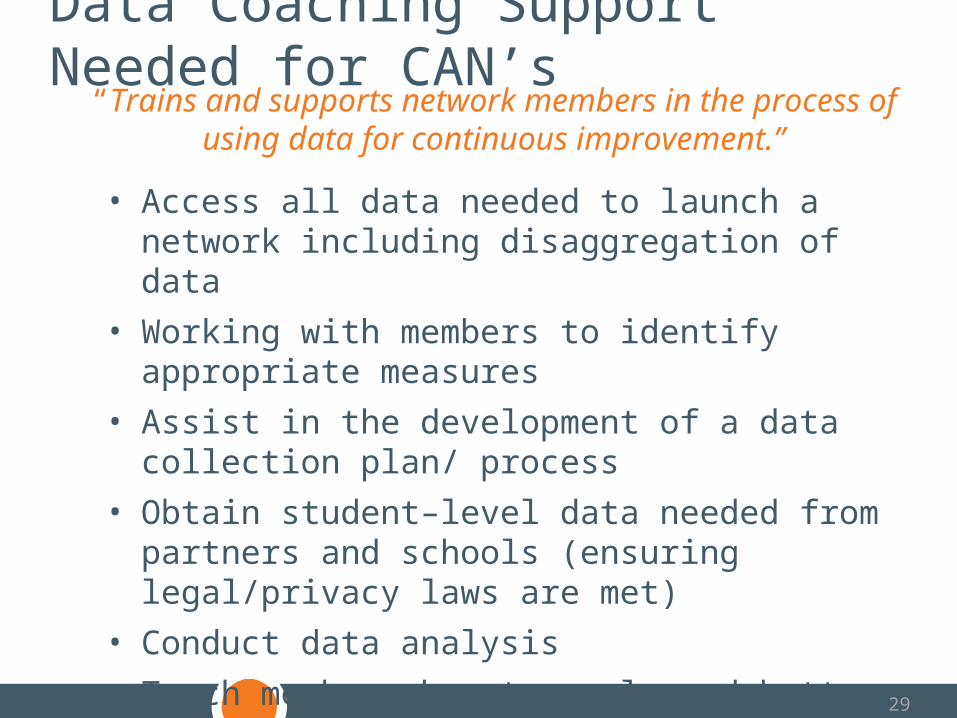
“Trains and supports network members in the process of using data for continuous improvement.”
• Access all data needed to launch a network including disaggregation of data
• Working with members to identify appropriate measures • Assist in the development of a data collection plan/
process• Obtain student–level data needed from partners and
schools (ensuring legal/privacy laws are met)• Conduct data analysis• Teach members how to apply and better understand how
data is used for continuous improvement
Data Coaching Support Needed for CAN’s

3030
Data Support: Case Study Examples
ACT Scores: 12.7

3131
2010 2011 2012 2013 20140.0%
10.0%
20.0%
30.0%
40.0%
50.0%
60.0%
70.0%
80.0%
90.0%
100.0%
54.3% 56.1% 57.4% 54.8% 55.7%
45.7% 43.9% 42.6% 45.2% 44.3%
3rd Grade Reading Proficiency
At or above proficiency Below proficiency
Understanding the relevant importance of movement on the outcome over time.
Data Trends
32
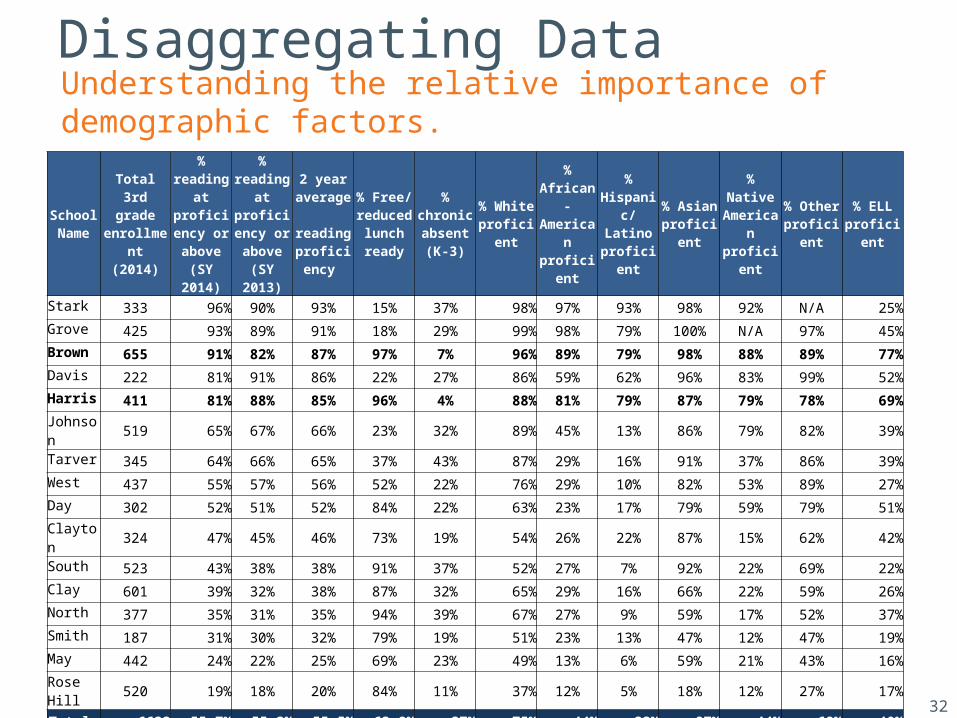
Disaggregating DataUnderstanding the relative importance of demographic factors.
School Name
Total 3rd grade
enrollment (2014)
% reading at
proficiency or above (SY 2014)
% reading at
proficiency or above (SY 2013)
2 year average reading
proficiency
% Free/ reduced
lunch ready
% chronic absent (K-
3)% White
proficient% African-American proficient
% Hispanic/
Latino proficient
% Asian proficient
% Native American proficient
% Other proficient
% ELL proficient
Stark 333 96% 90% 93% 15% 37% 98% 97% 93% 98% 92% N/A 25%Grove 425 93% 89% 91% 18% 29% 99% 98% 79% 100% N/A 97% 45%Brown 655 91% 82% 87% 97% 7% 96% 89% 79% 98% 88% 89% 77%Davis 222 81% 91% 86% 22% 27% 86% 59% 62% 96% 83% 99% 52%Harris 411 81% 88% 85% 96% 4% 88% 81% 79% 87% 79% 78% 69%Johnson 519 65% 67% 66% 23% 32% 89% 45% 13% 86% 79% 82% 39%Tarver 345 64% 66% 65% 37% 43% 87% 29% 16% 91% 37% 86% 39%West 437 55% 57% 56% 52% 22% 76% 29% 10% 82% 53% 89% 27%Day 302 52% 51% 52% 84% 22% 63% 23% 17% 79% 59% 79% 51%Clayton 324 47% 45% 46% 73% 19% 54% 26% 22% 87% 15% 62% 42%South 523 43% 38% 38% 91% 37% 52% 27% 7% 92% 22% 69% 22%Clay 601 39% 32% 38% 87% 32% 65% 29% 16% 66% 22% 59% 26%North 377 35% 31% 35% 94% 39% 67% 27% 9% 59% 17% 52% 37%Smith 187 31% 30% 32% 79% 19% 51% 23% 13% 47% 12% 47% 19%May 442 24% 22% 25% 69% 23% 49% 13% 6% 59% 21% 43% 16%Rose Hill 520 19% 18% 20% 84% 11% 37% 12% 5% 18% 12% 27% 17%
Totals 6623 55.7% 55.2% 55.5% 63.8% 27% 75% 44% 22% 87% 44% 68% 40%
33
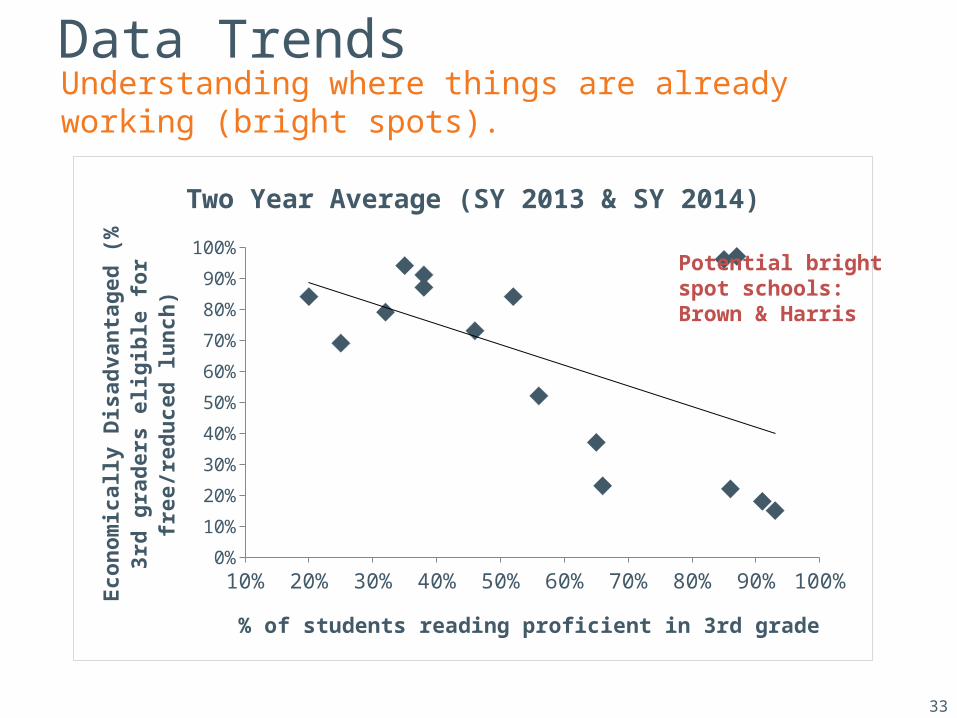
Data TrendsUnderstanding where things are already working (bright spots).
10% 20% 30% 40% 50% 60% 70% 80% 90% 100%0%
10%
20%
30%
40%
50%
60%
70%
80%
90%
100%
Two Year Average (SY 2013 & SY 2014)
% of students reading proficient in 3rd grade
Econ
omic
ally
Disa
dvan
tage
d (%
3rd
gra
ders
el
igib
le fo
r fre
e/re
duce
d lu
nch)
Potential bright spot schools: Brown & Harris

34© Strive 2013|3434
Disaggregating DataUnderstanding the relative importance of different key driver/factors: determine which students are most in need.
Kindergarteners 1st Graders 2nd Graders 3rd Graders
-10%
10%
30%
50%
24%
31%26%
19%
% chronic absenteeism by grade
35© Strive 2013|3535
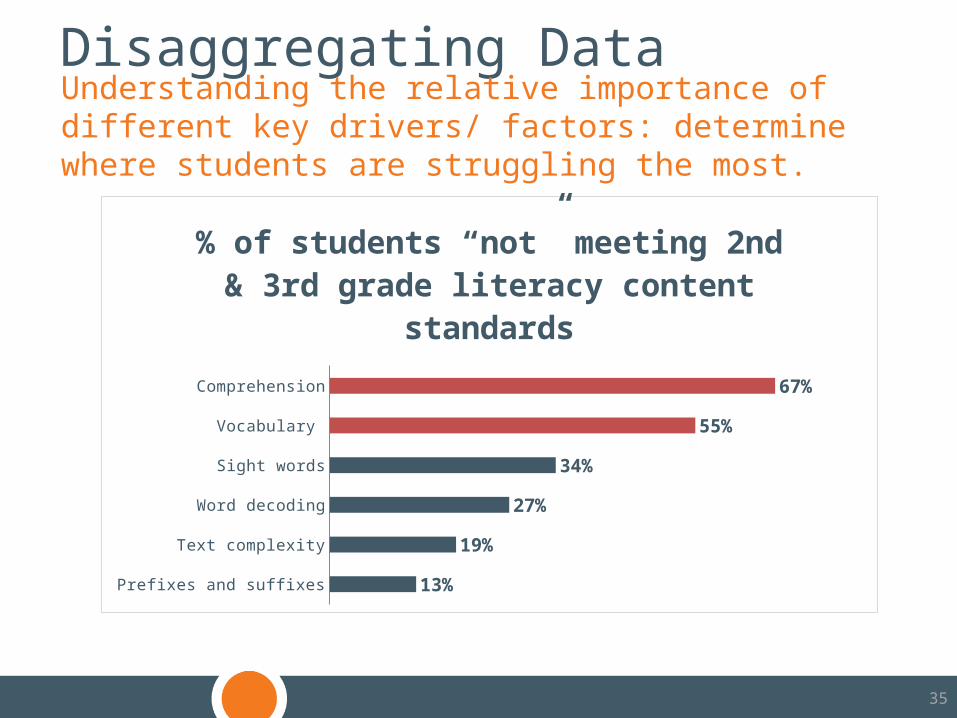
Disaggregating Data Understanding the relative importance of different key drivers/ factors: determine where students are struggling the most.
Prefixes and suffixes
Text complexity
Word decoding
Sight words
Vocabulary
Comprehension
13%
19%
27%
34%
55%
67%
% of students “not” meeting 2nd & 3rd grade literacy content standards

36
Student name Grade DOB Race/ Ethnicity
1:1 FAFSA completion
# of college tours
Assistance on
completing a college
application
Assistance with applying
for scholarships
Career/college planning reviewed
National Student Clearinghouse:
College Enrollment Data
District / school database/system: ACT
& Graduation Data
Tracked/collected by partners (with parental consent) Data obtained from school/districts
Types of Service Nparm DF ChiSquare P Value
1:1 FAFSA completion assistance provided 1 1 45.05007 0.0001
Student went on at least one college tour 1 1 0.064657 1.675
Took the ACT 1 1 0.461156 0.00012
College plan reviewed 1 1 3.43025 1.8964
Assistance with completing a college application 1 1 63.431675 0.0014
Statistical analysis: key critical activities that impact change
Data Analysis Example: RegressionHelp members to analyze data from the data collection plan in order to determine possible “practices” that are impacting the outcome.
Regardless of race or socio-economic status - students who had completed FAFSA, took the ACT and applied to college were 86% to 91% more likely to enroll into college within 6 months of graduating.
Effect likelihood ratio tests (p< .05)

3737
FAFSA completion:
24 %
ACT Scores: 12.7
Capacity Needs
Discussion on the following:• Do we have the capacity needed?• What else will we need?• Who could help us?• What should we do next?

3838
Questions?
FAFSA completion:
24 %
ACT Scores: 12.7
39
Continuous Improvement Deep-Dive
Deep-Dive & KSEP Data Review
© Strive 2013

40
Collaborative Action Teams

41© Strive 2013|4141© Strive 2013
How to form and sustain an Action Team to improve outcomes.

4242
Case Study Example
FAFSA completion:
24 %
ACT Scores: 12.7
© Strive 2013

43© Strive 2013|4343© Strive 2013
What we are tracking.
What we are prioritizing.
3rd Grade Reading
Kindergarten Readiness
High School Graduation
College Enrollment
College Completion
High School Graduation
Kindergarten Readiness
College Enrollment
3rd Grade Reading
High School Graduation

4444
Base of knowledge to inform the local data and community expertise around key levers/factors; used as a guide
Qualitative input that provides meaning and context around national research and local data.
Different types of measures/ indicators informed by that are available help to understand local context and impact/ relation to national research.
Local Data
Community Expertise & Voice
National Research
What do we need to get started?

4545
2010 2011 2012 2013 20140.0%
10.0%
20.0%
30.0%
40.0%
50.0%
60.0%
70.0%
80.0%
90.0%
100.0%
54.3% 56.1% 57.4% 54.8% 55.7%
45.7% 43.9% 42.6% 45.2% 44.3%
3rd Grade Reading Proficiency
At or above proficiency Below proficiency
What does the outcome trend tell us?

46
6,623 3rd graders in Springfield School District
Race/Ethnic % Number % Free/ Reduced Lunch
Number
White 33% 2,186 27% 590
African American/Black 16% 1,060 83% 879
Latino/Hispanic 42% 2,782 92% 2,559
Asian 1.5% 99 0% 0
Native American 6.5% 430 78% 335
Other .5% 33 55% 18
Who is our population?

4747
What could be effecting our outcome?
55.7% of 3rd graders are proficient in reading
Percent K-3rd graders tutored by partners who are proficient: TBD
Percent of K-3 students from
low-income families: 82%
Mobility rate: 63 %
What are some factors (key drivers) to consider?
© Strive 2013
Percent K-3rd attending an afterschool
program: 59%
Percent of children entering
kindergarten prepared: 45%
Percent of parents who are
unemployed: unknown
Percent of K-3
students who are chronically absent:
27%
Percent of K-3 students
experiencing summer learning
loss: 32%

48© Strive 2013|4848© Strive 2013
What are our boundaries?Out of Action Team’s control: refer to Leadership/ Partnership to address.
Out of Action Team’s scope: refer to another Action Team.

4949
What is within our control/influence?
55.7% of 3rd graders are proficient in reading
© Strive 2013
What this Action Team can change. Outside of Action Team’s control or scope.
Percent of K-3
students tutored by partners who
are proficient: TBD
Percent of children from low-income
families: 82%
Mobility rate: 63 %
Percent of K-3 students who are
chronically absent: 27%
Percent K-3 students attending
an afterschool program: 59%
Percent of children entering
kindergarten prepared: 45%
Percent of parents who are
unemployed: unknown
Percent of K-3 students
experiencing summer learning
loss: 32%
Percent of children from low-income
families: 82%
Mobility rate: 63 %
Percent of children entering
kindergarten prepared: 45%
Percent of parents who are
unemployed: unknown
5050
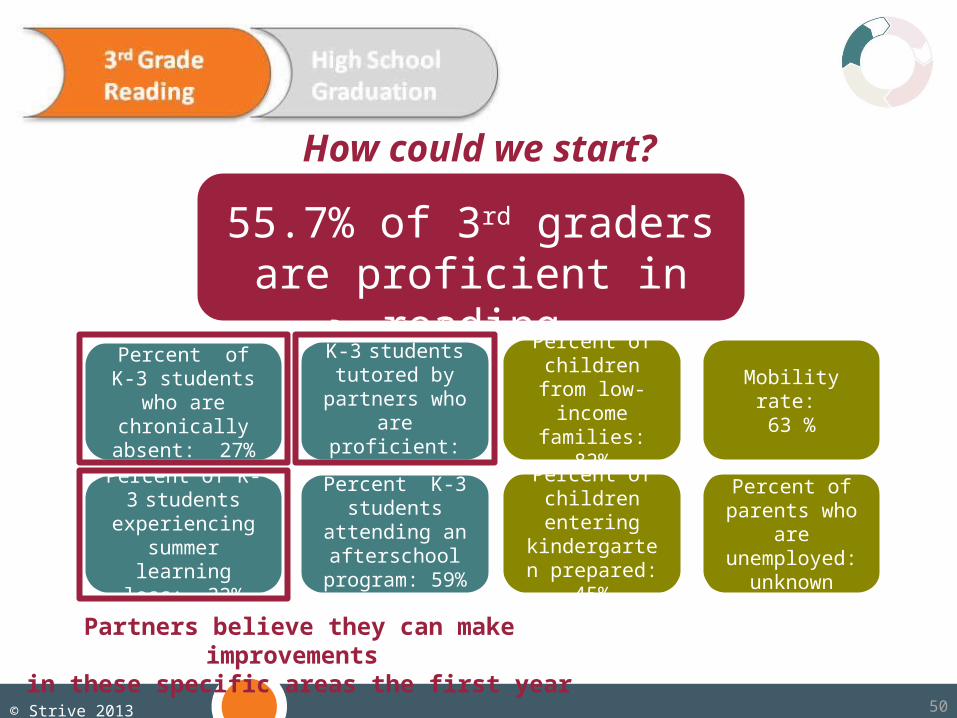
How could we start?
55.7% of 3rd graders are proficient in reading
Percent of K-3
students tutored by partners who
are proficient: TBD
Percent of children from low-income
families: 82%
Mobility rate: 63 %
Percent of K-3 students who are
chronically absent: 27%
© Strive 2013
Percent K-3
students attending an afterschool program: 59%
Percent of children entering
kindergarten prepared: 45%
Percent of parents who are
unemployed: unknown
Percent of K-3
students experiencing
summer learning loss: 32%
Partners believe they can make improvements in these specific areas the first year
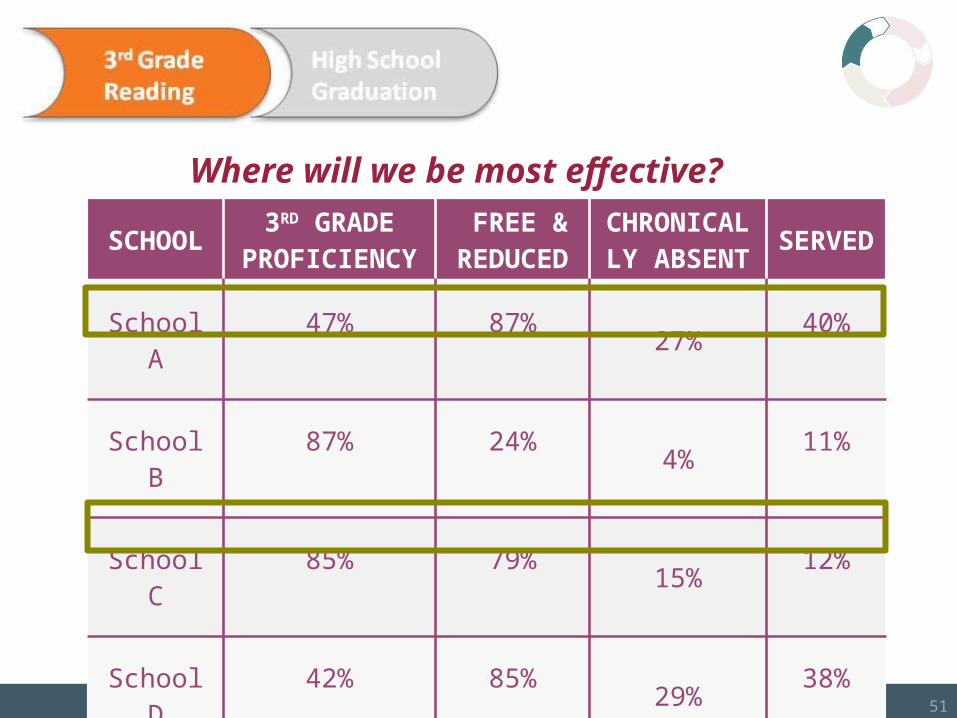
5151
SCHOOL 3RD GRADE PROFICIENCY
FREE & REDUCED
CHRONICALLY ABSENT SERVED
School A
47% 87% 27% 40%
School B
87% 24% 4% 11%
School C
85% 79% 15% 12%
School D
42% 85% 29% 38%
School E
82% 86% 6% 49%
AVERAGE 55.7% 71% 19% 40%
Where will we be most effective?

5252
Kindergarten ready
Reading proficient in 1st Grade
Reading proficient in 2nd Grade
Reading proficient in 3rd Grade
0.0%10.0%20.0%30.0%40.0%50.0%60.0%70.0%80.0%90.0%
100.0%
47.9%
71.1%
44.5%55.7%
% reading proficiency by grade
Per
cen
t o
f S
tud
ents
What other data might we need?
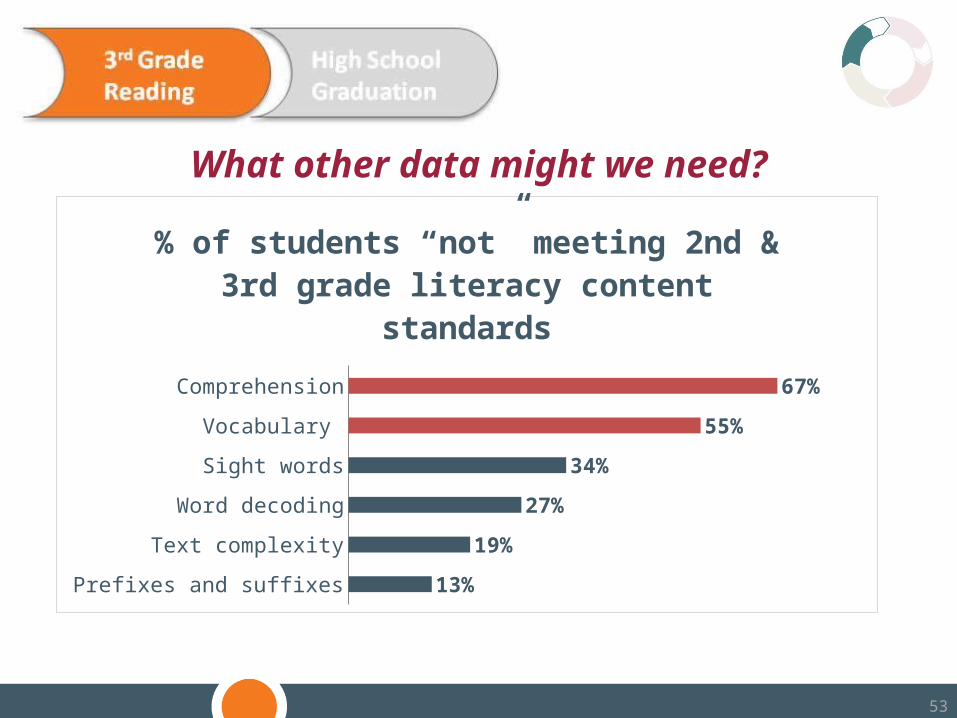
5353
Prefixes and suffixes
Text complexity
Word decoding
Sight words
Vocabulary
Comprehension
13%
19%
27%
34%
55%
67%
% of students “not” meeting 2nd & 3rd grade literacy content standards
What other data might we need?

5454
Kindergarteners 1st Graders 2nd Graders 3rd Graders
-10%
10%
30%
50%
24%
31%26%
19%
% chronic absenteeism by grade
What other data might we need?

5555
What other data might we need?
Kindergarteners 1st Graders 2nd Graders 3rd Graders0%
10%
20%
30%
40%
50%
60%
70%
80%
90%
100%
22%15%
31% 27%
% of K-3 students in summer programs

56
How we are going to get there?

57© Strive 2013|5757© Strive 2013
What is an Action Plan?
Free/Reduced Lunch: 70 %
Graduation Rate: 73 %
ACT Scores: 12.7
An Action Plan is a document that outlines the work the Action Team will complete collectively during a given time frame.
The Action Plan usually covers one year to allow time for the action steps to be implemented and new data to be collected.
The Action Plan includes:-Goals/Targets-Measures-Projects/Strategies-Action Steps • Start/Stop dates• Responsibility linked• Identifies resources• Continuous
improvement

5858
Action Plan Example
© Strive 2013
Projected Outcome
Actual Outcome
Projected Outcome
Actual Outcome
Projected Outcome
Actual Outcome
Projected Outcome
Actual Outcome
56.4% 58% 60% 65% 70%
TBDBaseline
+25%
46% 70%
TBD TBD
Projected Outcome
Actual Outcome
Projected Outcome
Actual Outcome
Projected Outcome
Actual Outcome
Projected Outcome
Actual Outcome
100%
Start Date End Date Existing New
1 All
members8/1/14 8/31/14
2 Tom 8/1/14 8/31/14
Completion of data analysis project to determine baseline measure and identify changes/improvements needed
Progress Measure (2015/16)
Project A: Obtain data to determine the % of children served by partners who entered kindergarten preparedFourth Quarter (6/1/15-
8/31/15)
M3. % of children served (ages 4-5) that demonstrate an increase in readiness (pre to
Baseline Measure (2013/14)
Second Quarter (12/1/14-2/28/15)
Community Level Outcome/Indicator Measures
Progress Measure (2016/17)
Progress Measure (2017/18)
Implementation Timeline
Progress Measure (2014/15)
Third Quarter (3/1/15-5/30/15)
Long Term Goal
Short Term Goal
Short-Term Goal: By September 1, 2015, increase the percent of children served by network partners that enter kindergarten prepared by 25%.
Long-Term Goal: By September 1, 2017 increase the percent of all children in Springfield County entering kindergarten prepared to 70%.
First Quarter (9/1/14-11/30/14)Key Project Progress Milestones (e.g. monthly, quarterly, as
needed)
Review existing parental releases to determine if request can to be made to schools/districts to obtain k-entry data or if new releases will be needed
Contact school/district representatives and determine if data request can be fulfilled or if additional information is needed
M1. % of all students entering kindergarten prepared
M4. # of children (ages 0-3) screened by partners
M2. % of children served that enter kindergarten prepared
Action Steps DeliverablePerson(s)
responsible
Actual Completion
Date
Resources Needed
Springfield Early Childhood Action Team(Timeline: 9/1/2014 - 8/31/2015)

59
Long-term: by 2018, increase the percent of all 3rd graders who are literacy proficient by 10%Short-term: by 2016, increase percent of students served who are reading proficient by 15%
Proficient: 68%
Served proficiency
rate 65%
Set SMART Goals/Targets
Short-term: by 2016, decrease chronic absenteeism rates by 5%
Chronically absent rate
23%

6060
Where are things already working?
© Strive 2013
SCHOOL 3RD GRADE PROFICIENCY
FREE & REDUCED
CHRONICALLY ABSENT SERVED
School A
47% 87% 27% 40%
School B
87% 24% 4% 11%
School C
85% 79% 15% 12%
School D
52% 85% 29% 38%
School E
82% 86% 6% 49%
AVERAGE 55.7% 71% 19% 40%

6161© Strive 2013
10% 20% 30% 40% 50% 60% 70% 80% 90% 100%0%
10%
20%
30%
40%
50%
60%
70%
80%
90%
100%
Two Year Average (SY 2013 & SY 2014)
% of students reading proficient in 3rd grade
Econ
omic
ally
Dis
adva
ntag
ed (%
3rd
gra
ders
el-
igib
le fo
r fre
e/re
duce
d lu
nch)
What could we learn from our local bright spots?
Potential bright spot schools C and E
6262
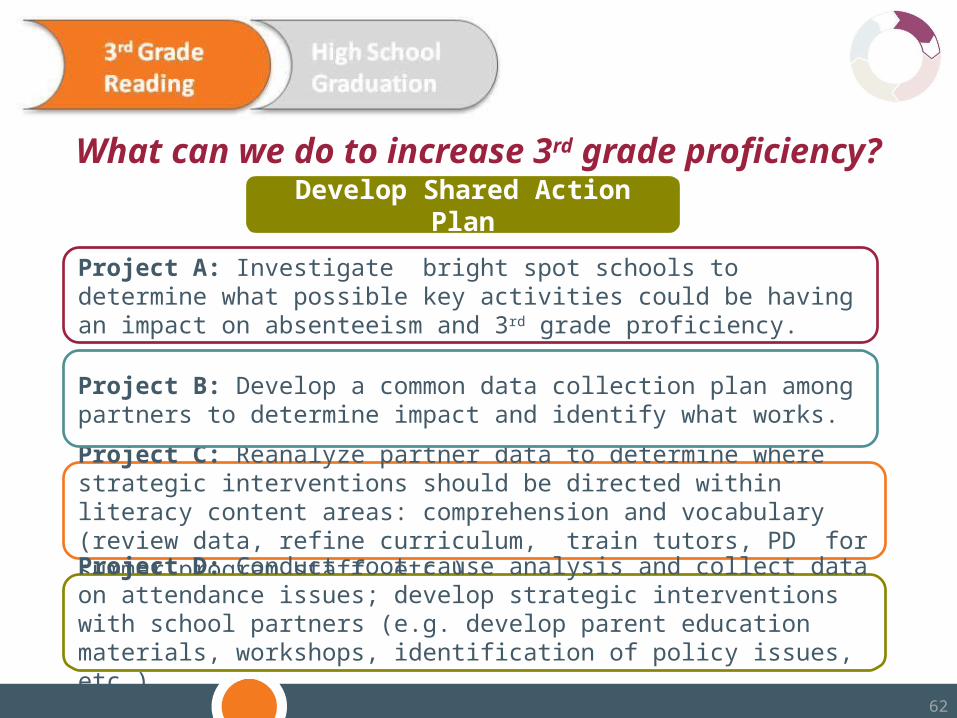
What can we do to increase 3rd grade proficiency?
Project C: Reanalyze partner data to determine where strategic interventions should be directed within literacy content areas: comprehension and vocabulary (review data, refine curriculum, train tutors, PD for summer program staff, etc.)
Develop Shared Action Plan
Project A: Investigate bright spot schools to determine what possible key activities could be having an impact on absenteeism and 3rd grade proficiency.
Project B: Develop a common data collection plan among partners to determine impact and identify what works.
Project D: Conduct root cause analysis and collect data on attendance issues; develop strategic interventions with school partners (e.g. develop parent education materials, workshops, identification of policy issues, etc.)

63© Strive 2013|6363© Strive 2013
Doing the work.

64© Strive 2013|6464© Strive 2013
How are we going to accomplish this?
Teachers & Tutors
Summer Program
Staff
Faith Based Volunteers
Public Library
College / University
StaffWho?
What?Direct access
to student needs
Make curriculum
changes
Provide information to parents
Capacity to help
plan/provide activities
Assist with PD and other
activities
How? Implement the Action Plan to guide the work

65© Strive 2013|6565© Strive 2013
Did we get there?
66
August September October November December0%
10%
20%
30%
40%
50%
60%
70%
80%
90%
100%
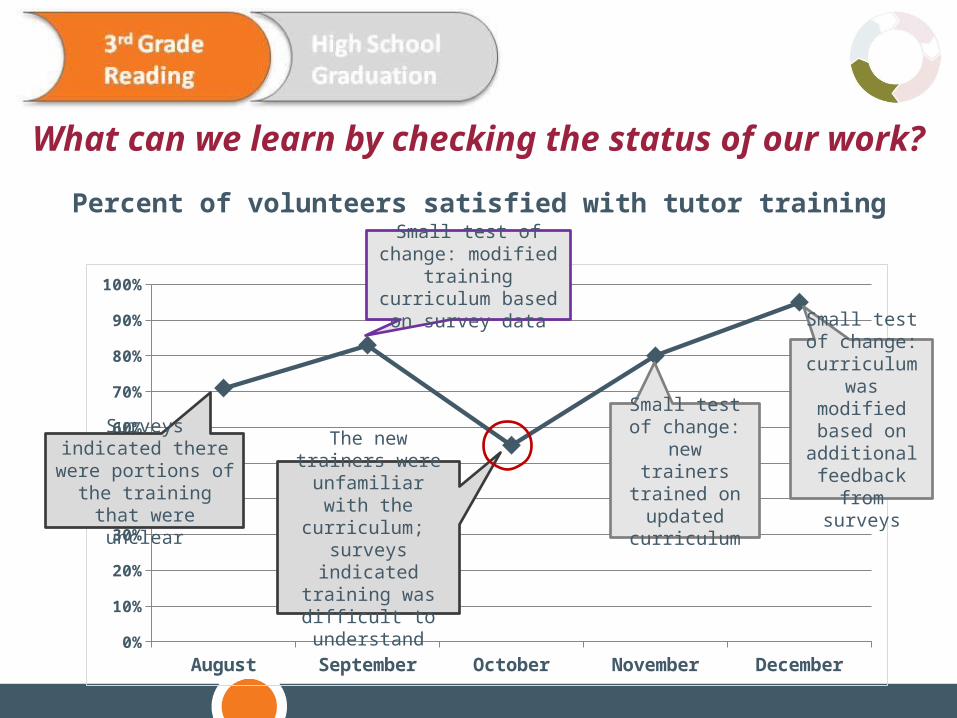
Percent of volunteers satisfied with tutor training
Surveys indicated there were portions of the
training that were unclear
Small test of change:
new trainers trained on updated
curriculum
Small test of change:
curriculum was modified based
on additional feedback from
surveysThe new trainers were unfamiliar with
the curriculum; surveys indicated
training was difficult to understand
Small test of change: modified training
curriculum based on survey data
What can we learn by checking the status of our work?

67
Student name Grade DOB Race/
Ethnicity
Free/ Reduced
Lunch Status
Tutoring start date
# of 1:1 hours tutored
# of tutors
% of days attending an after-school
program
Enrolled into a summer program MAP literacy scores
Data tracked/collected by partners (with parental consent if applicable) Data obtained from school/district
Types of Service Nparm DF ChiSquare P Value
30+ hours of 1:1 literacy tutoring 1 1 45.05007 0.0001
Attended an after-school program 1 1 0.064657 1.675
1-2 tutors assigned 1 1 0.461156 0.00012
More than 3 tutors 1 1 3.43025 1.8964
Completed a summer program 1 1 63.431675 0.0014
Regardless of race or socio-economic status - students who had 30+ hours of 1:1 tutoring, no more than 2 tutors, and who completed a partner summer program were 87% more likely to make literacy gains.
Effect likelihood ratio tests (p< .05)
What can we learn by our data collection plan?
68© Strive 2013|6868© Strive 2013
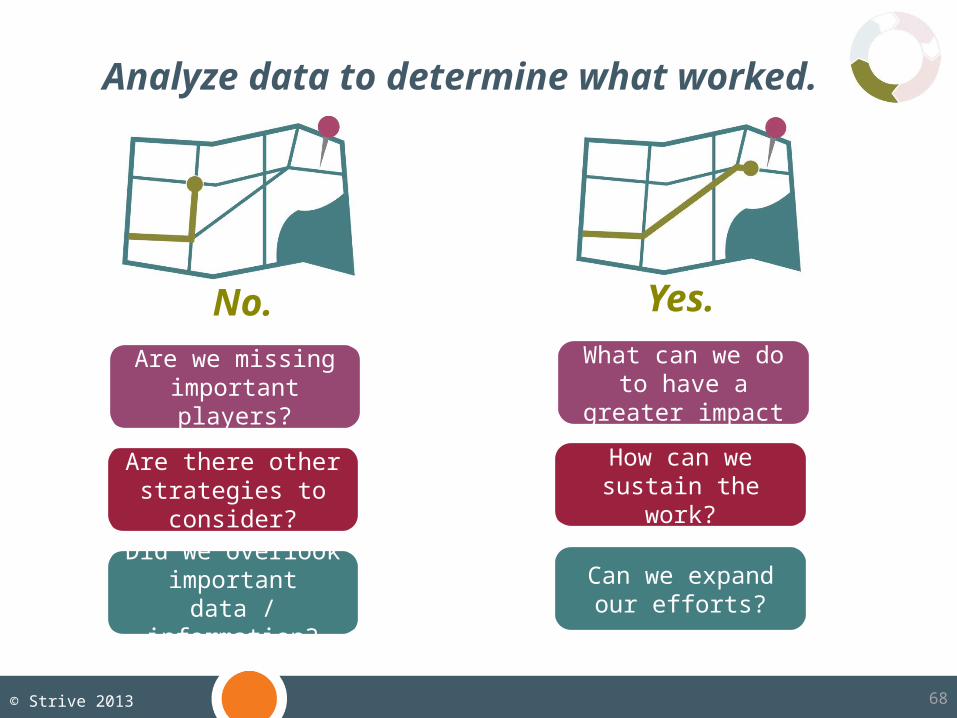
Analyze data to determine what worked.
Yes.No.
What can we do to have a greater impact
Are we missing important players?
How can we sustain the work?
Are there other strategies to consider?
Did we overlook important data /
information?
Can we expand our efforts?

69
Continuously improve.

7070
Questions?
FAFSA completion:
24 %
ACT Scores: 12.7

7171
Review of KSEP Data
ACT Scores: 12.7
© Strive 2013

KSEP Trend: Readiness
2012-13 2013-14 2014-150%
10%
20%
30%
40%
50%
60%
70%
80%
90%
100%
37% 37% 38%
63% 63% 62%
KSEP “Ready” vs. “Not Ready” Trend
Ready to Go Not Ready

KSEP Trend: Classification
Immediate Follow Up
Monthly Monitor Quarterly Monitor Ready to Go0%
5%
10%
15%
20%
25%
30%
35%
40%
45%
50%
7%
23%
34%37%
7%
23%
34%37%
6%
22%
34%38%
KSEP Classification Trend
2012-13 2013-14 2014-15
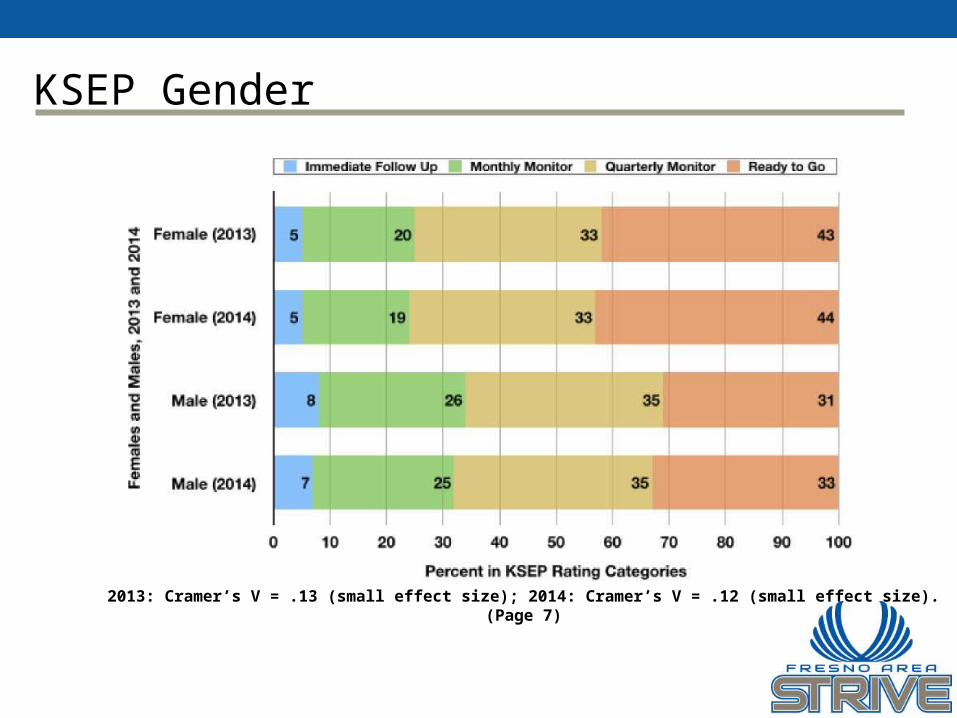
KSEP Gender
2013: Cramer’s V = .13 (small effect size); 2014: Cramer’s V = .12 (small effect size).(Page 7)

KSEP Ethnicity
2013 Cramer’s V = .12 (small effect size); 2014: Cramer’s V = .09 (small effect size)(Page 9)

KSEP Preschool Attendance
2013: Cramer’s V = .13 (small effect size); 2014: Cramer’s V = .20 (medium effect size).(Page 11)

KSEP Length at Preschool
2013: Cramer’s V = .16 (small effect); 2013: Cramer’s V = .09 (small effect).(Page 12)
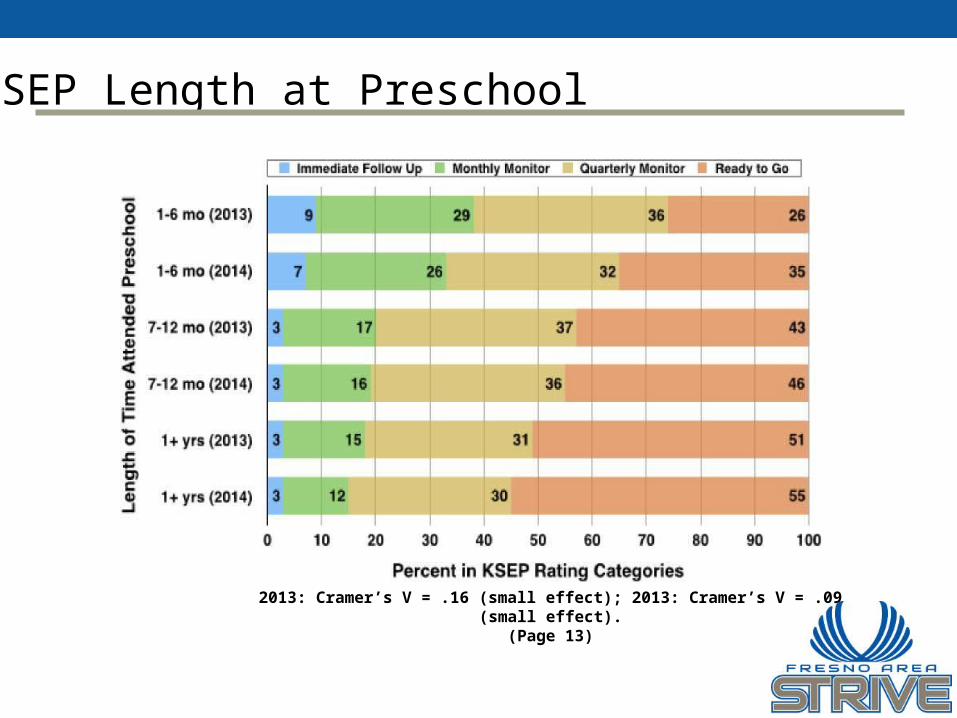
KSEP Length at Preschool
2013: Cramer’s V = .16 (small effect); 2013: Cramer’s V = .09 (small effect).(Page 13)

KSEP Type of Preschool
2013: Cramer’s V = .11 (small effect); 2014: Cramer’s V = .06 (small effect).(Page 15)

8080
FAFSA completion:
24 %
ACT Scores: 12.7
Preliminary Data AnalysisBased on the KSEP data reviewed:• What is this data telling us?• What is this data not telling us?• What data/information is missing?
© Strive 2013

8181
FAFSA completion:
24 %
ACT Scores: 12.7
Focusing the WorkGaps• Based on the data we have, what are we seeing as
the primary gaps?• Do we know what has worked in the past to address
these?• What else will we need to know?
Priorities• How could we begin to prioritize?• Where could we initially focus the work?• Are we missing any key players?
© Strive 2013

82
ACTION COMMITMENTS

83
CHECK-OUT: What is your personal and/or
organizational action commitment coming out of today’s meeting?

8484
Stay Connected