1 Forecasting with VAR. 2 Sample 3 VAR Model 4 Estimated model: Top.
29
1 Forecasting with VAR
-
date post
20-Dec-2015 -
Category
Documents
-
view
221 -
download
2
Transcript of 1 Forecasting with VAR. 2 Sample 3 VAR Model 4 Estimated model: Top.

1
Forecasting with VAR

2
Sample
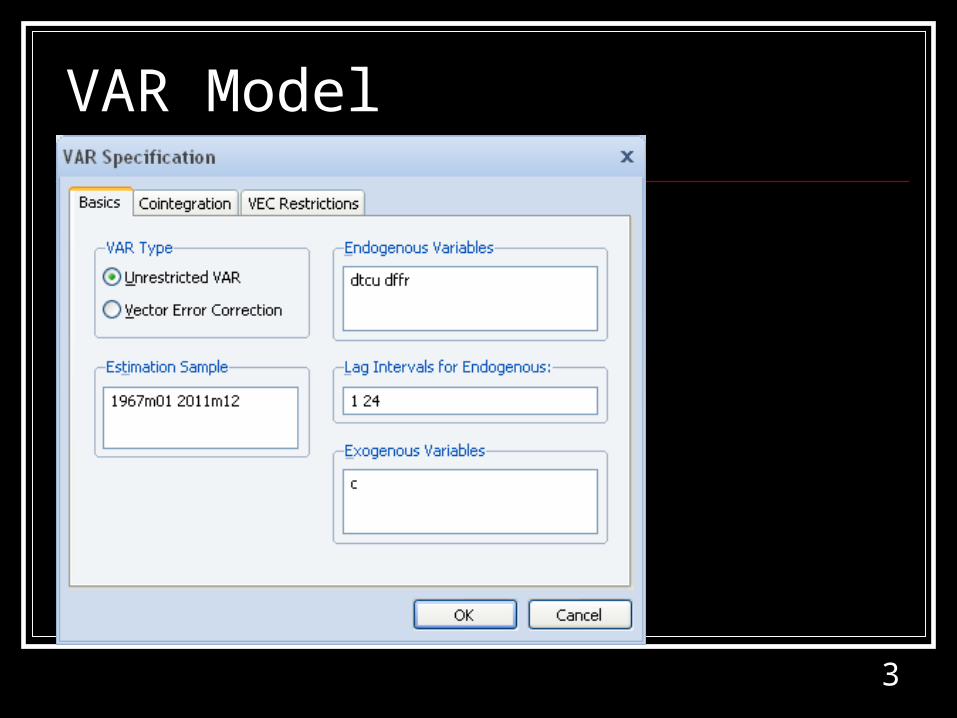
3
VAR Model

4
Estimated model: Top

5
Estimated model: bottom

6
Impulse Response functions

7
-.1
.0
.1
.2
.3
.4
.5
.6
1 2 3 4 5 6 7 8 9 10
Response of DTCU to DTCU
-.1
.0
.1
.2
.3
.4
.5
.6
1 2 3 4 5 6 7 8 9 10
Response of DTCU to DFFR
-.2
.0
.2
.4
.6
1 2 3 4 5 6 7 8 9 10
Response of DFFR to DTCU
-.2
.0
.2
.4
.6
1 2 3 4 5 6 7 8 9 10
Response of DFFR to DFFR
Response to Cholesky One S.D. Innovations ± 2 S.E.
Impulse Response graphs
8
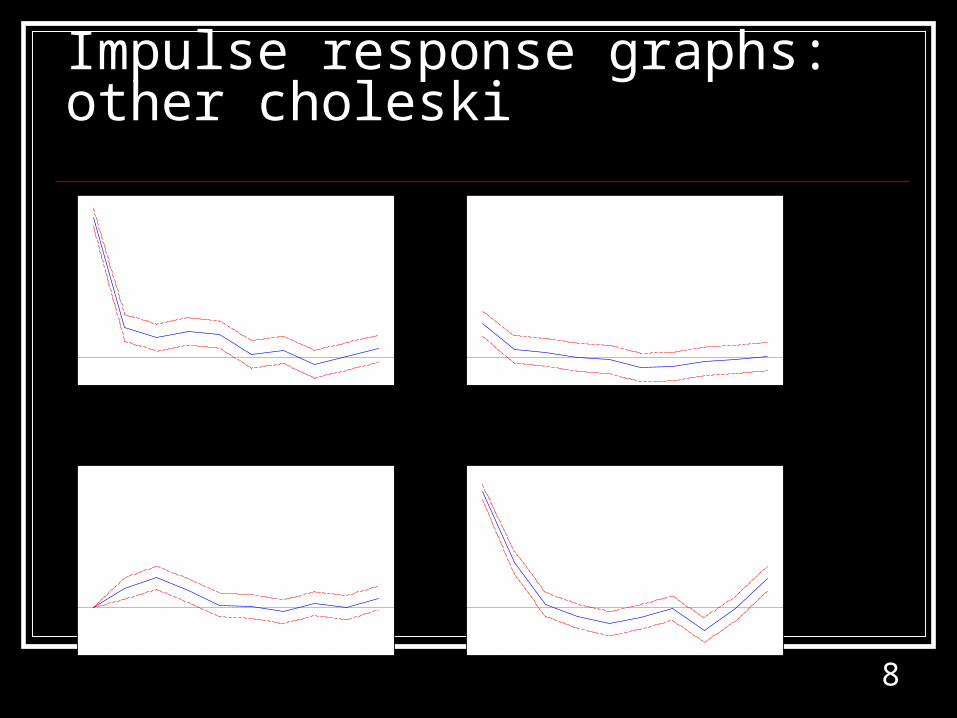
Impulse response graphs: other choleski
-.1
.0
.1
.2
.3
.4
.5
.6
1 2 3 4 5 6 7 8 9 10
Response of DTCU to DTCU
-.1
.0
.1
.2
.3
.4
.5
.6
1 2 3 4 5 6 7 8 9 10
Response of DTCU to DFFR
-.2
.0
.2
.4
.6
1 2 3 4 5 6 7 8 9 10
Response of DFFR to DTCU
-.2
.0
.2
.4
.6
1 2 3 4 5 6 7 8 9 10
Response of DFFR to DFFR
Response to Cholesky One S.D. Innovations ± 2 S.E.

9
10
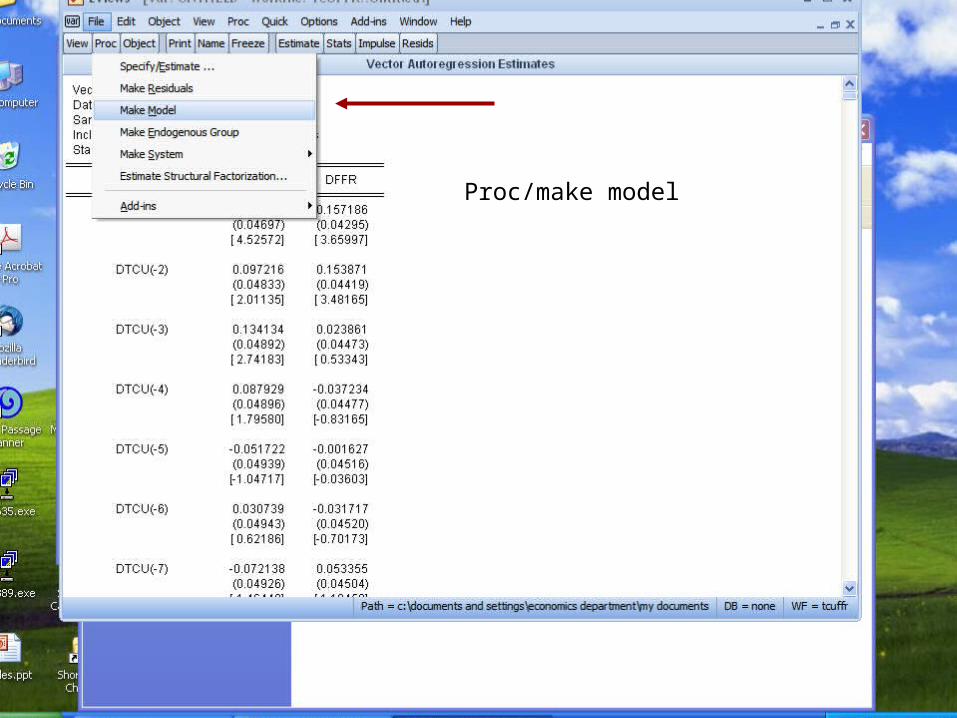
Proc/make model

11
Model
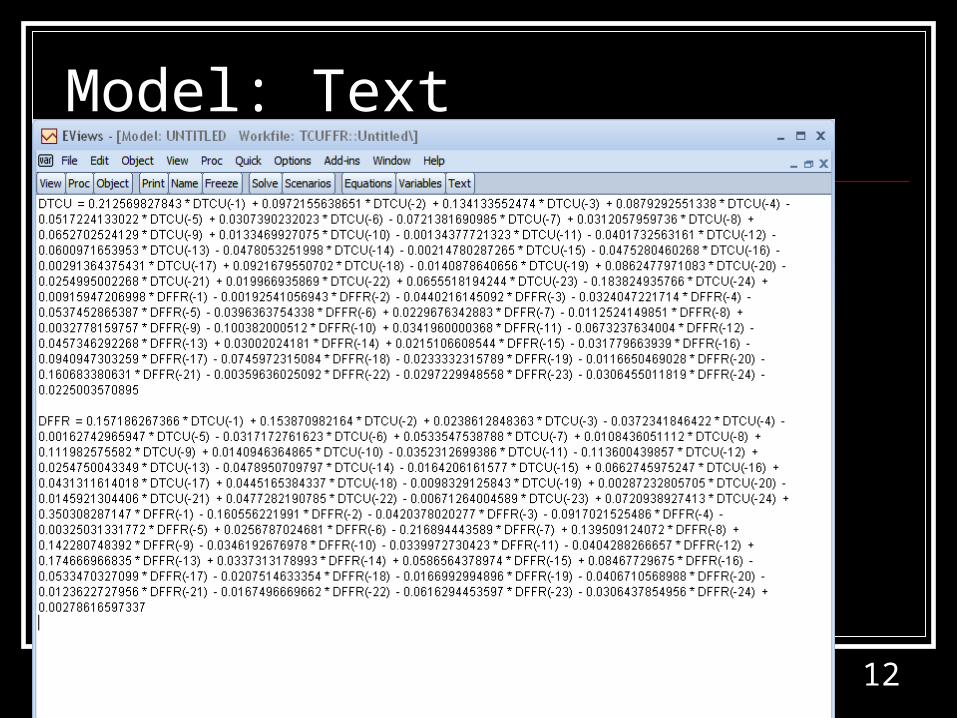
12
Model: Text
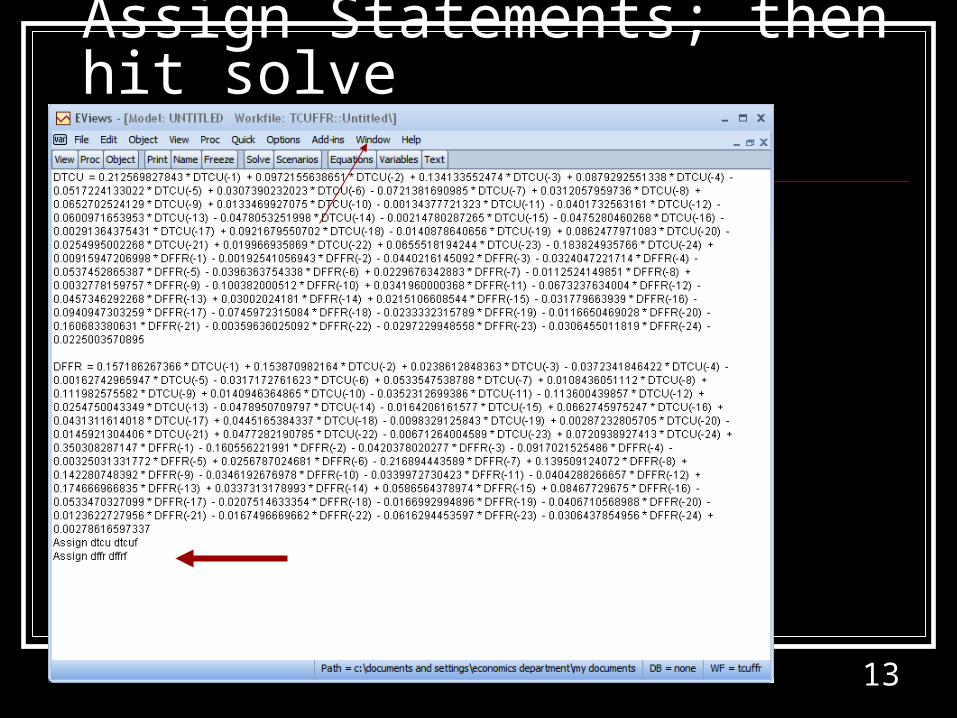
13
Assign Statements; then hit solve

14
Solve Window

15

16
Workfile Window

17

18
Forecast of dtcu: dtcu_0, 2011.05 -2011.12

19

20
Gen dtcuf=ser01

21
-4
-3
-2
-1
0
1
2
1970 1975 1980 1985 1990 1995 2000 2005 2010
DTCU DTCUF
dtcu & dtcuf

22
Dffr forecast: dffr_0
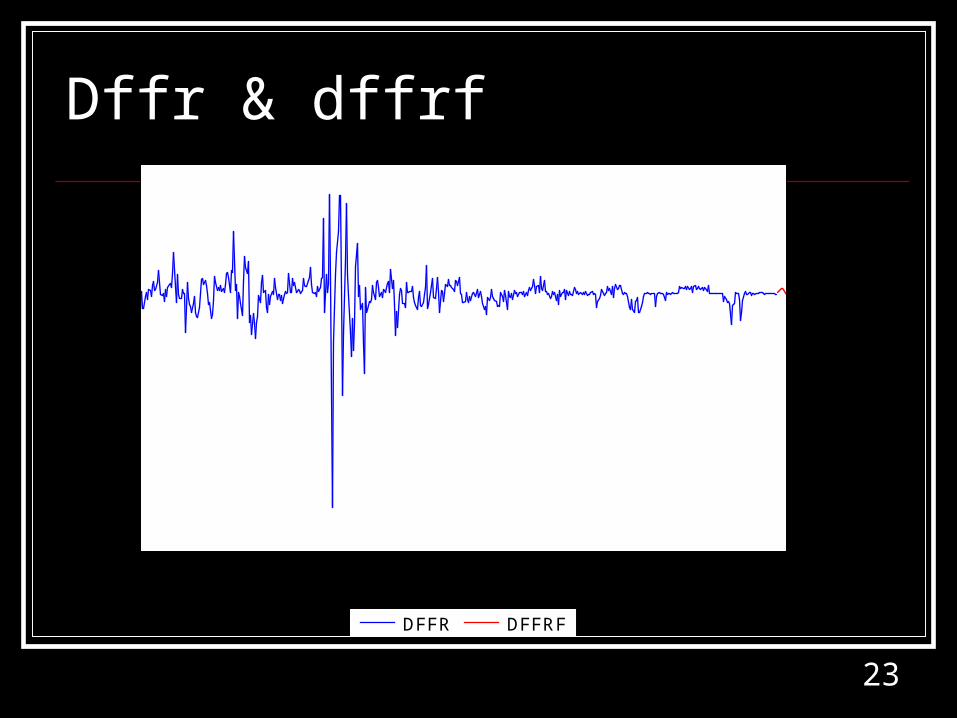
23
Dffr & dffrf
-8
-6
-4
-2
0
2
4
1970 1975 1980 1985 1990 1995 2000 2005 2010
DFFR DFFRF
24
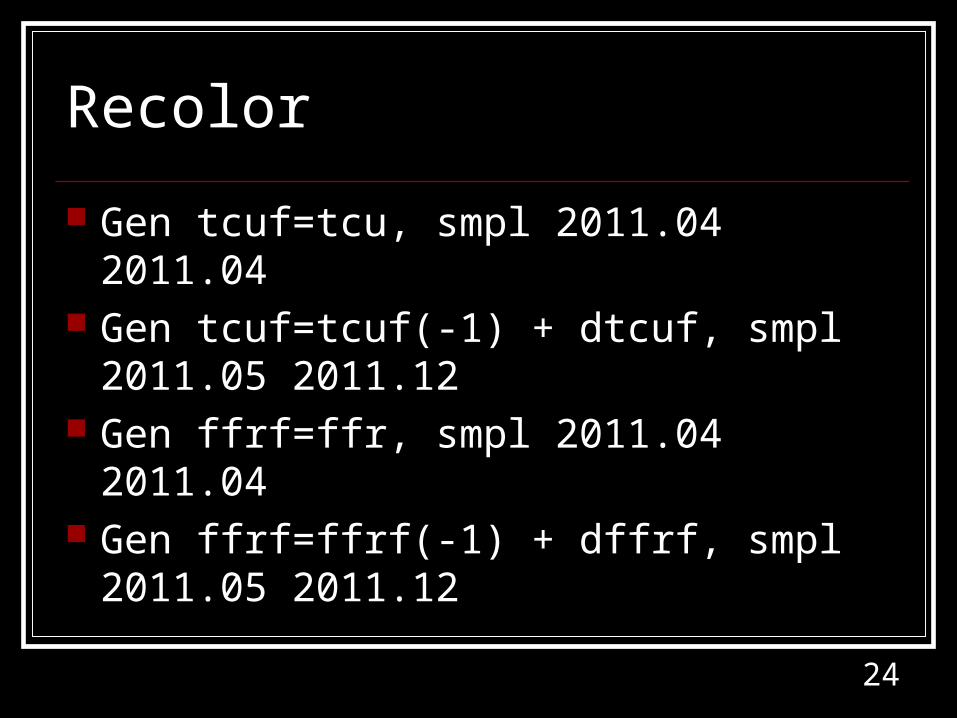
Recolor
Gen tcuf=tcu, smpl 2011.04 2011.04 Gen tcuf=tcuf(-1) + dtcuf, smpl 2011.05
2011.12 Gen ffrf=ffr, smpl 2011.04 2011.04 Gen ffrf=ffrf(-1) + dffrf, smpl 2011.05
2011.12

25

26

27
65
70
75
80
85
90
1970 1975 1980 1985 1990 1995 2000 2005 2010
TCU TCUF
VAR forecast of Total industry capacity utilization for rest of 2011

28
0
4
8
12
16
20
1970 1975 1980 1985 1990 1995 2000 2005 2010
FFR FFRF
VAR Forecast of federal funds rate for the rest of 2011

29