1 Food Stamp Program Participation and Food Insecurity: An Instrumental Variables Approach Steven T....
46
1 Food Stamp Program Participation and Food Insecurity: An Instrumental Variables Approach Steven T. Yen The University of Tennessee Margaret Andrews Economic Research Service, USDA Zhuo Chen The Centers for Disease Control David B. Eastwood The University of Tennessee
-
Upload
shon-oconnor -
Category
Documents
-
view
214 -
download
0
Transcript of 1 Food Stamp Program Participation and Food Insecurity: An Instrumental Variables Approach Steven T....

1
Food Stamp Program Participationand Food Insecurity:
An Instrumental Variables Approach
Steven T. YenThe University of Tennessee
Margaret AndrewsEconomic Research Service, USDA
Zhuo ChenThe Centers for Disease Control
David B. EastwoodThe University of Tennessee

2
Overview
Food Stamp Program (FSP) is a major USDA food program.
Food insecurity (FI) is an important measure of welfare.
We investigate• relationship between FSP participation (binary)
and FI (censored);• effects of policy/socio-demographic variables on
FSP participation and FI.
2

3
Overview …
Motivated by mixed results from previous studies:• insignificant/positive effects of FSP on FI;
• insignificant/negative effect of FI on FSP;
• inefficient 2-step estimates
Estimation by maximum-likelihood method (more efficient)
4
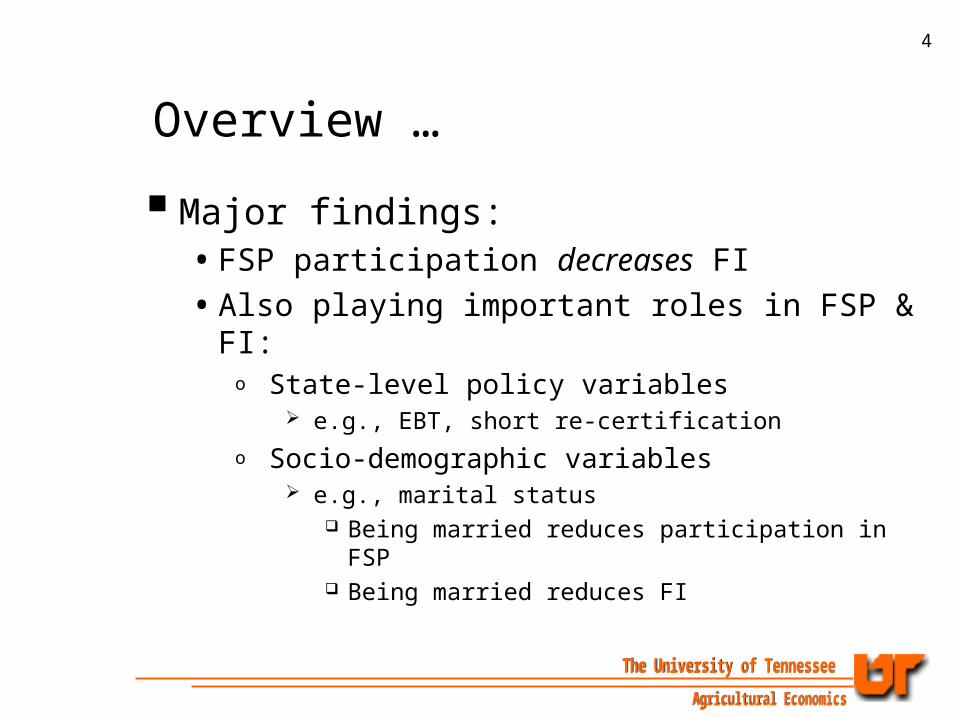
Overview …
Major findings:• FSP participation decreases FI
• Also playing important roles in FSP & FI:o State-level policy variables
e.g., EBT, short re-certification
o Socio-demographic variables e.g., marital status
Being married reduces participation in FSP Being married reduces FI

5
Introduction: USDA Food Programs
USDA implements 16 Food Assistance and Nutrition Programs• to provide low-income families and children with
access to a healthy diet.
The 16 programs were funded at $42.9 billion in FY 2004.
1 in 5 Americans participated in one/more programs at some point each year.

6
Introduction: Food Insecurity in America
Most recent USDA food security survey indicates that• 3.5% of U.S. households (3.8 million people) were
food insecure with hunger;
• 7.6% (8.3 million people) were food insecure without hunger.
NFSPS sample (1996-97, “low-income”): 26.6% were food insecure during past 30 days.
7
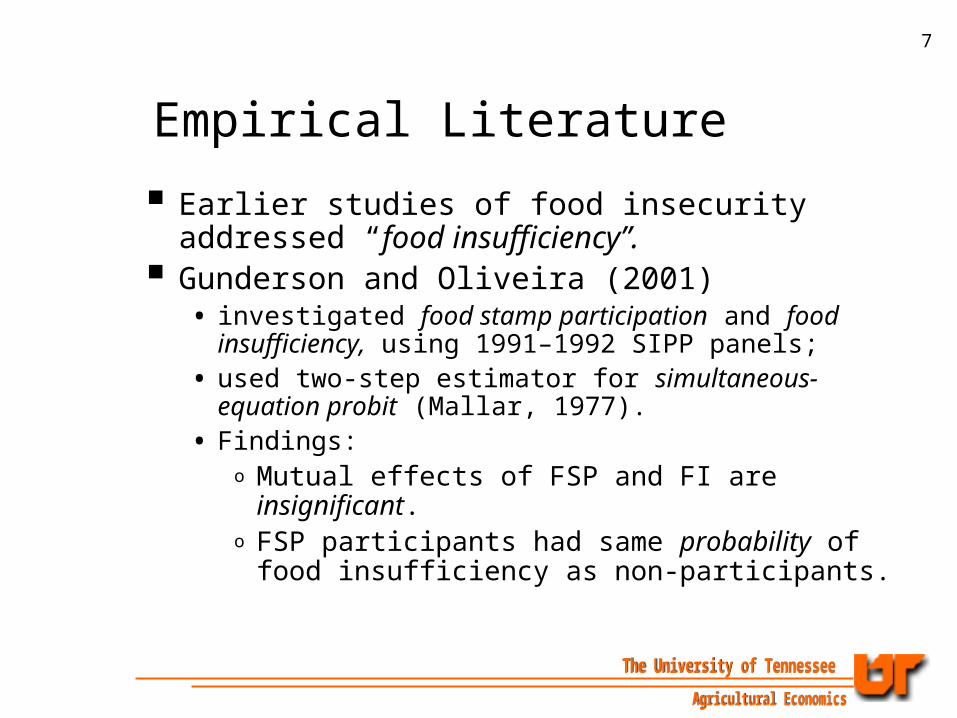
Empirical Literature
Earlier studies of food insecurity addressed “food insufficiency”.
Gunderson and Oliveira (2001)• investigated food stamp participation and food
insufficiency, using 1991–1992 SIPP panels;• used two-step estimator for simultaneous-equation probit
(Mallar, 1977).• Findings:
o Mutual effects of FSP and FI are insignificant.o FSP participants had same probability of food
insufficiency as non-participants.
8
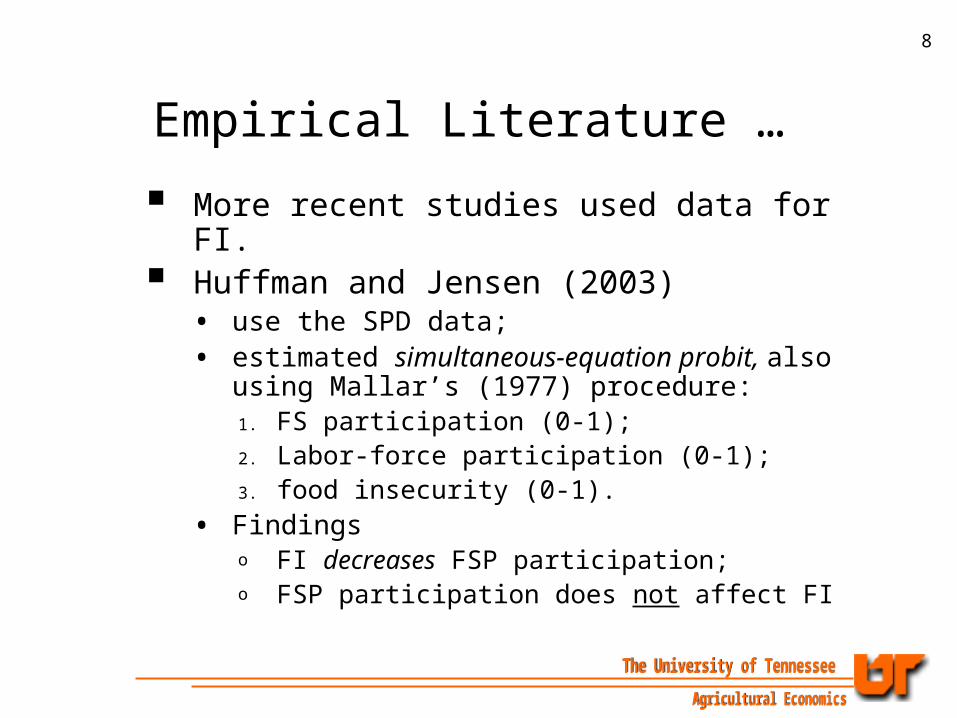
Empirical Literature …
More recent studies used data for FI. Huffman and Jensen (2003)
• use the SPD data;• estimated simultaneous-equation probit, also using
Mallar’s (1977) procedure:1. FS participation (0-1);2. Labor-force participation (0-1);3. food insecurity (0-1).
• Findingso FI decreases FSP participation;o FSP participation does not affect FI

9
Empirical Literature …
Jensen (2002) estimated the FSP participation (0-1) and food insecurity (0,1,2,3), in a 2-equation SUR system• Finding: FI and FSP “are affected in the same
direction by random shocks or unmeasured effects.”
(drawing on significant error correlation)

10
Empirical Literature …
Based on the 1995 and 1999 Food Security Supplements to the CPS, Nord (2001) found: households receiving food stamps registered almost no change in the measured prevalence of FI or hunger during the period.
Only one study has shown a clear positive association between FI and the use of public assistance. Borjas (2004) shows that a 10% cut in the fraction of the population that receives public assistance increased the percent of FI households by about 5%.

11
Empirical Literature …
Kabbani and Yazbeck (2004) pooled multiple years of data from the CPS and, using a two-stage estimation procedure to control for the endogeneity of the program participation decision, Results suggest that participation in the FSP appears to moderate the observed differences for households with children aged 5 to 18, but not significantly.

12
Empirical Literature …
Kabbani and Kmeid (2005)• Logit analysis• Sample: CPS; FSP-eligible households that experienced
hunger during the year• Dependent variable (0-1): experienced hunger during the
last 30 days• Results:
o FSP participation (0-1; exogenous) does not affect the odd of hunger
o FSP amount (exogenous) significantly reduces the odd of hunger

13
Empirical Literature …
Apparent inconsistency among previous results suggests …
that a more careful investigation between FSP participation & FI is needed.

14
This Study
Investigates• relationship between FSP and FI;
• effects of socio-demographic variables on FSP and FI,
using an instrumental variables approach.

15
This Study …
NFSPS 1996-97 data offer a unique opportunity for such a pursuit:• include the 18 items of the food security module (used for
annual monitoring of FI);• include follow-up questions that allow examination of FI
status in the past 30 days;• variations in state-level variables:
o EBT adoption;o re-certification periods
provide better instruments than those used in previous studies (except Kabbani and Wilde, 2003; Kabbani and Yazbeck, 2004, 2005)

16
This Study …
Methodology: accommodates endogeneity of FSP in the FI equation
Results• FSP improves (–) FI.

17
Econometric ModelsA simple equation for FI (y2)
(1) *2 1 1 2 3y y v ¢ ¢ ¢= + + + +x w r
where x affects both FI and FS (y1), w determines FI (only), and r is a vector of unobservable characteristics which affect both FI and FS. If estimate
(2) 2 1 1 2y y v ¢ ¢= + + +x w , where
(3) *3v v¢= +r
OLS estimate ̂ is biased because
1( | , ) 0E v y ¹x
An instrumental variables model
(4) * *2 1 1 2 2y y u ¢ ¢= + + +x w
(5) *1 1 2 1y u¢ ¢= + +x z
where z determines FS participation only.

18
Econometric Models …(1)
21 1 2
22 1 2 2
where .u
u
é ùé ùê úê ú = ê úê úë û ë û
N
Reduced form:
(2) * *2 1 1 2 2 2
*2 1 2
( ) ( )
where
y u
u u u
¢ ¢ ¢= + + + +
= +
x z w
(3)
1*2
21 1 2
2 2 2 21 1 2 1 1 2 1 1 2
21
1 121 2 2
where
2
, 1
u
u
é ùê úê úë û
é ù+ê úê ú+ + +ë ûé ùê ú= = =ê úë û
N

19
Econometric Model …To accommodate censored FI (y2) and binary FSP (y1):
(1)
*1 1
* *2 2 2
1 if 0
0 otherwise
if 0
0 otherwise.
y y
y y y
= >
=
= >
=
Let
1 1 2
2 1 1 2 2 1 1
[ , ,0] , [ , , ] ,
[( ) , , ] , 2 1y
¢ ¢ ¢ ¢ ¢ ¢¢= =
¢ ¢ ¢¢= + = -
H x z w
Sample likelihood function
2
2
21 1 1
0 2
2 2 1 2 2 21 2 1/ 2
0 2 2
, ;
( ) /1
(1 )
y
y
L
y y
=
>
æ ö¢- ÷ç ¢= - ÷ç ÷ç ÷çè ø
æ ö æ ö¢ ¢ ¢- + -÷ ÷ç ç÷ ÷ç ç÷ ÷ç ç ÷÷ç -è øè ø
Õ
Õ
HH
H H H
20
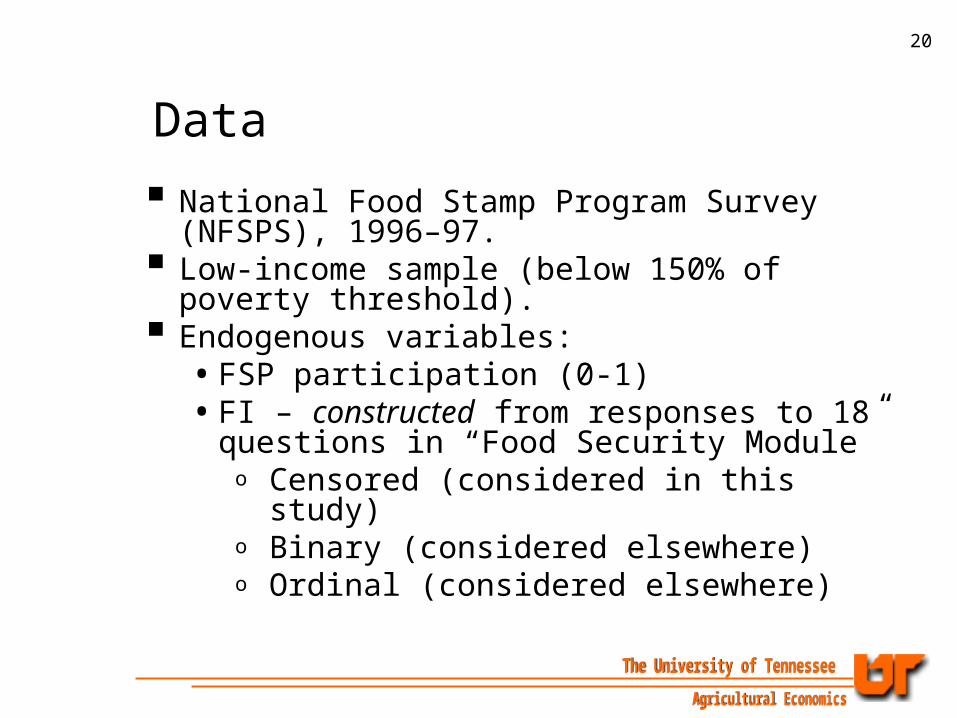
Data
National Food Stamp Program Survey (NFSPS), 1996–97.
Low-income sample (below 150% of poverty threshold).
Endogenous variables:• FSP participation (0-1)• FI – constructed from responses to 18 questions
in “Food Security Module”o Censored (considered in this study)o Binary (considered elsewhere)o Ordinal (considered elsewhere)

21
Data …Food Security Module: Sample Questions
3. “The food that (I/we) bought just didn’t last, and (I/we) didn’t have money to get more.” Was that often, sometimes, or never true for (you/your household) in the last 12 months?
[ ] Often true [ ] Sometimes true [ ] Never true [ ] DK or Refused
4. “(I/we) couldn’t afford to eat balanced meals.” Was that often, sometimes, or never true for (you/your household) in the last 12 months?
[ ] Often true [ ] Sometimes true [ ] Never true [ ] DK or Refused

22Table 1. Summary Statistics (Means)
Variable Definition
Participants Non-
participants FI 30-day adult-scale FI score, censored at 0 1.94 1.69 Among the food insecure 7.36 6.88 % food insecure 26.22 26.15 Income Household gross income, in $10,000 0.08 0.07 Shop frequency Shopping frequency (times per week?) 0.22 0.26 Dep. children Number of dependent children < 13 years old 0.82 1.25 EBT percentage % of FSP benefits issued by EBT in residence state 0.14 0.11 Travel time Time to store where most food shopping is done (hr.) 0.39 0.37 Immigrants Population share of admitted immigrants per 1,000
population 3.06 3.14
Avoid telling people Have avoided telling people about receiving food
stamps 0.28 0.23
Shop where unknown Have gone out of their way to shop at a store where no one knows them
0.20 0.11
Disrespect shopping Have been treated disrespectfully when shopping with food stamps in a store
0.26 0.24
Disrespect telling Have been treated disrespectfully when they told people they received food stamps
0.21 0.12
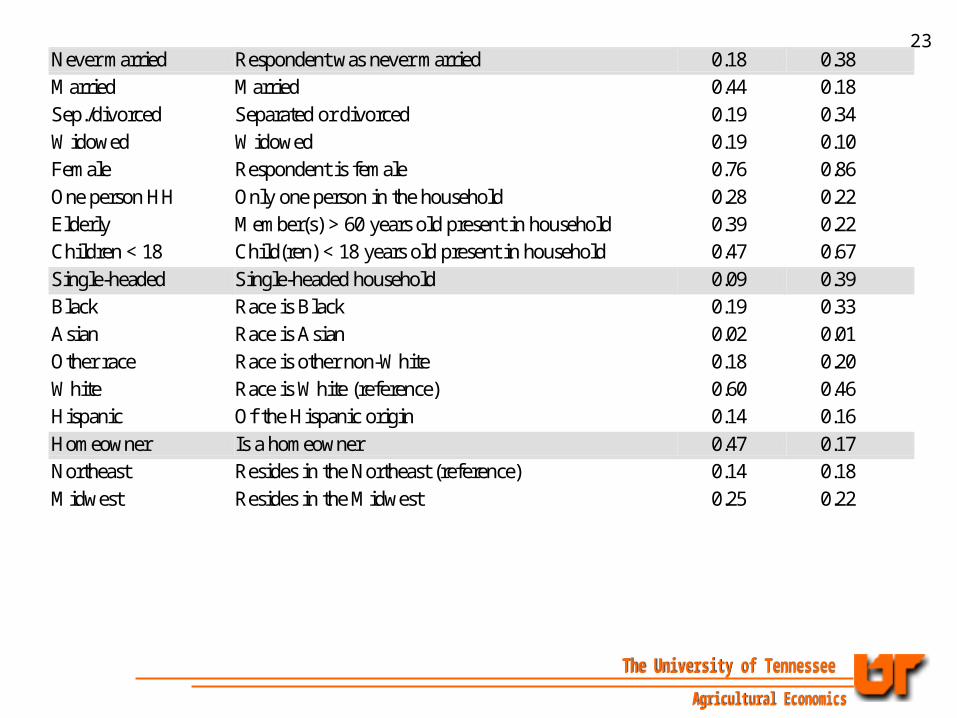
23Never married Respondent was never married 0.18 0.38
Married Married 0.44 0.18
Sep./divorced Separated or divorced 0.19 0.34 Widowed Widowed 0.19 0.10
Female Respondent is female 0.76 0.86
One person HH Only one person in the household 0.28 0.22
Elderly Member(s) > 60 years old present in household 0.39 0.22 Children < 18 Child(ren) < 18 years old present in household 0.47 0.67
Single-headed Single-headed household 0.09 0.39
Black Race is Black 0.19 0.33
Asian Race is Asian 0.02 0.01
Other race Race is other non-White 0.18 0.20
White Race is White (reference) 0.60 0.46
Hispanic Of the Hispanic origin 0.14 0.16
Homeowner Is a homeowner 0.47 0.17 Northeast Resides in the Northeast (reference) 0.14 0.18
Midwest Resides in the Midwest 0.25 0.22

24South Resides in the South 0.22 0.24 West Resides in the West 0.39 0.36
Urban Resides in an urban area 0.52 0.56 Rural Resides in a rural area 0.19 0.15 Suburb Resides in a suburban area (reference) 0.29 0.29
Dissatisfied-shop Dissatisfied with shopping in the neighborhoods 0.22 0.29 Short recertification Estimated certification period less than 6 months 0.24 0.15 Sample size 267 1912
Note: Total sample size is 2179. All sample statistics are weighted; see text for details.
Among the food insecure, the FI score ranges from 4.92 to 10.85.

25
Results
Study Outcome
Variable FSP FI
This study FI
FSP –Hoffman-Jensen
FI
FSP–
n.s.
Gundersen-Oliveira
FI
FSP
n.s.
n.s.

26
Table 2. Maximum Likelihood Estimates of FSP Participation and FI Equations
FSP Participation FI Variable Estimate S.E. Estimate S.E. Latent variable FSP –3.604*** 1.335 Other explanatory variable Avoid telling people 0.183** 0.094 Shop where unknown –0.340*** 0.113 Disrespect shopping –0.073 0.080 Disrespect telling –0.510*** 0.094 EBP percentage –0.087 0.105 Short recertification –0.206** 0.094 Immigrants –0.019 0.017 Travel time 0.545 0.501 Dissatisfied–shop 3.525*** 0.587

27
Shopping frequency ( 10) 1.750*** 0.332 3.584 3.863 Income –1.958*** 0.621 3.355 6.169 Elderly 0.033 0.088 –3.904*** 0.819 Urban –0.136* 0.082 –1.161 0.731 Rural –0.019 0.097 –1.046 0.897 Dep. children 0.060* 0.035 0.249 0.312 Children < 18 0.229** 0.118 –0.572 1.100 Homeowner –0.683*** 0.075 –4.608*** 1.144 Female 0.144* 0.082 –0.317 0.792 One-person HH 0.019 0.106 0.886 0.983 Married –0.578*** 0.097 –3.636*** 1.182 Sep./divorced –0.022 0.090 1.496** 0.722 Widowed –0.390*** 0.120 1.369 1.181 Single-headed 0.635*** 0.105 0.966 1.232

28 Asian –0.229 0.305 –4.388 2.732 Black 0.189** 0.084 0.471 0.793 Other race –0.086 0.205 3.844** 1.664 Hispanic 0.127 0.219 –3.840** 1.789 Midwest –0.227** 0.113 –1.393 0.967 South –0.046 0.110 0.277 0.906 West –0.092 0.119 –0.864 0.913 Constant 0.500*** 0.193 –2.395 1.665 σ 9.500*** 0.529 ρ 0.277** 0.136 Log likelihood –3754.159
Note: Asterisks indicate levels of significance: *** = 1%, ** = 5%, * = 10%.

29
Results …
E(FI|FI>0,FSP=0) E(FI|FI>0,FSP=1) Difference
5.81 5.41 0.40
(s.e.=0.22) (0.19) (0.15)
Effect of FSP participation on FI
Sample: Mean = 7.36; SD=1.84 (FI>0, FSP=0)
Mean = 6.88; SD=1.68 (FI>0, FSP=1)

30
Marginal Effects on Probabilities
Variable Pr(FSP=1) Pr(FI>0)
Continuous Variables
Income – +
Dep. children + n.s.
Shop freq + n.s.

31
Marginal Effects on Probabilities …
Variable Pr(FSP=1) Pr(FI>0)
Discrete Variables
Avoid telling + –
Shop / unknown – +
Disrespect telling – +
Elderly n.s. –
Urban – n.s.

32
Marginal Effects on Probabilities …
Variable Pr(FSP=1) Pr(FI>0)
Discrete Variables
Children < 18 + n.s.
Homeowner – –
Married – –
Sep./Divorced n.s. +
Widowed – +

33
Marginal Effects on Probabilities …
Variable Pr(FSP=1) Pr(FI>0)
Discrete Variables
Female + n.s.
Single-headed + n.s.
Asian n.s. –
Black + n.s.
Other race n.s. +

34
Marginal Effects on Probabilities …
Variable Pr(FSP=1) Pr(FI>0)
Discrete Variables
Midwest – n.s.
South n.s. +
Short resertification – +
Dissatisfaction shop + +
35
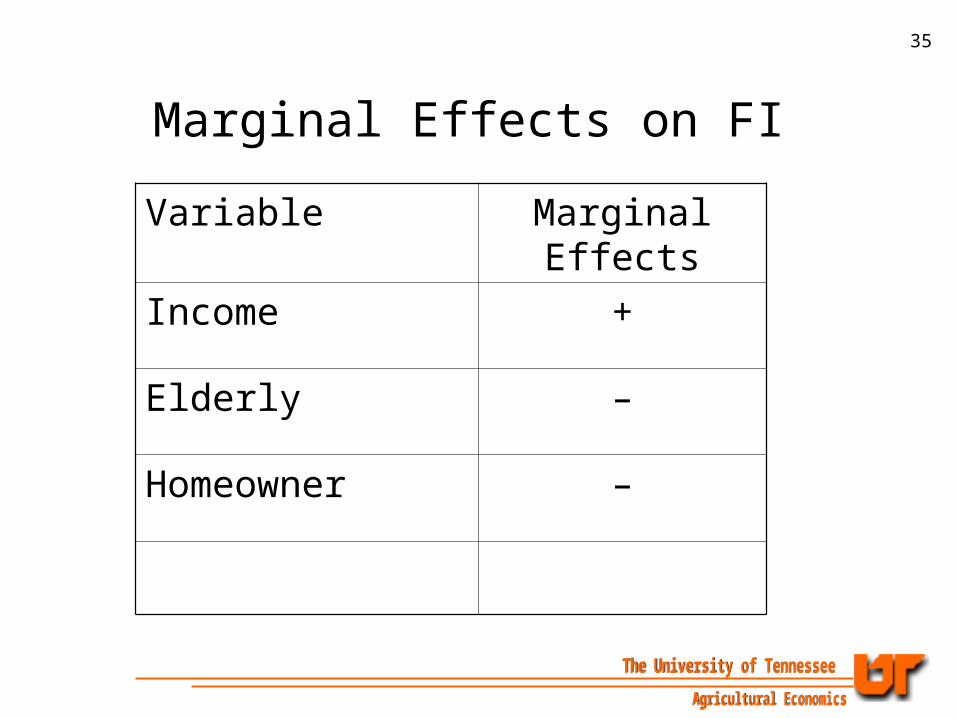
Marginal Effects on FI
Variable Marginal Effects
Income +
Elderly –
Homeowner –
36
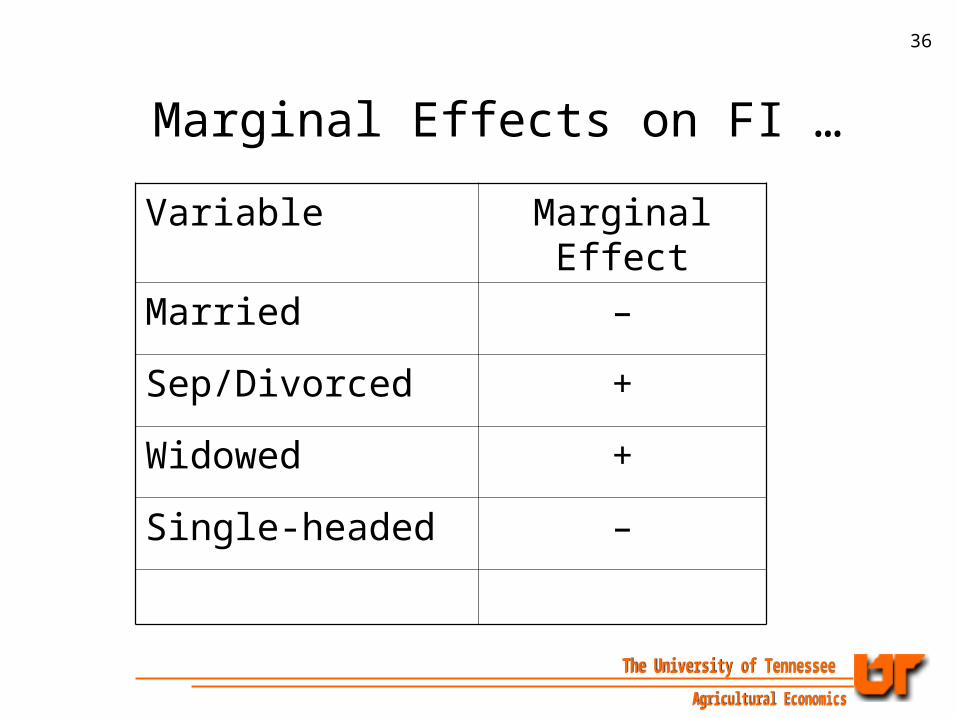
Marginal Effects on FI …
Variable Marginal Effect
Married –
Sep/Divorced +
Widowed +
Single-headed –

37
Marginal Effects on FI …
Variable Marginal Effect
Avoid telling –
Shop where unknown +
Disrespect shopping n.s.
Disrespect telling +

38
Marginal Effects on FI …
Variable Marginal Effect
Asian –
Other race +
Hispanic –
Short recertification +
Dissatisfaction-shop. +

39
Concluding Remarks
Nord, Andrews, and Carlson (2004) cautioned that the relationship between food assistance programs and FI is complex due to the two-way causality.
This study answers that call to address the causality issue by developing a instrumental variables model of FSP participation and FI.

40
Concluding Remarks …
Results suggest …lack of association between FSP participation and FI in previous studies is likely due to the failure to accommodate the simultaneity, sampling weight, and the error covariance structure.

41
Concluding Remarks …
Our results• FSP reduces FI.
Obvious policy implications

42
Concluding Remarks …
Results in sharp contrast to previous findings on effect of FSP on FI:• Opposite (Huffman and Jensen, 2003);• Predominantly insignificant/non-existent
relationship(Gundersen and Oliveira, 2001; Gibson-Davis and Foster, 2005; Jensen, 2002; Kabbani and Yazbeck, 2004, 2005; Oberholser and Tuttle, 2004).

43
Concluding Remarks …
Use of state-level FSP policy variables• used improve the quality of instruments
(without which the model would have been difficult to estimate).
• Allow drawing more policy-relevant conclusions.
• Econometric issues: state-level variables which vary only across states but not observations – use of hierarchical models (Raudenbush and Bryk, 2002)??

44
Concluding Remarks …
Short re-certification (– on FSP; + on FI prob & level)• Improve to promote FSP participation and eliminate FI;
EBT implementation (n.s. on FSP/FI)• may be related to the combined effect of
o reduced stigma;o difficulty to use among the poor who are less likely to
own a debit card.

45
Concluding Remarks …
Other determinants of FSP participation and FI have important policy implications as well. For instance,• married and widowed individuals have a lower FSP
participation rate than individuals who are never married;
• this segment of the population can be targeted for promotion of FSP participation;
• which, in reference to the negative effect of FSP participation on FI, can help reduce FI among these individuals (true for married; not for widowed)

46
Concluding Remarks …
Dissatisfied-Shopping (+ on FI probability and level)• Establishment of more easily accessible and
friendly shopping facilities may also improve (reduce) on consumer dissatisfaction with shopping in the neighborhoods, …
• which will help reduce FI.