1. Federal Highway Administration - Center for Air...
18
Design of a Bridge Inspection System (BIS) to Reduce Time and Cost Ahsan Zulfiqar, Miryam Cabieses, Andrew Mikhail, Namra Khan Department of Systems Engineering and Operations Research George Mason University Fairfax, Virginia Abstract—The current bridge inspection process is inefficient and time-consuming. The current condition of the US bridges is a cause for concern. An alternative process is necessary in order to reduce time and cost, as well as, improve efficiency. The current procedure involves many manual sub- processes that are risky and expensive to conduct. With this new alternative, bridge inspections will not interfere with traffic and will pose almost no risk to the bridge inspectors. Index Terms - Bridge Inspection, UAV, Sensors. I. CONTEXT A. Current Bridge Inspection System in the United States The Federal Highway Administration (FHWA) is an agency within the U.S Department of Transportation whose mission is to provide stewardship over the design, construction, maintenance and preservation of the Nation’s highways, bridges and tunnels. This department is under the administration of 607,380 bridges, which include the regions of D.C and Puerto Rico as states. The average age of these bridges is 42 years, however, most exceed the lifetime they were built to have. Hundreds of thousands of civilians use bridges as a means for transportation. In order to guarantee civilians with safety, FHWA conducts bridge inspections every two years. The current bridge inspection process is manual, involving visual and aural inspections that are both time consuming and costly [15]. The FHWA requires evaluation of all bridges however; it is costly having a bi-annual inspection cost of $2.7 billion for the U.S. where the average inspection cost per bridge ranges from $4,500-$10,000. This requires closing lanes for the span of the inspection, which can take 1 to 3 days causing traffic congestions. With the rapid growth of highway transportation and the dispersed age distributions of bridges, fatigue damage is quickly becoming a serious concern. Therefore, the demand to inspect bridges before the 2-year period is rapidly increasing as the condition of these bridges deteriorates. To assure safety and prevent any hazardous damage of collapsing bridges as has previously occurred the inspection period for these
Transcript of 1. Federal Highway Administration - Center for Air...

Design of a Bridge Inspection System (BIS) to Reduce Time and Cost
Ahsan Zulfiqar, Miryam Cabieses, Andrew Mikhail, Namra KhanDepartment of Systems Engineering and Operations Research
George Mason UniversityFairfax, Virginia
Abstract—The current bridge inspection process is inefficient and time-consuming. The current condition of the US bridges is a cause for concern. An alternative process is necessary in order to reduce time and cost, as well as, improve efficiency. The current procedure involves many manual sub-processes that are risky and expensive to conduct. With this new alternative, bridge inspections will not interfere with traffic and will pose almost no risk to the bridge inspectors.
Index Terms - Bridge Inspection, UAV, Sensors.
I. CONTEXT
A. Current Bridge Inspection System in the United States
The Federal Highway Administration (FHWA) is an agency within the U.S Department of Transportation whose mission is to provide stewardship over the design, construction, maintenance and preservation of the Nation’s highways, bridges and tunnels. This department is under the administration of 607,380 bridges, which include the regions of D.C and Puerto Rico as states. The average age of these bridges is 42 years, however, most exceed the lifetime they were built to have. Hundreds of thousands of civilians use bridges as a means for transportation. In order to guarantee civilians with safety, FHWA conducts bridge inspections every two years. The current bridge inspection process is manual, involving visual and aural inspections that are both time consuming and costly [15].
The FHWA requires evaluation of all bridges however; it is costly having a bi-annual inspection cost of $2.7 billion for the U.S. where the average inspection cost per bridge ranges from $4,500-$10,000. This requires closing lanes for the span of the inspection, which can take 1 to 3 days causing traffic congestions. With the rapid growth of highway transportation and the dispersed age distributions of
bridges, fatigue damage is quickly becoming a serious concern. Therefore, the demand to inspect bridges before the 2-year period is rapidly increasing as the condition of these bridges deteriorates. To assure safety and prevent any hazardous damage of collapsing bridges as has previously occurred the inspection period for these structurally deficient bridges ranges from 6 months to a year [9].
B. Structurally Deficient Bridges
Over time, the effects of nature and man cause bridges infrastructure to deteriorate more and more, if unaddressed, the smallest of cracks can result in devastating collapses. A major concern are structurally deficient bridges which are bridges rated in poor condition classified as such due to the fact that its load carrying capacity is significantly below current design standards. According to the American Society of Civil Engineers as of 2013 over 12% of the bridges in twenty-one states in the United States have structurally deficient bridges shown on Figure 1 [6].
These bridges are a prominent cause for concern due to the lack of safety they provide to the public. Inspecting these structurally deficient bridges prior than the 2-year period is essential in order to detect, and prevent bridge failures increasing the maintenance cost associated with the inspection process [9].
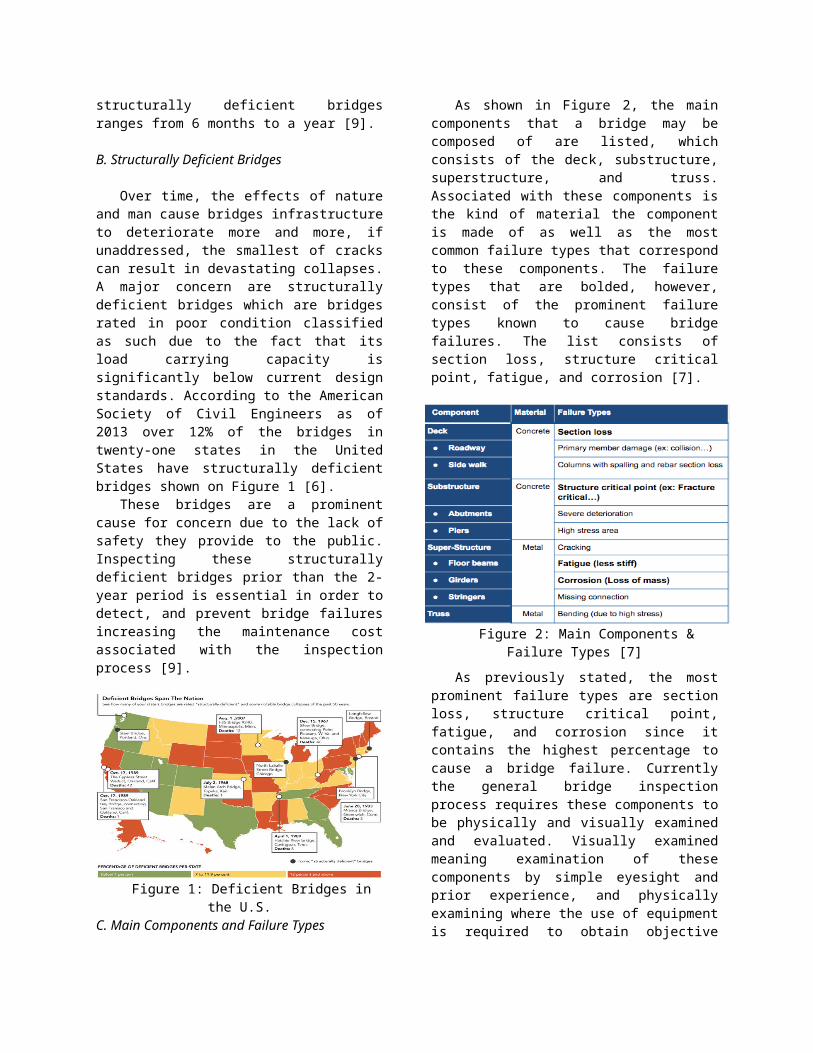
Figure 1: Deficient Bridges in the U.S.C. Main Components and Failure Types
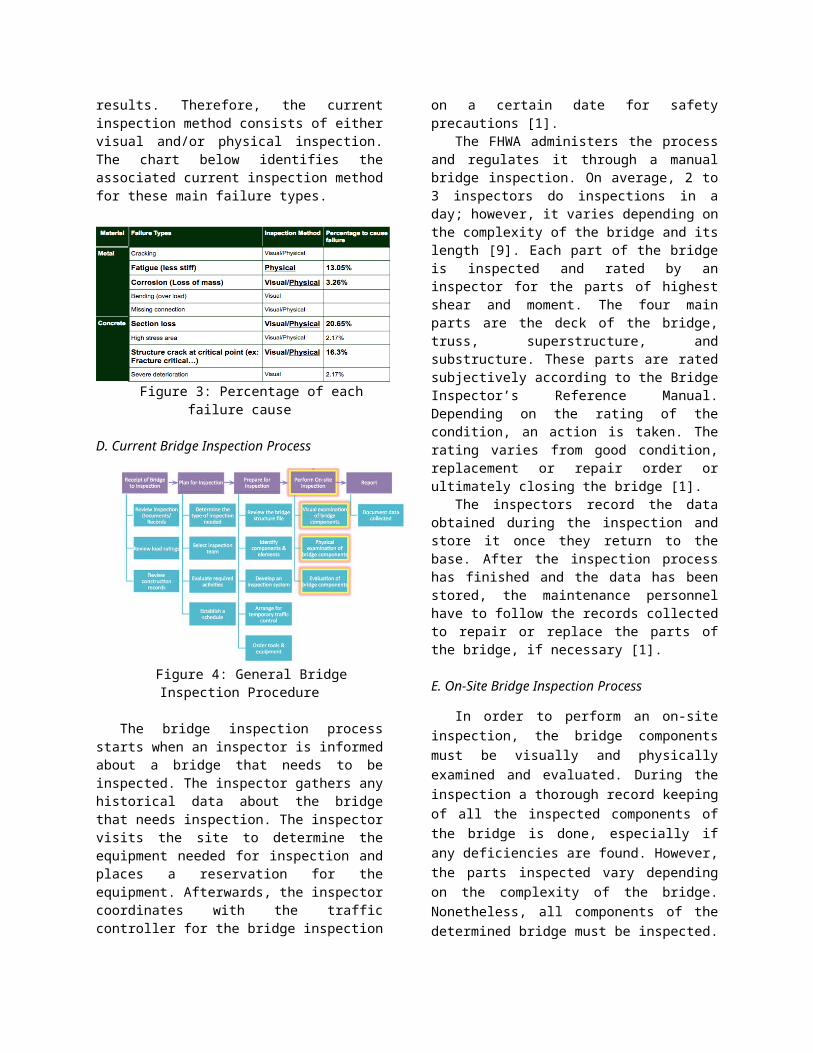
As shown in Figure 2, the main components that a bridge may be composed of are listed, which consists of the deck, substructure, superstructure, and truss. Associated with these components is the kind of material the component is made of as well as the most common failure types that correspond to these components. The failure types that are bolded, however, consist of the prominent failure types known to cause bridge failures. The list consists of section loss, structure critical point, fatigue, and corrosion [7].
Figure 2: Main Components & Failure Types [7]
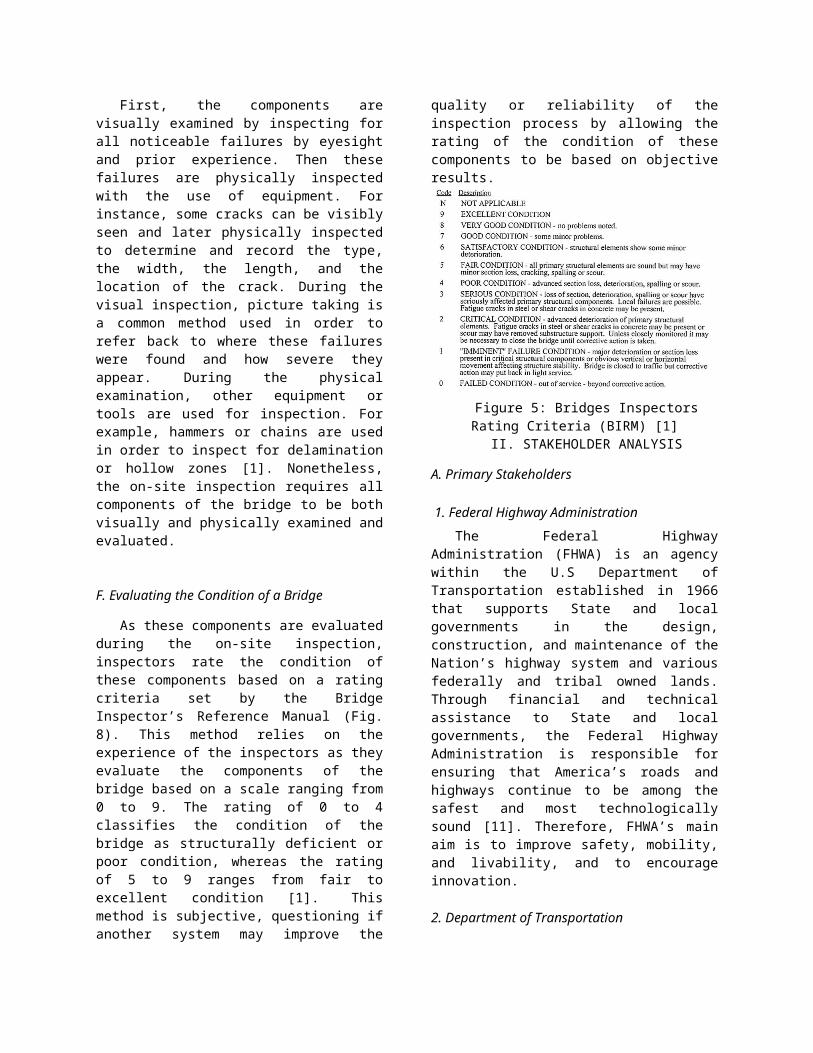
As previously stated, the most prominent failure types are section loss, structure critical point, fatigue, and corrosion since it contains the highest percentage to cause a bridge failure. Currently the general bridge inspection process requires these components to be physically and visually examined and evaluated. Visually examined meaning examination of these components by simple eyesight and prior experience, and physically examining where the use of equipment is required to obtain objective results. Therefore, the current inspection method consists of either visual and/or physical inspection. The chart below identifies the associated current inspection method for these main failure types.
Figure 3: Percentage of each failure cause
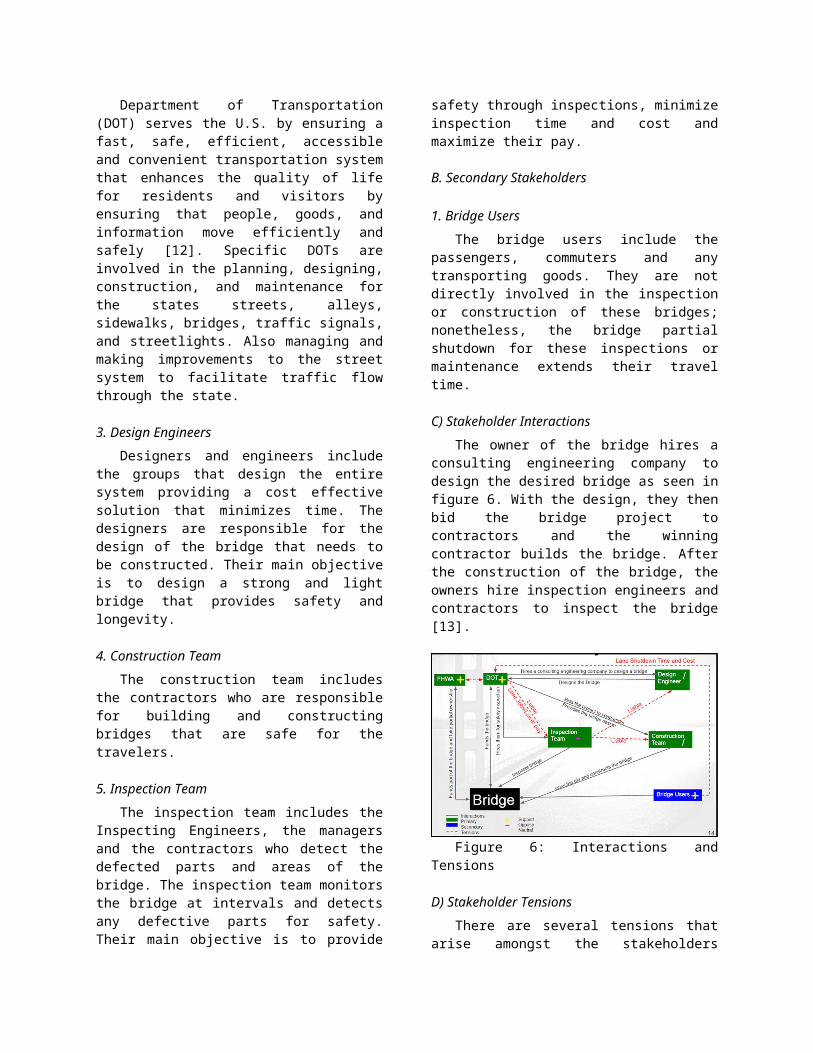
D. Current Bridge Inspection Process
Figure 4: General Bridge Inspection Procedure
The bridge inspection process starts when an inspector is informed about a bridge that needs to be inspected. The inspector gathers any historical data about the bridge that needs inspection. The inspector visits the site to determine the equipment needed for inspection and places a reservation for the equipment. Afterwards, the inspector coordinates with the traffic controller for the bridge inspection on a certain date for safety precautions [1].
The FHWA administers the process and regulates it through a manual bridge inspection. On average, 2 to 3 inspectors do inspections in a day; however, it varies depending on the complexity of the bridge and its length [9]. Each part of the bridge is inspected and rated by an inspector for the parts of highest shear and moment. The four main parts are the deck of the bridge, truss, superstructure, and substructure. These parts are rated subjectively according to the Bridge Inspector’s Reference Manual. Depending on the rating of the condition, an action is taken. The rating varies from good condition, replacement or repair order or ultimately closing the bridge [1].
The inspectors record the data obtained during the inspection and store it once they return to the base. After the inspection process has finished and the data has been stored, the maintenance personnel have to follow the records collected to repair or replace the parts of the bridge, if necessary [1].
E. On-Site Bridge Inspection Process
In order to perform an on-site inspection, the bridge components must be visually and physically examined and evaluated. During the inspection a thorough record keeping of all the inspected components of the bridge is done, especially if any
deficiencies are found. However, the parts inspected vary depending on the complexity of the bridge. Nonetheless, all components of the determined bridge must be inspected.
First, the components are visually examined by inspecting for all noticeable failures by eyesight and prior experience. Then these failures are physically inspected with the use of equipment. For instance, some cracks can be visibly seen and later physically inspected to determine and record the type, the width, the length, and the location of the crack. During the visual inspection, picture taking is a common method used in order to refer back to where these failures were found and how severe they appear. During the physical examination, other equipment or tools are used for inspection. For example, hammers or chains are used in order to inspect for delamination or hollow zones [1]. Nonetheless, the on-site inspection requires all components of the bridge to be both visually and physically examined and evaluated.
F. Evaluating the Condition of a Bridge
As these components are evaluated during the on-site inspection, inspectors rate the condition of these components based on a rating criteria set by the Bridge Inspector’s Reference Manual (Fig. 8). This method relies on the experience of the inspectors as they evaluate the components of the bridge based on a scale ranging from 0 to 9. The rating of 0 to 4 classifies the condition of the bridge as structurally deficient or poor condition, whereas the rating of 5 to 9 ranges from fair to excellent condition [1]. This method is subjective, questioning if another system may improve the quality or reliability of the inspection process by allowing the rating of the condition of these components to be based on objective results.
Figure 5: Bridges Inspectors Rating Criteria (BIRM) [1]
II. STAKEHOLDER ANALYSIS
A. Primary Stakeholders
1. Federal Highway AdministrationThe Federal Highway Administration (FHWA)
is an agency within the U.S Department of Transportation established in 1966 that supports State and local governments in the design, construction, and maintenance of the Nation’s highway system and various federally and tribal owned lands. Through financial and technical assistance to State and local governments, the Federal Highway Administration is responsible for ensuring that America’s roads and highways continue to be among the safest and most technologically sound [11]. Therefore, FHWA’s main aim is to improve safety, mobility, and livability, and to encourage innovation.
2. Department of TransportationDepartment of Transportation (DOT) serves the
U.S. by ensuring a fast, safe, efficient, accessible and convenient transportation system that enhances the quality of life for residents and visitors by ensuring that people, goods, and information move efficiently and safely [12]. Specific DOTs are involved in the planning, designing, construction, and maintenance for the states streets, alleys, sidewalks, bridges, traffic signals, and streetlights. Also managing and making improvements to the street system to facilitate traffic flow through the state.
3. Design EngineersDesigners and engineers include the groups that
design the entire system providing a cost effective solution that minimizes time. The designers are responsible for the design of the bridge that needs to be constructed. Their main objective is to design a strong and light bridge that provides safety and longevity.
4. Construction TeamThe construction team includes the contractors
who are responsible for building and constructing bridges that are safe for the travelers.
5. Inspection TeamThe inspection team includes the Inspecting
Engineers, the managers and the contractors who detect the defected parts and areas of the bridge. The inspection team monitors the bridge at intervals and detects any defective parts for safety. Their main objective is to provide safety through inspections,
minimize inspection time and cost and maximize their pay.
B. Secondary Stakeholders
1. Bridge UsersThe bridge users include the passengers,
commuters and any transporting goods. They are not directly involved in the inspection or construction of these bridges; nonetheless, the bridge partial shutdown for these inspections or maintenance extends their travel time.
C) Stakeholder InteractionsThe owner of the bridge hires a consulting
engineering company to design the desired bridge as seen in figure 6. With the design, they then bid the bridge project to contractors and the winning contractor builds the bridge. After the construction of the bridge, the owners hire inspection engineers and contractors to inspect the bridge [13].
Figure 6: Interactions and Tensions
D) Stakeholder TensionsThere are several tensions that arise amongst the
stakeholders involved in the bridge inspection system due to their differing objectives. As depicted in Figure 6, based on the objectives we can see that both FHWA and DOT would support an alternate bridge inspection system which would reduce the costs and assure public safety. This alternate system would eliminate traffic congestion caused by the closure of lanes, which ultimately dissatisfied bridge users. The bridge users support the inspection, restoration, and protection of the bridges; however, as previously stated they disagree with the current process of closing lanes. An alternate inspection system that does not involve manual inspection and contribute to traffic congestion would be highly favored by bridge users.
Although the bridge designers and the Construction team are not directly affected there are some tensions due to the fact that the inspection team can hold the designers liable if the bridge were to not behave the way it was designed to behave or if the bridge was not constructed properly [13]. On the other hand, the inspection team would oppose an alternative bridge inspection system since it would eliminate manual labor and thus the need for these inspectors. This would either result in job losses or major financial concerns for the inspectors. Furthermore, the inspection team could also be held liable by the department of transportation is something on the bridge was not inspected correctly. These tensions between the stakeholders define our problem and present a need for an alternative system.
III. PROBLEM AND NEED STATEMENTS
A. Problem Statement
Bridges play a key role in the national transportation system, and the ability to assess their condition is vital for safe transportation operations. Therefore, the FHWA requires the evaluation of all bridges, however, the bi-annual inspection cost is $ 2.7 billion in the U.S. alone. The time required for the on-site inspection ranges from 1 to 3 days, which involves the closure of lanes for the span of the inspection causing traffic congestion. These lane closures are required for both the safety of the inspectors and due to the size of the equipment, which are essential in order to identify, and classify any deficient parts of the bridge.
The current inspection process relies on the experience of the inspectors as they evaluate the components of the bridge based on a scale ranging from 0 to 9 as previously stated, making the rating of inspection subjective. As time passes by and the frequency of use of bridges increases so does the fatigue damage of the deteriorating bridge infrastructures. Leading to the increase demand of inspecting these bridges prior than the 2-year period increasing the inspection cycle to a range of 6 months to a year that ultimately increases the bi-annual inspection cost for the U.S.
B. Need Statement
There is a need for the FHWA to improve the effectiveness of the current bridge inspection process. The FHWA needs to reduce the total inspection cost by eliminating traffic control cost, and reducing both labor and equipment cost. The frequency of inspection, detection, and prevention of deficiencies needs to increase in order to prevent any hazardous
damage of bridge failures as has previously occurred. Moreover, there is a need to remove the safety risk of personnel in a bridge inspection. The quality of the bridge inspection should increase by making the bridge inspection rating of the pass/fail criterion objective. Investing time and money in suitable alternative system will allow the FHWA to reduce costs, as well as time in the future. An effective, faster, and durable system not only reduces the costs but also prevents incidents such as the Tacoma Narrows Bridge.
IV. SCOPE
Our main focus is the Theodore Roosevelt Bridge (TRB), which is a beam bridge under the partial control of the District Department of Transportation (DDOT). The DDOT oversees a total of 199 bridges, and 121 of the 199, or 60.8%, of the bridges are structurally deficient. The TRB is 3,143 feet long with 5 spans for the total length. It has 6 supports made out of concrete and metal for added strength. It has 6 lanes and it has been in operation for about 50 years. For this project, only the above-water inspection process will be considered.
V. CONCEPT OF OPERATIONS
A. Requirements
The requirements of this system were derived from the statement of need in order to eliminate the stakeholder tensions. The prominent objective is to reduce the cost and time of inspection, while maintaining and/or increasing the quality of inspection by making it objective and safe for users.
Figure 7: Requirements
VI. PROPOSED SOLUTION
A. Operational Concept
Figure 8: Operation Concept of Proposed Detection Method
Figure 8 shows the different types of failures that have the highest percentage to cause a bridge failure can be inspected by the proposed detection method of vibration analysis.
B. Structural Vibration
All bridges undergo some form of dynamic loading, which cause them to vibrate. Bridges have always been subjected to dynamic influences due to vehicles driving over them. These dynamic influences can lead to deterioration of the bridge caused by the rapid growth of highway transportation. The dynamic loading that all bridges undergo vary from the forces of the bridge structure, to the car engine of the vehicle on the deck of the bridge, to the external forces/vibrations caused by the weather such as the wind.
Structural vibration is a repetitive motion that can be measured and observed in a structure, which can help characterize the behavior and performance of the structure as it responds to vibrations or dynamic loading. Understanding the effect on the structure is essential in order to control and modify the vibration or if necessary to minimize the structural response.
There are four methods of analyzing vibrations, which include free, forced, sinusoidal, and random vibration. The free vibration is the frequency at which the structure wants to naturally vibrate at. The forced vibration is the response of a structure to repetitive forcing function that causes the structure to vibrate at the frequency of the excitation. Sinusoidal vibration causes the structure to vibrate at the excitation of a pure tone with a single frequency. Finally, random vibration is composed of a complex combination of external forces applied to the structure.
The concept of this proposed system is using the vibration that the bridge exhibits through different external forces to predict the condition of the bridge. Each bridge is unique in its vibration; this uniqueness comes from the mass of the bridge, the stiffness of its

components, the material that the bridge is built from and other parameters that are specific to each bridge such as its shape, length and number of lanes. Other dynamic influences occur due to the traffic that goes on the bridge having an effect on the vibration of the bridge.
Any change in the structure of the bridge will have an impact on that vibration of the bridge; the cause of this change could be due to a deficiency. Knowing that the deficiency will cause a change in vibration allows the bridge to be inspected with this method as it detects the condition of the bridge from the change in vibration. However, the changes in frequency vary allowing the detection of what parameter is being affected to be known. For instance, Figure 9 shows the red line to be the natural frequency obtained from the free vibration analysis method, whereas the blue line demonstrates a phase shift to the left stating that the stiffness of the structure has decreased. However, if the phase shift had been to the right it will show that the structure has become stiffer. Thoroughly analyzing these diagrams is a prominent concern in order to identify the condition of the bridge structure.
Figure 9: Natural Frequency (red) vs. Phase Shift (blue)
C. Accelerometers
Electronic sensors that convert vibration motion into electrical signals can measure structural vibrations. A considered alternative is accelerometers, which is an electromechanical device that measures vibration or acceleration forces. Accelerometers designed to measure vibration are based on the piezoelectric effect.
Piezoelectric accelerometers are used when a mass applies force to a nonconducting material creating a high-impedance charge resulting in a voltage across the material (Fig. 13). Essentially, this effect generates an electrical output that is proportional to the applied acceleration generating an opposed buildup of charged particles on the piezoelectric material. Accelerometers obey Newton's law of motion, F=ma. Therefore, the total amount of accumulated charge is proportional to the applied force, and the applied force is proportional to acceleration.
Figure 10: General Accelerometer Dynamics
Some requirements for accelerometers are current excitation, AC Coupling, Grounding, Filtering, and Dynamic Range. The current excitation is the external current needed to power the amplifier. The accelerometer requires AC Coupling since it acquires a signal from both the direct current (DC) and alternating current (AC) where the DC portion offsets the AC portion from zero. Another requirement is properly grounding the system due to the fact that vibration measurements are highly susceptible to noise especially in an electrically conductive surfaces allowing noise to enter the ground path of the measurement signal through the base of the accelerometer.
Adding a low-pass filter is also required since it reduces signals with frequencies higher than the cutoff frequency and passes signals with a frequency lower than the certain cutoff frequency. This identifies the correct range of frequencies required not allowing samples that distort the measurement. The last requirement is a dynamic range, which is a measure of how small you can measure a signal relative to the maximum input signal the device can measure, expressed in decibels. Thus, the input range and the specified dynamic range are important for determining the needs of the system.
Choosing an accelerometer that complies with the above requirements will allow accurate data to be collected when incorporating them for our bridge inspection process. There are two potential design alternatives. The first proposed alternative involves installing these accelerometers mounted onto the bridge with cables that will serve as both a power source and a communication system. Consequently, the second proposed design alternative consists of mounting these sensors connected to a low power communication system that will transport the acquired data to a transportable device capable of taking the collected data from the bridge site to the ground base station.
However, we must first identify the optimal location to place these accelerometers. The most suitable location will vary per bridge due to its complexity. Nonetheless, incorporating these electronic sensors in these certain parts of the bridge will help analyze if any part inspected has changed
from its original state and if so, by how much, stating the level and type of the vibration. This will allow us to know if these parts of the bridge are deficient since the accelerometer will be modified to a particular specified range allowing us to see any variation in its condition. The level of variation according to its recorded previous condition would allow us to quantify the change and ultimately evaluate if the inspected part needs to be repair, replaced, restored or ultimately left unchanged.
D. Proposed Alternatives1. Manual Bridge Inspection: As previously
stated, the current process is a manual inspection process, which can be seen in the Figure 11. An advantage for this process is the fact that inspectors are comfortable with this process and the quality of inspection is said to be 95% reliable [9]. However, this method involves manual labor incurring costs, it is time consuming, and hazardous for the personnel.
Figure 11: Manual Inspection
2. Mounted Sensors with Cables: The first inspection design is using accelerometers with cables as shown in Figure 12. As mentioned previously, the accelerometers can be placed on the bridge ensuring coverage for all areas and components of the bridge. The range of data transmission for a specific accelerometer can determine the distance at which these accelerometer will be placed. These accelerometers can be placed at critical points on the bridge such as the areas with high moment since that is where a deficiency is more likely to happen. To power the accelerometers, we can put a cable that is connected to a power source through all the accelerometers to supply that power. A second cable can run through the accelerometers connected at the end to Data Acquisition Unit (DAU) where all the data will be stored. Analyzing the data will give the condition of the areas that were inspected. If the condition obtained shows any deficiency, an image-capturing device will be used by personnel to capture imagery data for these areas. These images will be analyzed according to the pass/fail criterion to decide the ultimate condition of the inspected component.
An advantage of this design is that it is easy to install and allows for fast power supply and data transmission. However, installing cables requires many accessories such as clamps, tapes, and adhesives [4] and requires the inspectors to acquire new technological skills to be able to interpret the data gathered.
Figure 12: Design alternative using sensors and cables.
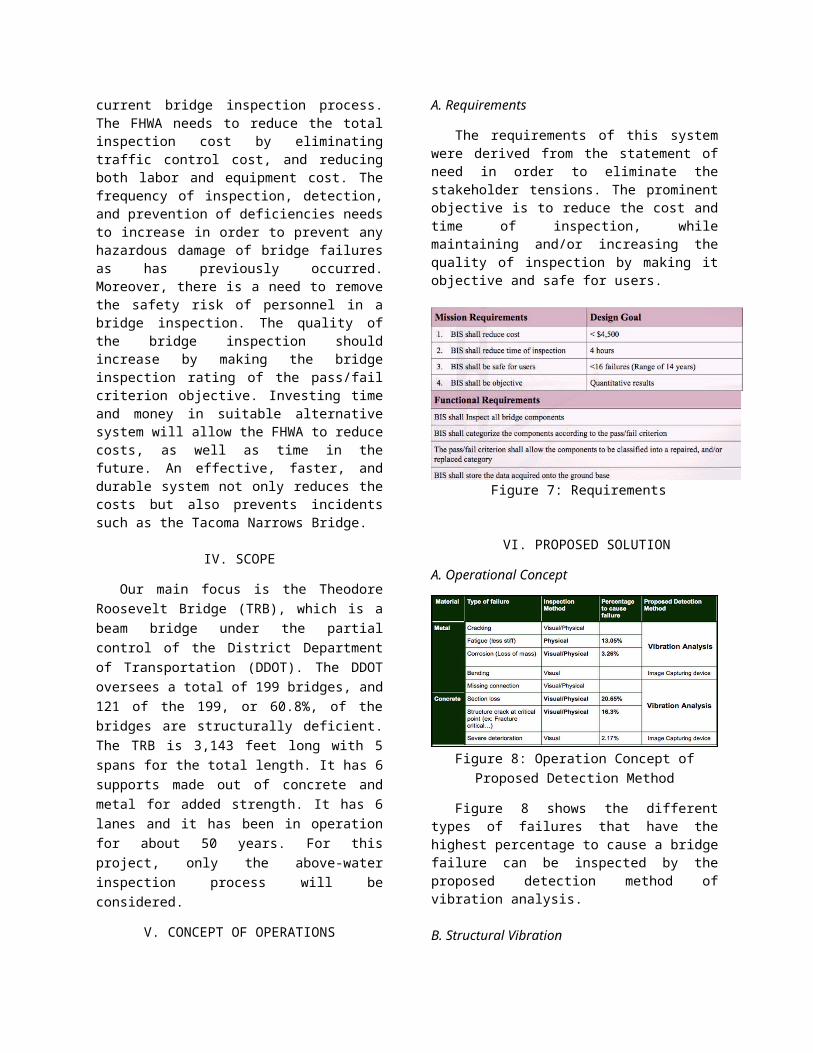
3. Mounted Sensors connected to Low-Power Communication System and the use of a Transportable Device (UAV): The second design alternative consists of using sensors with a low power communication system and an unmanned aerial vehicle as shown in the figure 13 and 14. The concept for this design is the same as the concept of the first design alternative however, in this case the cables for power and communication will be replaced by battery power and the communication between the devices will be wireless. This alternative will not require DAU, nonetheless, the data from all the accelerometers will be collected at one node and transferred to a flying UAV that collects and transport the data for analysis. Afterwards, the UAV takes Imagery data of these areas for analysis. Based on the data collected (vibrations and images), the condition of the bridge is determined.
Figure 13: Overview of Bridge Inspection System design with sensors, low power
communication system, and UAV
This alternative includes a communication system that will transmit the information to a vehicle that will collect that data. For this design, we will need to mount the accelerometers onto individual microcontrollers that will provide power and data

transmission. As shown in figure 14, the microcontrollers have batteries for power supply, antennas for communication, and memory storage to store the frequency data from the accelerometers. These sensors will then form a wireless sensor network, which is a network of spatially connected sensors that monitor physical or environmental conditions [14]. The accelerometers on the bridge will communicate with each other through the antennas and send their data down to a main accelerometer. That accelerometer will then communicate to another microcontroller placed on a UAV flying by and transmit all of the information.
Figure 14: Accelerometers, Microcontrollers, and UAV for the design alternatives.
This design alternative is safe for the inspecting personnel, as they will not have to physically go around the bridge to collect data. This method also provides quick real time data through the antennas, as it is all a part of the network. However, some of the major shortcomings of this alternative are that it also, like the first design alternative, requires the inspectors to acquire new skills. Another concern is that the integrity and security of the data is questioned since it is all part of a network.
E. Method of Analysis
The method of analysis consists of three main models: vibration analysis model, life cycle cost model, and utility model.
The vibration analysis model involves several inputs. These inputs are the factors required to examine the behavior and condition of the bridge structure as it responds to these parameters. Each bridge is unique in its vibration due to the forces of its own structure. This uniqueness comes from the mass of the bridge, the stiffness of its components, the material that the bridge is composed of, its shape, length, load capacity and number of lanes. Other input factors involve the mass and velocity of cars driving on the bridge structure exerting pressure, fluctuations in acceleration, and external random vibrations that may be caused by the structure,
vehicles, the sensors themselves or other extraneous factors.
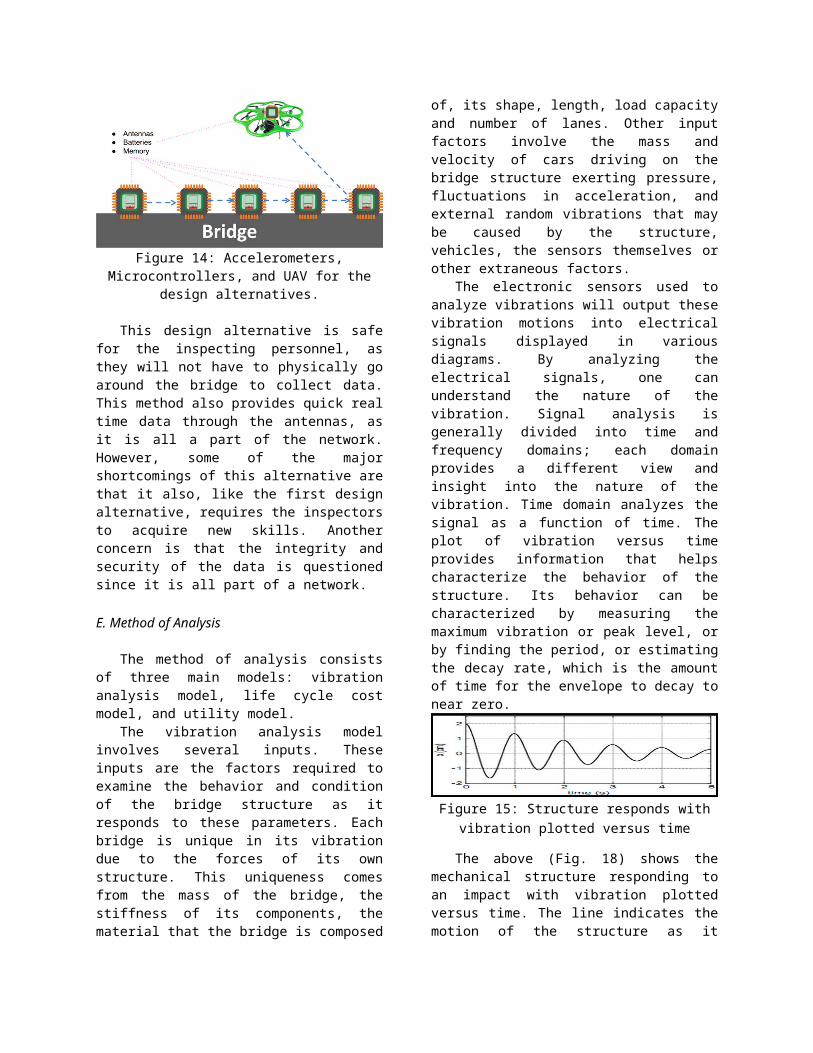
The electronic sensors used to analyze vibrations will output these vibration motions into electrical signals displayed in various diagrams. By analyzing the electrical signals, one can understand the nature of the vibration. Signal analysis is generally divided into time and frequency domains; each domain provides a different view and insight into the nature of the vibration. Time domain analyzes the signal as a function of time. The plot of vibration versus time provides information that helps characterize the behavior of the structure. Its behavior can be characterized by measuring the maximum vibration or peak level, or by finding the period, or estimating the decay rate, which is the amount of time for the envelope to decay to near zero.
Figure 15: Structure responds with vibration plotted versus time
The above (Fig. 18) shows the mechanical structure responding to an impact with vibration plotted versus time. The line indicates the motion of the structure as it vibrates about its equilibrium point.
The frequency domain analysis transforms the time signals into the frequency domain called Fourier Transform. Fourier Transform theory states that any periodic signal can be represented by a series of pure sine tones.
Figure 16: Sine waves
The figures above demonstrate how adding up a series of sine waves can create a square wave; each of the sine waves has a frequency that is a multiple of the frequency of the square wave. The amplitude and phase of each sine tone must be cautiously chosen in order to obtain the right waveform shape. When using a limited number of sine waves such as in the first figure in Figure 16, the result resembles a ragged

square wave. However, as more and more sine waves are added such as in the second figure in Figure 16, the result essentially looks more like a square wave.
In both figures, the third graph shows the amplitude of each of the sine tones. In the left figure there are three sine tones, which are represented by three peaks in the third plot. The frequency of each tone is represented by the location of each peak on the frequency coordinate in the horizontal axis. The amplitude of each sine tone is represented by the height of each peak on the vertical axis. In the right figure there are more peaks because there are more sine tones added together to form the square wave. This third plot can be interpreted as the Fourier Transform of the square wave.
By analyzing these electrical signals, the nature of the vibration can be better understood. Therefore, the vibration analysis model will be capable of outputting the condition and performance of the components inspected in forms of electrical signals that will need to be further analyzed to describe the behavior of the results and characterize the condition of the structure.
The life-cycle cost of each proposed alternative will be dependent on the number of accelerometers and the accessories required. These will depend on the parameters of the bridge. The placement of accelerometers is imperative in order to obtain accurate data, for that reason accelerometers will be placed at the critical points on the bridge. These critical points vary from one bridge to the other. The parameters of a bridge that are essential for determining these critical points are the length of the bridge, the number of spans, the length for each span, the number of lanes, and the highest moments on the bridge. The highest moments are considered, as critical points as they are highly susceptible to vibration and that will provide accurate signal with less noise than other points on bridge where the signal of the actual vibration might be more vulnerable to external noise.
Given these parameters for each bridge we will determine the number of accelerometers and accessories needed for that specific bridge, by which the cost of the life cycle inspection can be calculated for that specific bridge according to the design alternative. However, foreseen inherited cost associated with these proposed alternatives consists of acquisition, concurrent, and indirect costs. However, the life cycle cost will be later discussed in more thorough detail.
The utility of each alternative will be calculated using the attributes shown in Figure 17. These attributes are the importance of that feature to the inspection system. After rating each alternative to the
attributes, the utility of each alternative will be calculated (Fig. 22).
Figure 17: Attributes of Inspection System
Figure 18: Utility for each alternative
Equation 1: Utility calculation
F. Simulation
Figure 19: Simulation Design
The uniform random number generator will be used in order to replicate the external forces that bridges are exposed to due to the dynamic loading of cars driving over them. The first transfer function consists of the parameters of the bridge structure using the dynamics equation known as kx+cẋ+mẍ. These parameters can help examine the behavior and condition of the bridge structure as it responds to the vibrations caused by the dynamic loading and other external forces [4].

The mass is represented by m, damping as c, and stiffness by k, which correspond to the structure of the bridge. The replication of the external forces done by the number generator, applies other factors to the first transfer function or the bridge. This factors vary from the mass and velocity of the cars, the load capacity of the structure, time span of the pressure or dynamic loading, the length of the bridge, the number of lanes and load on them, the fluctuation in acceleration, and other external vibrations caused by the weather or any repetitive forcing function that might affect the excitation of the vibration. Altering the behavior or response of the output of the first transfer function.
The second transfer function will receive the output obtain from the first transfer function. This transfer function uses the same dynamic equation since it is known to be the fundamental equation for accelerometers. Once it obtains the output of the first transfer function, without having any known parameters inputted manually it should output the same results. If so the use accelerometers will be an essential alternate inspection system.
However, the second transfer function will have some triggering factors included such as other external noise that may be caused by the mounting of the accelerometers, the sensor noise, if any sensor malfunction is occurring, how sensitive to noise the sensor us, the power source, and even if the performance of the sensor has changed.
Prior to the second transfer function, parameters will be changed both in the uniform random number generator and the first transfer function to see how the variations change the performance and behavior of the output frequencies. By having base variables that remain constant we can see how each parameter affects the results and ultimately correlate the effects to trends.
If we increase the mass, we will see the result of a lower natural frequency and vise versa. These trends can help analyze if the component or structure is behaving as it was designed to behave. By examining the results, we can determine the condition of the component by analyzing its behavior as it responds to vibrations.
G. Design of Experiment
The input parameters will be varied in order to obtain an insight of the system and more specifically the condition of the bridge. Studying these changes in the output due to the varied parameters will give an understanding of how it relates to the change in the input. The amount of variation allows us to quantify the severity of the condition of the bridge according to change of the output.
These parameters will be modified by changing them to have a lower and upper bound apart from its base parameters to perform a sensitivity analysis on the behavior of the output. For instance, a larger stiffness will result in a higher natural frequency, and a larger mass will result in a lower natural frequency. The chart below demonstrates the base parameters of the Theodore Roosevelt Bridges and its variation according to each factor (Fig. 24).
Figure 20: Design of Experiment
H. Cost Model for Theodore Roosevelt
The three alternatives are: manual, sensors with cables, and sensors connected to a low power communication systems and a transportable device. In order to have meaningful cost estimates, we will be looking at a 50-year life cycle of a bridge inspected every 2 years. The sample, Theodore Roosevelt Bridge, has a total length of 3200 ft. containing 5 spans with 12 lanes in both directions. Figure 21 shows the costs for the different alternatives.
Figure 21: Cost for different design alternatives
The manual cost is estimated to be $30k per inspection, which results in $750k for the 50 years of inspection. For the design alternative of mounted sensors with cables, the optimal amount of sensors required for the inspection is 65 accelerometers costing $33.8k. BDI accelerometers are chosen as a sample in this cost estimation. The cost of these accelerometers is $520 per unit. The installation cost is estimated to be $4,000 provided by BDI representative. The accessories include the cables used to wire the accelerometers for power and data transmission resulting in a cost of $26.8k.
The Data Acquisition Unit (DAU) alone costs around $50k. Another additional cost associated with this alternative is the labor cost required since

inspectors will be needed if a deficiency is found in order to verify with visual inspection. During the visual inspection the use of an image capturing device will be needed for record keeping and analyzing of the data resulting in $2.6k.
The third design alternative is estimated to cost $270k. These costs were calculated using the same method as the second alternative, however, with a higher installation cost of $5,000. The accessories for this system are the communication system needed to transmit the data between accelerometers. In order for the accelerometers to communicate with each other, 3 additional micro-condolers will be placed to each accelerometer. The price for these microcontrollers is $25 per unit. The price for the concurrent cost taken into account is the price of 2 inspectors working one full day as well as the battery change for the UAV each year having a cost of $650 per inspection.
I. General Cost Model for the DC Area
The District of Columbia has 199 bridges in total. From these bridges, 21 are rated as Structurally Deficient (SD) and 102 are considered to be Functionally Obsolete (FO) meaning that their condition is close to being poor. The SD bridges need to be inspected prior than the 2-year period, meaning that the frequency of inspection is more often. Knowing these facts we can calculate the inspections per year for the District area.
Total SD SD/FO
199 21 102
Insp. Every 2 years 178 76
Every year (normal) 89 38
Total Every year 110 161
Figure 22: Statistics for the bridges in the District of Columbia (DC)
From Figure 22 we can conclude that there are 110 bridges to 161 bridges that need to be inspected each year in the upcoming 50 years. The average cost per inspection is $4.5k, therefore this calculation shows the total cost for an inspection life cycle of 50 years for the District of Columbia. Figure 23 shows the price ranges for each alternative over the next 50 years for the District of Columbia.
Total (50 yrs) AVG (DC)
Manual 24,750,000 36,225,000
Mounted w/ cables 14,513,466 21,242,437
Mounted w/ UAV 8,856,375 12,962,513
Figure 23: Estimated Cost for the system design alternatives
VI. FUTURE WORK
Although the Fall 2014 semester is coming to an end, it is important that we continue working on our bridge inspection project to assure success. We will continue working on this project throughout winter break, occasionally holding meetings. Specifically, we will be working on our simulation, testing and results through winter break and throughout next semester. We will then meet with the advisors and professor at the beginning of the next semester to discuss our progress with them and receive feedback. We will then pick up the pace and continue working on the project as suggested by our advisor and professors.
ACKNOWLEDGMENT
We would like to thank Dr. David Lattanzi from the Civil Engineering Department at George Mason University for his contributions as the sponsor of this project and a special thanks to Dr. Lance Sherry for his support throughout this project.
REFERENCES
[1] T. J. Ryan, J. E. Mann, Z. Chill, and B. Ott, “Bridge Inspector’s Reference Manual.” Federal Highway Administration, Dec-2012.
[2] Mark Serridge and Torben R. Licht, “Piezoelectric Accelerometer and Vibration Preamplifier Handbook” Theory and Application Handbook, Nov-1987.
[3] Guy Kulwanoski and Jeff Schnellinger, “The Principles of piezoelectric Accelerometers.” Sensors Online, Feb-2004.
[4] “Accelerometer Mounting and Installation Techniques”. Wilcoxon Research, 2008.
[5] MetroMess, “Accelerometer Mounting”, Manfred Weber.
[6] “2013 Report Card for American Infrastructure,” 2013.
[7] Cook, Wesley, "Bridge Failure Rates, Consequences, and Predictive Trends" (2014). All Graduate Theses and Dissertations. Paper 2163.http://digitalcommons.usu.edu/etd/2163
[8] FHWA Archives data for “Deficient Bridges by State and Highway System” http://www.fhwa.dot.gov/bridge/deficient.cfm
[9] C. How, “Virginia Department of Transportation (VDOT),” 20-Oct-2014.
[10] “Bridge Construction” Department of Civil Engineering, University of Delaware http://www.ce.udel.edu/courses/CIEG%20486/Bridge.pdf
[11] “What we Do”, (Federal Highway Administration) http://www.fhwa.dot.gov/
[12] “About DOT”,( Department of Transportation) http://www.dot.gov/
[13] Lattanzi, David. “George Mason University,” 26-Oct-2014.
[14] Margaret, Rouse.“Wireless Sensor Network (WSN)”, (Search Data Center), searchdatacenter.techtarget.com
[15] D. Lattanzi, “Design Of An Autonomous Bridge Inspection System.”