1 FAO FBS Methodology: History, Sources, Concepts and Definitions.
21
1 FAO FBS Methodology: History, Sources, Concepts and Definitions
-
Upload
corey-preston -
Category
Documents
-
view
232 -
download
0
Transcript of 1 FAO FBS Methodology: History, Sources, Concepts and Definitions.
1
FAO FBS Methodology: History, Sources, Concepts and
Definitions
2
Background
Food Balance Sheet 1st attempt. FAO encourage countries to develop
their own FBS. Published regularly.

3
Supply and Utilization Accounts (SUAs)
Statistical framework for food and agricultural commodities.
Also provide data for the supply and utilization part of FBS.

4
What are SUAs?
Time series data on; supply (production, imports, stock) utilisation (exports, feed, seed, food and other use) which are kept together to allow the matching of food availability for human consumption.
Basis of statistics for food and agricultural commodities - traced from production, utilization to consumption. Constructed for primary crops, livestock and fish commodities.
Crops - data up to 1st stage Livestock & fish – 2nd stage
5
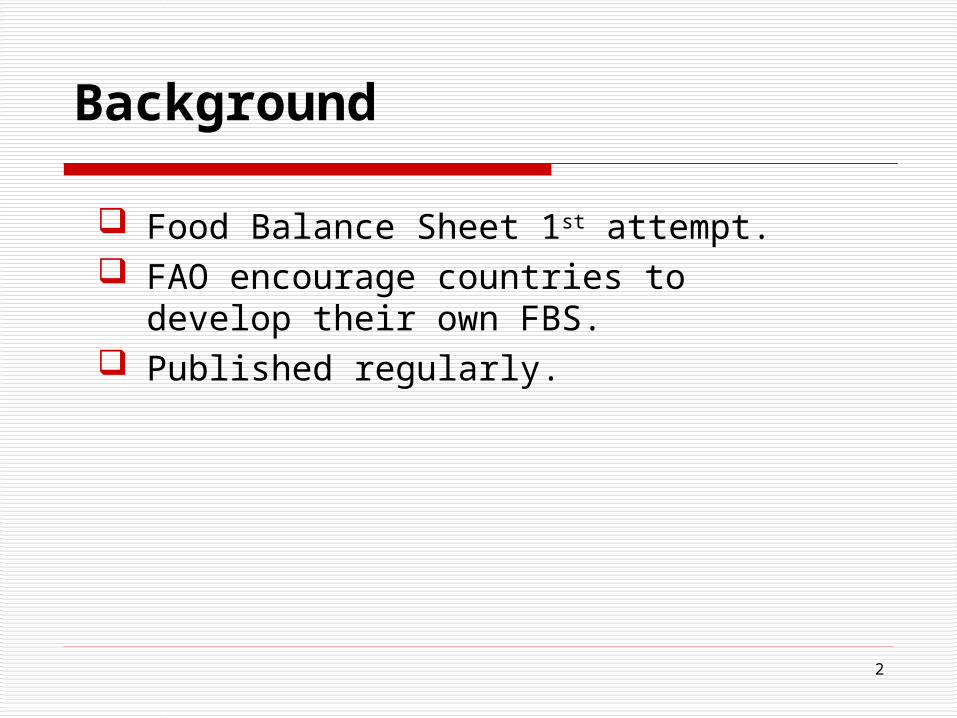
Standard SUA for Crops
Supply Utilization 01. Production 04. Addition to stocks 02. Imports 05. Exports 03. Withdrawal from stocks 06. Feed 07. Seed 08. Waste 09. Processing for food 10. Food availability 11. Other utilization Note: Only the basic or essential elements of an account are used in the equation for SUA.
6
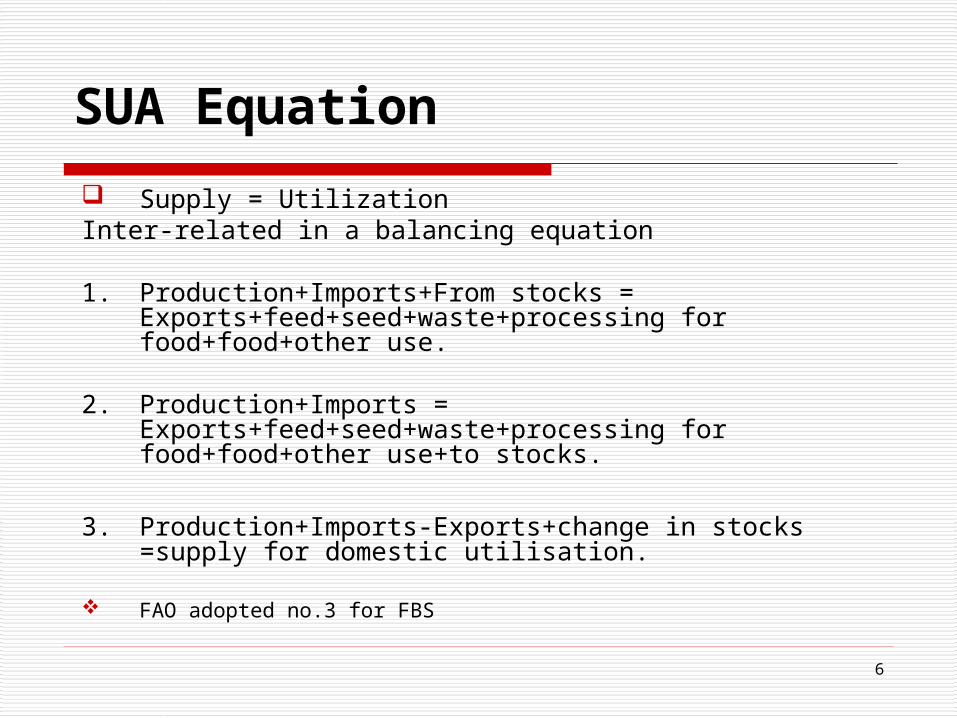
SUA Equation
Supply = UtilizationInter-related in a balancing equation
1. Production+Imports+From stocks = Exports+feed+seed+waste+processing for food+food+other use.
2. Production+Imports = Exports+feed+seed+waste+processing for food+food+other use+to stocks.
3. Production+Imports-Exports+change in stocks =supply for domestic utilisation.
FAO adopted no.3 for FBS
7
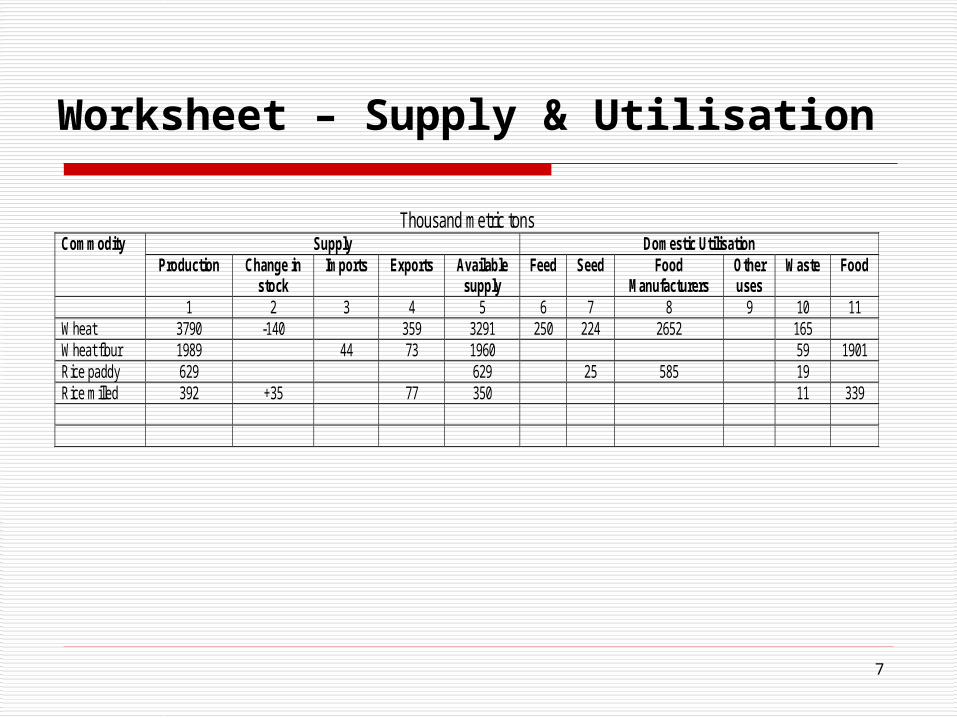
Worksheet – Supply & Utilisation
Thousand metric tons
Supply Domestic Utilisation Commodity Production Change in
stock Imports Exports Available
supply Feed Seed Food
Manufacturers Other uses
Waste Food
1 2 3 4 5 6 7 8 9 10 11 Wheat 3790 -140 359 3291 250 224 2652 165 Wheat flour 1989 44 73 1960 59 1901 Rice paddy 629 629 25 585 19 Rice milled 392 +35 77 350 11 339
8
Preparation of SUA
Draw up a list of relevant food and agricultural commodities List
Search for data. Choose a suitable reporting units – use
metric system.
9
Sources of Data
Basic data should be obtained from one authority Comprehensive statistical system Concepts should be for FBS Consistent information
10
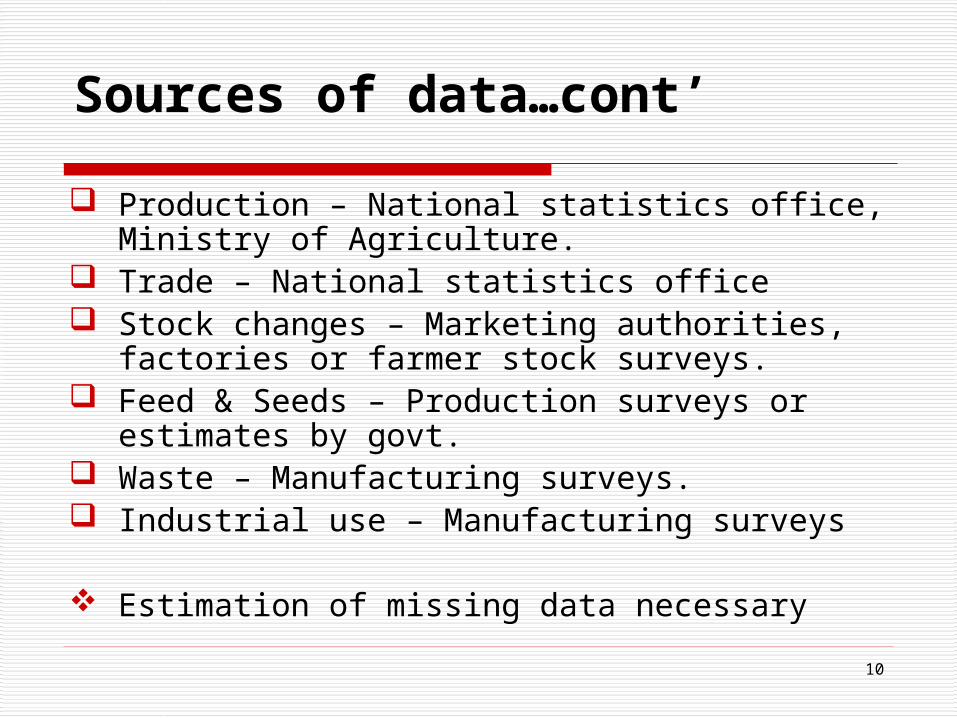
Production – National statistics office, Ministry of Agriculture.
Trade – National statistics office Stock changes – Marketing authorities,
factories or farmer stock surveys. Feed & Seeds – Production surveys or
estimates by govt. Waste – Manufacturing surveys. Industrial use – Manufacturing surveys
Estimation of missing data necessary
Sources of data…cont’

11
Advantage of SUA
Internally consistent – provide a check on data supplied by various sources
Tool to choose between alternative sources of data & logical framework to estimate missing data.
12
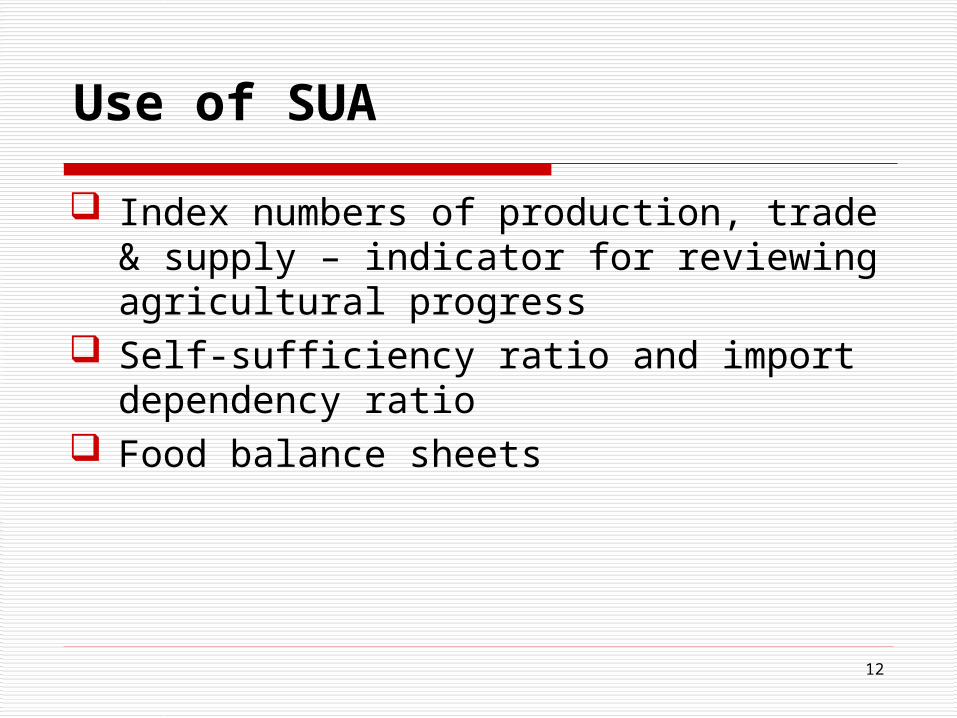
Use of SUA
Index numbers of production, trade & supply – indicator for reviewing agricultural progress
Self-sufficiency ratio and import dependency ratio
Food balance sheets
13
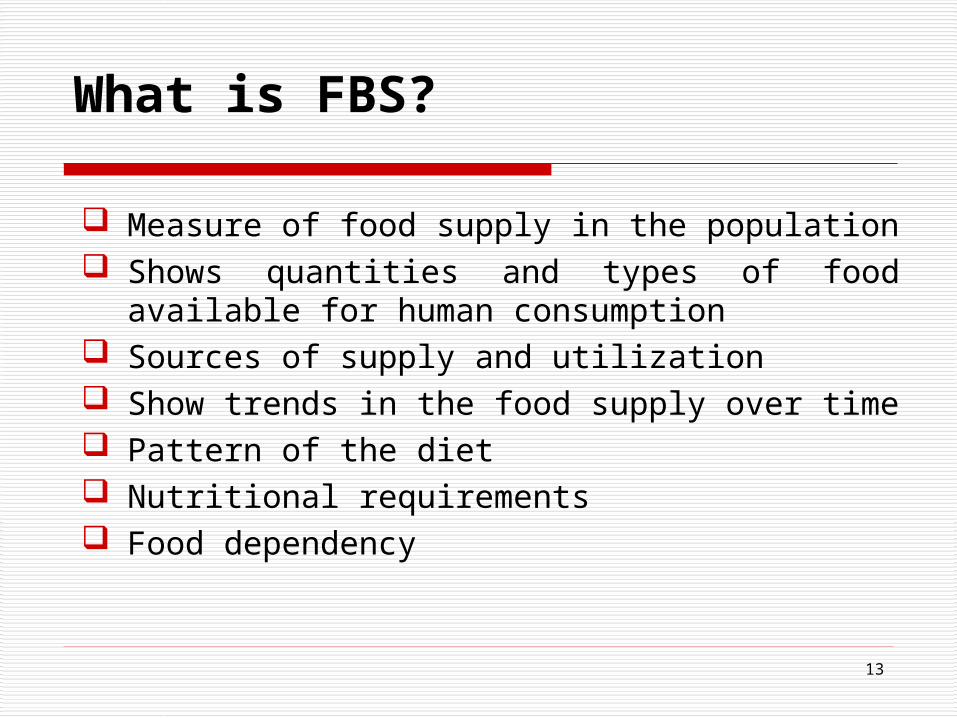
What is FBS?
Measure of food supply in the population Shows quantities and types of food
available for human consumption Sources of supply and utilization Show trends in the food supply over time Pattern of the diet Nutritional requirements Food dependency
14
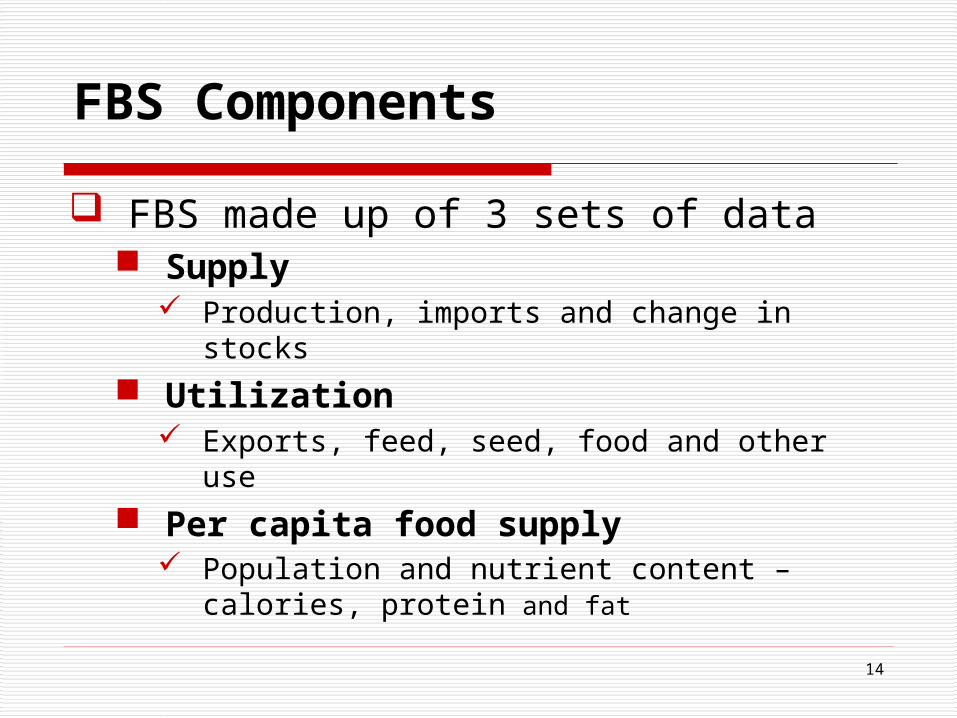
FBS Components
FBS made up of 3 sets of data Supply
Production, imports and change in stocks
Utilization Exports, feed, seed, food and other use
Per capita food supply Population and nutrient content –
calories, protein and fat
15
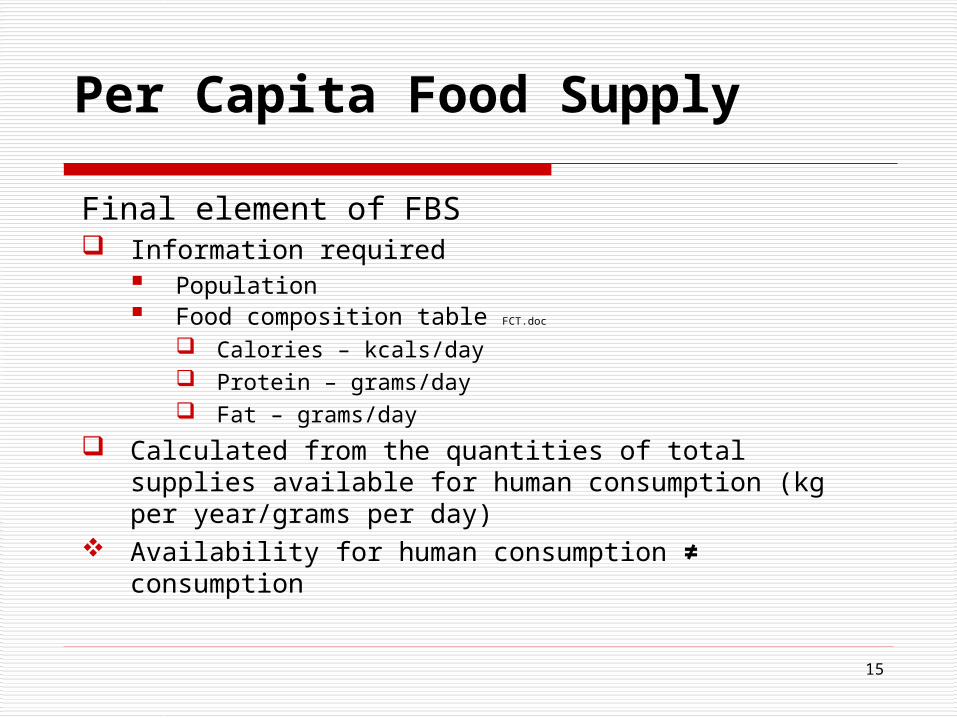
Per Capita Food Supply
Final element of FBS Information required
Population Food composition table FCT.doc
Calories – kcals/day Protein – grams/day Fat – grams/day
Calculated from the quantities of total supplies available for human consumption (kg per year/grams per day)
Availability for human consumption ≠ consumption
16
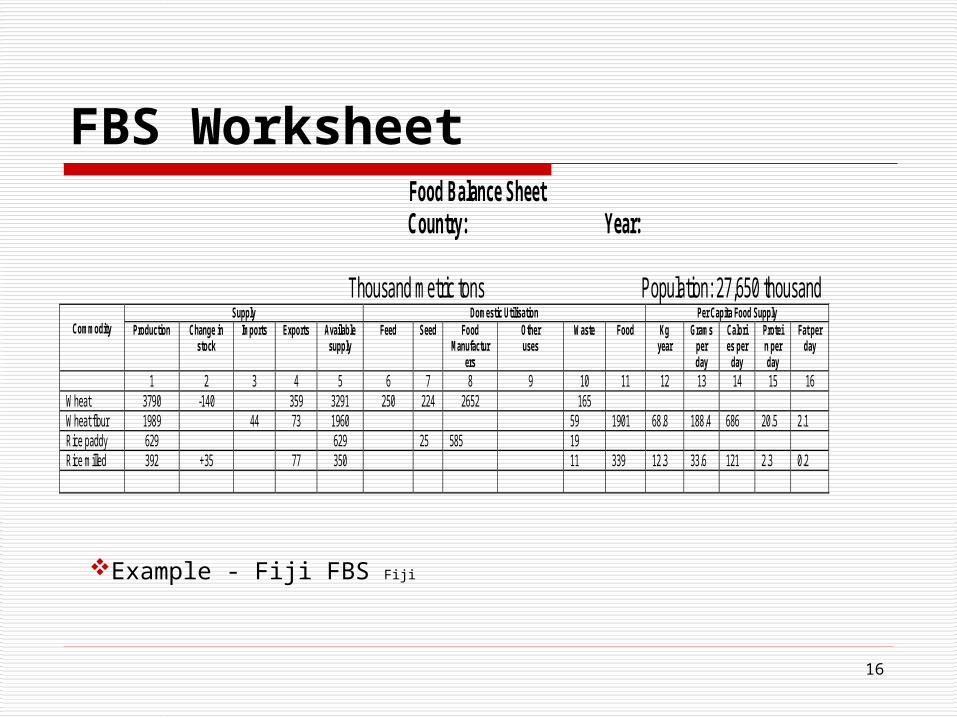
FBS WorksheetFood Balance Sheet
Country: Year:
Thousand metric tons Population: 27,650 thousand Supply Domestic Utilisation Per Capita Food Supply
Commodity Production Change in stock
Imports Exports Available supply
Feed Seed Food Manufactur
ers
Other uses
Waste Food Kg year
Grams per day
Calories per
day
Protein per day
Fat per day
1 2 3 4 5 6 7 8 9 10 11 12 13 14 15 16 Wheat 3790 -140 359 3291 250 224 2652 165 Wheat flour 1989 44 73 1960 59 1901 68.8 188.4 686 20.5 2.1 Rice paddy 629 629 25 585 19 Rice milled 392 +35 77 350 11 339 12.3 33.6 121 2.3 0.2
Example - Fiji FBS Fiji
17
Remarks
Food balance sheets provide data on food supplies. The accuracy of food balance sheets, which are in
essence derived statistics, is of course dependent on the reliability of the underlying statistics of supply and utilization of food and of population.
Production statistics may not be available for all commodities needed.
Import and export data may be reasonably accurate in the majority of countries, but in some countries significant amounts of trade across national boundaries go unrecorded.
18
Remarks (continuation) A number of adjustments on the basic data
as well as imputations/estimations of the missing data have to be carried out in the preparation of the Food Balance Sheet.
Once estimates of the other components have been made, the estimate of food available for human consumption is usually derived as a residual according to the following equation:Food available for human consumption = Total food supply - Feed - Seed - Industrial uses - Waste.
19
Limitations
Coverage/representativeness of the basic data Gaps in statistics of utilization of non-food use Incompleteness and inaccuracy of the basic
data Under-reporting Population data Data from different sources No indication of differences exist in the diet by
different population group

20
Conclusion
SUA useful tool in agricultural statistics FBS are useful for:
Appraisal of food and agricultural situation in a country.
Estimating overall shortages and surpluses based on normative food needs expressed in terms of energy as well as proteins, carbohydrates and fats.
Developing projections of future food supply needs Establishing relationships between national food
supplies & malnutrition. Evaluating food and nutrition policies. Basis for the policy analysis to ensure food security.

21
Thank you for your attention