1. EXPOSURE DATA - monographs.iarc.fr · and cured cooked meats (Pearson & Gillett, 1996; ......
70
33 1.1 Identification of the agents e focus of this Monograph is the consump- tion of red meat and processed meat. ese terms are defined below. 1.1.1 Red meat Red meat refers to fresh unprocessed mammalian muscle meat (e.g. beef, veal, pork, lamb, mutton, horse, or goat meat), which may be minced or frozen, and is usually consumed cooked. 1.1.2 Offal Mammalian offal refers to the internal organs and entrails of a butchered animal (e.g. scrotum, small intestine, heart, brain, kidney, liver, thymus, pancreas, testicle, tongue, tripe, or stomach) consumed as such. Mammalian offal is considered to be a specific food category in food consumption surveys (FAO, 2015); however, mammalian offal is reported together with red meat in some epidemiological studies. 1.1.3 Processed meat Processed meat refers to any meat that has been transformed through one or several of the following processes: salting, curing, fermenta- tion, smoking, or other processes to enhance flavour or improve preservation. Most processed meats are made from pork or beef, but may also include other red meats, poultry, offal, or meat by-products such as blood. It is also important to distinguish between industrial processing and household preparations. As there is a huge variety of processed meat products, it is difficult to sort them into categories ( Santarelli et al., 2008 ). However, based on recommendations by the Food and Agriculture Organization of the United Nations (FAO) (Heinz & Hautzinger, 2007), different groups of industrial processed meats can be proposed. (a) Cured meat pieces Examples of cured meat include raw beef, raw ham, cooked beef, cooked ham, corned beef, and bacon. Curing is a process by which the meat is treated with a small amount of salt (sodium chloride, NaCl, with or without potassium chlo- ride, KCl), with or without nitrate or nitrite salts. Curing enhances shelf-life by preserving and preventing the spoilage of meat. Cured meat cuts are made of entire pieces of muscle meat and can be subdivided into two groups: cured raw meats and cured cooked meats (Pearson & Gillett, 1996; Heinz & Hautzinger, 2007 ; Honikel, 2010). Cured raw meats are consumed uncooked. ey do not undergo any heat treatment during prod- uction, which involves curing, fermentation, and ripening in controlled conditions to make the meats palatable. For cured cooked meats, the raw muscle meat is always cured and then under- goes treatment to achieve the desired palatability (Heinz & Hautzinger, 2007). 1. EXPOSURE DATA
-
Upload
duongkhuong -
Category
Documents
-
view
215 -
download
0
Transcript of 1. EXPOSURE DATA - monographs.iarc.fr · and cured cooked meats (Pearson & Gillett, 1996; ......
33
1.1 Identification of the agents
The focus of this Monograph is the consump-tion of red meat and processed meat. These terms are defined below.
1.1.1 Red meat
Red meat refers to fresh unprocessed mammalian muscle meat (e.g. beef, veal, pork, lamb, mutton, horse, or goat meat), which may be minced or frozen, and is usually consumed cooked.
1.1.2 Offal
Mammalian offal refers to the internal organs and entrails of a butchered animal (e.g. scrotum, small intestine, heart, brain, kidney, liver, thymus, pancreas, testicle, tongue, tripe, or stomach) consumed as such. Mammalian offal is considered to be a specific food category in food consumption surveys (FAO, 2015); however, mammalian offal is reported together with red meat in some epidemiological studies.
1.1.3 Processed meat
Processed meat refers to any meat that has been transformed through one or several of the following processes: salting, curing, fermenta-tion, smoking, or other processes to enhance flavour or improve preservation. Most processed meats are made from pork or beef, but may also include other red meats, poultry, offal, or meat
by-products such as blood. It is also important to distinguish between industrial processing and household preparations. As there is a huge variety of processed meat products, it is difficult to sort them into categories (Santarelli et al., 2008). However, based on recommendations by the Food and Agriculture Organization of the United Nations (FAO) (Heinz & Hautzinger, 2007), different groups of industrial processed meats can be proposed.
(a) Cured meat pieces
Examples of cured meat include raw beef, raw ham, cooked beef, cooked ham, corned beef, and bacon.
Curing is a process by which the meat is treated with a small amount of salt (sodium chloride, NaCl, with or without potassium chlo-ride, KCl), with or without nitrate or nitrite salts. Curing enhances shelf-life by preserving and preventing the spoilage of meat. Cured meat cuts are made of entire pieces of muscle meat and can be subdivided into two groups: cured raw meats and cured cooked meats (Pearson & Gillett, 1996; Heinz & Hautzinger, 2007; Honikel, 2010). Cured raw meats are consumed uncooked. They do not undergo any heat treatment during prod-uction, which involves curing, fermentation, and ripening in controlled conditions to make the meats palatable. For cured cooked meats, the raw muscle meat is always cured and then under-goes treatment to achieve the desired palatability (Heinz & Hautzinger, 2007).
1. EXPOSURE DATA

IARC MONOGRAPHS – 114
34
(b) Fresh industrial processed meat products
Examples of fresh industrial processed meat products include sausage and kebab.
These products are mixtures composed of comminuted muscle meat and animal fat in varying proportions. Products are salted only, not cured. Non-meat ingredients are added in smaller quantities for improvement of flavour and binding, or in larger quantities for volume exten-sion (reducing costs). All meat and non-meat ingredients are mixed when raw. If the fresh meat mixture is packed into casings, the product is defined as sausage. Heat treatment is applied immediately before consumption to make the products palatable (Heinz & Hautzinger, 2007). [The Working Group noted that a hamburger is considered as belonging to this category of processed meat when fat, salt, or other addi-tives are added to the hamburger meat, but is considered as red meat when it contains minced beef only.]
(c) Precooked ready-to-eat products
Examples of precooked ready-to-eat products include frankfurter, mortadella, liver sausage, blood sausage, canned corned beef, and liver pâté.
These products are prepared from muscle meat, fat, and other edible meat by-products (blood and liver) or non-meat ingredients. These products are processed raw through commi-nuting and mixing. Sometimes the raw meat material can be precooked before it is ground or chopped, and other ingredients are added. The resulting mixture is portioned and then submitted to heat treatment to induce protein coagulation. This leads to the typical firm, elastic texture of precooked ready-to-eat products, as well as a desired palatability and a certain degree of bacterial stability (Heinz & Hautzinger, 2007).
(d) Fermented sausages
Examples of fermented sausages include salami, chorizo, pepperoni, and traditional Asian products such as nem.
Fermented sausages are uncooked meat prod-ucts, and consist of coarse mixtures of lean meats and fatty tissues combined with salt, nitrite (curing agent), sugar, spices, and other non-meat ingredients packed into casings. Their charac-teristic properties (flavour, firm texture, and red curing colour) originate from the fermentation process. Short or long ripening phases, combined with moisture reduction, are necessary to develop the typical flavour and texture of the final product. The fermented sausages are not subjected to any heat treatment during processing and, in most cases, are distributed and consumed raw (Heinz & Hautzinger, 2007).
(e) Dried meat
Examples of dried meat include dried meat strips or flat pieces.
Drying, or drying in combination with smoking, is practised all over the world and is probably the most ancient method of meat preservation.
Dried meat products result from dehydration or drying of lean meat in natural or artificial conditions (Zukál & Incze, 2010). Pieces of lean meat without adherent fat are cut to a specific uniform shape that permits the gradual and equal drying of whole batches of meat. Salt, nitrite, and sugar may be added to the meat before the drying process. Many of the nutritional prop-erties of meat, particularly the protein content, remain unchanged through drying. Common dried meat products are beef jerky from the USA, biltong from South Africa, and tasajo from South America (Heinz & Hautzinger, 2007).
Meat may be smoked raw or after salting, marinating, cooking, or other treatments. There are many types of smoking, leading to prod-ucts with very different sensory properties and

Red meat and processed meat
35
shelf-lives. Warm or cold smoking can be used. Warm smoking is carried out at temperatures of 23–45 °C. Cold smoking is carried out at temper-atures of 12–25 °C and is used in the manufac-turing of raw fermented sausages made from cured meats.
Drying and smoking are used to improve the shelf-life and organoleptic properties of meat products. In developing countries such as Africa, where extending shelf-life is the priority, drying is the most used process. In parallel with simple drying, west Africa has refined the hot smoking process to further improve shelf-life through the preservative and antibacterial effects of smoke substances. To lower the cost of meat products, African countries have also developed tradi-tional products consisting of mixtures of meat and vegetables. Central and southern American countries have adapted European meat processing techniques for local meat products, especially for barbecuing (e.g. chorizo criollo or morcilla) (Heinz & Hautzinger, 2007).
1.2 Meat composition
1.2.1 Red meat
(a) Main components
The animal carcass consists of muscle, connective tissue, fat and bone, and about 75% water, depending on the species, breed, size, and age. For a given species, the muscle is rela-tively constant in composition (Table 1.1). Red meat contains high biological value proteins and essential micronutrients, including vita-mins and minerals (Table 1.2; Williams, 2007). The composition of the meat varies based on the animal species, sex, age, and diet, as well as the climate and activity during its growth (Lorenzo et al., 2010). Total nitrogen, fat, and iron levels increase as the animal approaches maturity. In addition, the ratio of polyunsaturated fatty acids (PUFAs) to saturated fatty acids (SFAs) decreases with the maturity of the animal. The nutritional
value of meat is also significantly affected by the livestock production system (Lorenzo et al., 2010, 2014).
(i) ProteinRed meat contains 20–25 g of protein
per 100 g. The proteins are highly digestible (94%) and provide all essential amino acids (lysine, threonine, methionine, phenylalanine, tryptophan, leucine, isoleucine, and valine) (Williams, 2007).
(ii) FatRed meat is also a source of fatty acids. Fat
in red meat is subcutaneous, intramuscular, or intermuscular, and the composition will vary according to the animal’s age, sex, breed, and diet, as well as the cut of meat (Wood & Enser, 1997). For example, the amount of fat in raw cattle longissimus muscle can range from 0.59% to 16%, depending on the breed (Barnes et al., 2012). Fat in meat includes SFAs, mono-unsaturated fatty acids (MUFAs), and PUFAs. The typical fatty acid composition of fat in beef is reported to be 46.5, 48.9, and 4.59 g per 100 g of total fatty acids for SFAs, MUFAs, and PUFAs, respectively. While these proportions are similar in all red meats, exact amounts depend on the type of meat (Givens, 2005). The main SFAs present in red meat are palmitic acid and stearic acid, and the main MUFA is oleic acid. Red meat also contains n-3 PUFAs, such as α-linolenic acid, and n-6 PUFAs, such as linoleic acid. The animal’s diet strongly influences PUFA levels in meat. For example, meat from foals raised by extensive production systems on wood pastures has higher levels of n-3 PUFAs than meat from foals fed concen-trate (Lorenzo et al., 2010, 2014). The last cate-gory of fat found in the red meat of ruminants is conjugated linoleic acids, the levels of which also depend on feeding practices (Wood et al., 1999; Givens, 2005).
IARC MONOGRAPHS – 114
36
Table 1.1 Chemical composition of typical mammalian muscle (red meat) for consumption
Main component Constituents Wet weight (%)
Water 75.00 Protein 19.00 Myofibrillar: 11.50 Myosin 5.50 Actin 2.50 Connectin 0.90 Nebulin (N2 line protein) 0.30 Tropomyosins 0.60 Troponins, C, I and T 0.60 α,β,γ Actinins 0.50 Myomesin (M-line protein) and C proteins 0.20 Desmin, filamin, F- and I-proteins, etc. 0.40 Sarcoplasmic: 5.50 Glyceraldehyde phosphate dehydrogenase 1.20 Aldolase 0.60 Creatine kinase 0.50 Other glycolytic enzymes 2.20 Myoglobin 0.20 Haemoglobin and other unspecified extracellular proteins 0.60 Connective tissue and organelles: 2.00 Collagen 1.00 Elastin 0.05 Mitochondrial etc. (including cytochrome c and insoluble enzymes) 0.95Lipid 2.50 Neutral lipid; phospholipids; fatty acids; fat-soluble substances 2.50Carbohydrate 1.20 Lactic acid 0.90 Glucose-6-phosphate 0.15 Glycogen 0.10 Glucose, traces of other glycolytic intermediates 0.05Miscellaneous, soluble non-protein substances 2.30 Nitrogenous: 1.65 Creatinine 0.55 Inosine monophosphate 0.30 Di- and tri-phosphopyridine nucleotides 0.10 Amino acids 0.35 Carnosine, anserine 0.35 Inorganic: 0.65 Total soluble phosphorus 0.20 Potassium 0.35 Sodium 0.05 Magnesium 0.02 Calcium, zinc, trace metals 0.03Vitamins Various fat- and water soluble vitamins Minute
This table was published in Lawrie’s Meat Science 6th edition, Lawrie (1998), Page No 59, Copyright Elsevier (1998)

Red meat and processed meat
37
(iii) VitaminsThe only natural source of vitamin B12 is in
food derived from animal products. Red meat is a rich source of B vitamins such as B6, B12, niacin, and thiamine (Gille & Schmid, 2015). For example, 100 g of lean beef meat will provide 2.5 µg of vitamin B12, corresponding to 79% of the recommended dietary intake for this nutrient. The older the animal, the richer its meat will be in B vitamins (Williams, 2007). Pork contains a high level of thiamine compared with other meats (Bender, 1992). While the concentration of vitamin E in red meat is low, it is higher in fattier cuts of meat. Vitamin A and folate are found at higher levels in liver than in lean muscle meat (Bender, 1992).
(iv) MineralsRed meat is one of the richest sources of
minerals such as iron or zinc, and has a higher mineral bioavailability than plant products (Williams, 2007). For example, 100 g of lean beef meat will provide approximatively 1.8 mg of iron and 4.6 mg of zinc, corresponding to approximately 14% and 42%, respectively, of the recommended dietary intake for these nutri-ents (Williams, 2007). Red meat is also a good source of selenium. For example, 100 g of lean beef meat will provide about 17 µg of selenium, corresponding to approximately 26% of the recommended dietary intake for this nutrient (Williams, 2007).
Table 1.2 Average nutrient composition (per 100 g) of the lean component of red meat
Nutrient Beef Veal Lamb Mutton
Moisture (g) 73.1 74.8 72.9 73.2Protein (g) 23.2 24.8 21.9 21.5Fat (g) 2.8 1.5 4.7 4.0Energy (kj) 498 477 546 514Cholesterol (mg) 50 51 66 66Thiamin (mg) 0.04 0.06 0.12 0.16Riboflavin (mg) 0.18 0.20 0.23 0.25Niacin (mg) 5.0 16.0 5.2 8.0Vitamin B6 (mg) 0.52 0.8 0.10 0.8Vitamin B12 (μg) 2.5 1.6 0.96 2.8Pantothenic acid (mg) 0.35 1.50 0.74 1.33Vitamin A (μg) < 5 < 5 8.6 7.8Beta-carotene (μg) 10 < 5 < 5 < 5Alpha-tocopherol (mg) 0.63 0.50 0.44 0.20Sodium (mg) 51 51 69 71Potassium (mg) 363 362 344 365Calcium (mg) 4.5 6.5 7.2 6.6Iron (mg) 1.8 1.1 2.0 3.3Zinc (mg) 4.6 4.2 4.5 3.9Magnesium (mg) 25 26 28 28Phosphorus (mg) 215 260 194 290Copper (mg) 0.12 0.08 0.12 0.22Selenium (μg) 17 < 10 14 < 10Adapted from Williams (2007). Nutrition & Dietetics, John Wiley & Sons

IARC MONOGRAPHS – 114
38
(v) CreatineCreatine levels in skeletal muscle average
350 mg per 100 g of red meat (Purchas & Busboom, 2005; Williams, 2007). Cooking of the muscle meat transforms creatine into creatinine through non-enzymatic conversion. Creatine and creatinine in meat are critical precursors in the formation of heterocyclic aromatic amines (HAAs) (Skog et al., 1998, 2000).
(b) Effect of slaughtering and storage post mortem
Preslaughter handling of the animal can have an impact on the composition and quality of the meat. For example, stressed or fatigued animals have depleted glycogen. Before slaughtering, animals are usually stunned and then exsanguin-ated. Blood is drained from the carcass, leading to a loss of oxygen and a depletion of adenosine triphosphate, as well as the combination of the proteins actin and myosin to form actinomyosin to cause muscle contraction. After slaughtering, glycogen is converted to lactic acid, and pH levels fall to approximately 5.5 over a period of 24–36 hours and can have an impact on microbial content (Lawrie, 1998; Lawrie & Ledward, 2006).
A major safety concern in meat production and storage is bacterial contamination. Although muscle is usually sterile, bacterial contamination from gastrointestinal contents and butchering instruments is common. Bacterial contamination is minimized by low temperatures, low tempera-tures and packaging in a controlled atmosphere. Minced and comminuted meats with larger surface areas may be more likely to become contaminated than large cuts of meat (Lawrie, 1998; Lawrie & Ledward, 2006). Physical and chemical methods, such as spray washing with hot water, can be used for microbial decontami-nation. Water may be chlorinated and combined with weak organic acids, phosphates, hydrogen peroxide, or ozone to improve antimicrobial activities. Improving hygiene levels by means of
antibiotics (chlorotetracycline and oxytetracy-cline) is increasingly discouraged and regulated. Irradiation is permitted in the USA, but it can induce free radical formation (Isam et al., 2007). Freezing of red meat results in little to no loss of nutrients, apart from vitamin E, which is oxidized. Proteins remain unchanged during frozen storage, but fats are susceptible to changes from oxidation. Pork meat, which is richer in unsaturated fatty acids than other red meats, is the most suscep-tible to these changes. Once meat is defrosted, the juices containing soluble proteins, vitamins, and minerals are lost (Rahman, 2007).
(c) Chemical contaminants and residues
Residues of drugs (e.g. antibiotics and hormones), pesticides, and agricultural chemi-cals can be found in meat and meat products (e.g. as a result of exposure of the animals to chemi-cals used on buildings, grazing areas, and crops) (Fig. 1.1; Engel et al., 2015). Additionally, several hundred substances may be used to treat animals, to preserve animal health, and to improve animal production, including antimicrobial agents, anti-coccidial agents, anthelmintics, steroids, anti-in-flammatory agents, tranquillizers, vasodilators, analgesics, and anaesthetics (FDA, 2005).
(i) Veterinary drugsVeterinary drugs given to animals are strictly
regulated in most developed countries (FDA, 2005), and maximum residue limits (MLRs) have been established for some of these drugs by the Codex Alimentarius.
Antibiotics: In the European Union (EU), the only antibiotics allowed as feed additives are coccidiostats and histomonostats (European Commission, 2003), as other antibiotics, espe-cially if they are also used for humans, could induce antimicrobial resistance in consumers (Chattopadhyay, 2014). Cooking procedures degrade the residues of several antibacterial drugs, depending on the amount of heat

Red meat and processed meat
39
treatment involved, principally cooking time and temperature (Heshmati, 2015).Hormones: In several countries, such as the USA, the use of hormones, including testosterone propionate, estradiol, estradiol benzoate, and progesterone, and compounds that display a high affinity for human hormone receptors are approved for food animal production. This raises concerns because these hormones, or their biologically active metabolites, may accumulate in edible tissues, potentially exposing consumers (Nachman & Smith, 2015). Cooking reduces, but does not eliminate, the potential for dietary exposure to hormones, such as estradiol, in ground beef (Braekevelt et al., 2011). Table 1.3 lists the amounts of steroid hormones ingested via the diet from hormone-treated or non–hormone-treated animals, and the amounts of these hormones produced daily in the human body. [The Working Group noted that the ingestion of estradiol, progesterone, and testosterone from meat appears to be minor relative to what is biosynthesized in humans (Table 1.3).]
Environmental and phytosanitary contami-nants can also occur in meat products.
(ii) Pesticide residuesPesticide residues used for phytosanitary
treatments may be present in meat products. Animals consume plants treated with pesti-cides or contaminated by persistent pesti-cides in the environment. However, vegetable consumption remains by far the main dietary source of human exposure to pesticides (Kan & Meijer, 2007).
(iii) Dioxins and dioxin-like productsDioxins and dioxin-like products are divided
into three groups: polychlorinated dibenzodi-oxins (PCDDs), polychlorinated dibenzofurans (PCDFs), and polychlorinated biphenyls (PCBs) (see Fig. 1.1).
These contaminants, which are mainly produced by industrial processes, are ubiquitous in foods of animal origin, and accumulate in the fatty tissues of animals and humans (Larsen, 2006; IARC, 2012a, 2016). Food, including meat, remains the primary source of human exposure to these contaminants in the general population (IARC, 2012a, 2016).
(iv) Brominated flame retardantsBrominated flame retardants (BFRs) are
widely used in plastic materials, textiles, electric and electronic equipment, and of construction materials for livestock buildings. There are five classes of BFRs: polybrominated diphenyl ethers (PBDEs), hexabromocyclododecanes (HBCDs), tetrabromobisphenol A, and other phenols, poly-brominated biphenyls (PBBs) (IARC, 2016), and unclassified BFRs (ANSES, 2011, 2012; IARC, 2016). The persistence of BFRs in the environment is a public health concern (AFSSA, 2005; ANSES, 2011; EPA, 2010). The main source of human exposure to BFRs is the consumption of fish and meat products (Lyche et al., 2015). Studies have shown that the cooking process and, to a greater extent, the type of meat item influence levels of PDBEs.
(v) Polycyclic aromatic hydrocarbonsPolycyclic aromatic hydrocarbons (PAHs) can
be generated in the environment or during the processing of foods; this is discussed further in Section 1.2.3(a)(iii). PAHs are closely monitored by health agencies in developed countries (IARC 2010a; Schroeder, 2010). Furthermore, PAH levels can increase depending on cooking conditions.
(vi) Heavy metalsContamination by heavy metals such as
cadmium, lead, arsenic, or mercury largely occurs from industrial wastes (IARC, 2012b). Meat consumption is a significant source of human exposure to lead and cadmium (Kan & Meijer, 2007).
IARC MONOGRAPHS – 114
40
(vii) MycotoxinsMycotoxins, metabolites produced by
mould, are toxic and may be carcinogenic to animals and humans. Livestock contamination by mycotoxins occurs via their diet, and human exposure results from consumption of contam-inated livestock. However, cereals and oil seeds are the main sources of human exposure to mycotoxins (FDA, 2008; Marroquín-Cardona et al., 2014). Mycotoxin residues accumulate in the blood, liver, and kidney, and, to a lesser degree, in muscle-derived meat products (Kan & Meijer, 2007). Mycotoxins, such as afla-toxin, are not destroyed by normal industrial processing or cooking since they are heat-stable (Awadt et al., 2012).
1.2.2 Processed meat
(a) Ingredients
There are three major reasons for processing meat: reduction in microbial contamination, production of attractive products, and reduc-tion of waste by reconstitution of muscle meat scraps or offal. Therefore, along with the main components, which are meat and animal
fat, a wide range of non-meat substances are used in processed meat products (Bender, 1992; Heinz & Hautzinger, 2007; Toldrá, 2010; Weiss et al., 2010).
(i) Non-meat ingredients of animal originAlthough not commonly applied, non-meat
ingredients of animal origin may be used to improve water binding and prevent fat separa-tion during heat treatment. Some of these ingre-dients can also be considered as meat extenders. The most commonly used non-meat ingredients of animal origin are milk caseinate; whole milk or non-fat, dried milk; gelatine; blood plasma; eggs; and transglutaminase (Sun & Holley, 2011).
(ii) Ingredients of plant originSpices are predominantly functional ingredi-
ents, and are used in small quantities to provide or add flavour and taste to meat products. The most commonly used ingredients of plant origin are isolated soy protein (≤ 90% protein) and wheat gluten (≤ 80% protein). The most common ingre-dients used as fillers (if rich in carbohydrate) or meat extenders (if rich in protein) are soy flour or concentrate, cereal flour or cereals, starches, breadcrumbs, vegetables, and fruits (Asgar et al.,
Table 1.3 Comparison of the amounts of steroid hormones produced daily in the human body and ingested via the diet from hormone-treated animals
Hormone Total daily production (µg/day)(JECFA, 2000; EFSA, 2007)
Residue in muscle (µg/kg) (Paris et al., 2006) Ingested amount via intake of muscle from treated animalsa (µg/day)Non-treated animals Treated animals
Estradiol < 14 (prepubertal boys) 10–24 (prepubertal girls) 27–68 (adult men) 30–470 (adult women)
0.003–0.035 0.011–0.28 0.0033–0.084
Progesterone 150–250 (prepubertal children) 416–750 (adult men, premenopausal women)
0.0–0.9 0.23–0.77 0.069–0.231
Testosterone 30–100 (prepubertal children) 210–480 (adult female) 2100–6900 (adult male)
0.006–0.029 0.031–0.36 0.0093–0.108
a Calculated according to an intake of 300 g/day of muscleReprinted from Jeong et al. (2010) © 2010 The Korean Society of Toxicology. License: CC BY-NC 3.0

Red meat and processed meat
41
2010). Several plant derivatives can also be used as fat replacers, antioxidants, or antimicrobials (Hygreeva et al., 2014).
(iii) Chemical substances used as additivesThere are a limited number of chemical
substances allowed for meat processing, as the substances need to be safe for consumers and improve the quality of the final product. The most commonly used substances are salt (NaCl or NaCl plus KCl) for taste, impact on meat proteins, and shelf-life; nitrate and nitrite for curing, colour, flavour, and shelf-life; ascorbic acid for acceler-ated curing; phosphates for protein structuring and water binding; chemical preservatives for shelf-life; antioxidants for flavour and shelf-life; monosodium glutamate for enhancement of
flavour; and food colourings. Chemical additives have exclusively functional properties. They are used in small amounts, usually below 1%, with nitrate as low as 0.05% and with only salt in the range of 2% (≤ 4% in some fermented dried prod-ucts) (Heinz & Hautzinger, 2007).
(b) Processing methods
Standard technical processing methods for meat products, such as cutting, comminuting, mixing, tumbling, or stuffing, are an important part of the manufacturing process (Heinz & Hautzinger, 2007). However, as these processes do not influence the formation of potentially carcinogenic process-induced toxicants, they will not be further detailed in this section.
Fig. 1.1 Examples of environmental micropollutants potentially found in red and processed meats
O
O
Cl
Cl
Cl
Cl
OCln
Clm
2,3,7,8-Tetrachlorodibenzo-p-dioxin(TCDD)
Polychlorinated dibenzofuran(PCDFs)
Cln
Clm
Polychlorinated biphenyls(PCBs)
OBrm
Brn
Polybrominated diphenyl ethers(PBDEs)
Benzo[a]pyrene(BaP)
Cl
Cl
ClCl
ClCl
Lindane(pesticide)
Adapted from Meat Science, Volume 109, E. Engel, J. Ratel, J. Bouhlel, C. Planche, M. Meurillon, Novel approaches to improving the chemical safety of the meat chain towards toxicants, Pages No. 75–85, Copyright (2015), with permission from Elsevier (Engel, 2015)
IARC MONOGRAPHS – 114
42
Microbial inactivation can be achieved by “sous vide”, a method whereby foods are vacu-um-packaged and then slow-cooked (tempera-ture, 55–60 °C), as well as by cooking, canning (temperature, up to 121 °C), irradiation (chilled temperature, 0–4 °C), and high-pressure processing (300–600 MPa). Microbial inactiva-tion can also be achieved by the addition of arti-ficial preservatives such as nitrate or nitrite, weak organic acids, and/or salt or sugar. Canning is probably the most efficient meat preservation method, as it ensures the destruction of path-ogens and food spoilage microorganisms, and allows foods to be easily handled and trans-ported (Guerrero Legarreta, 2010).
The most common approaches to retard lipid oxidation, a major limiting factor in the shelf-life of dehydrated muscle tissue, is the addition of antioxidants and the use of appropriate pack-aging techniques (Rahman, 2007).
Chemical processing methods essentially include curing, smoking, and fermentation.
(i) CuringMeat curing, in the narrow sense, is the
addition of salt (NaCl or NaCl plus KCl), with or without nitrate or nitrite, during the manu-facturing of meat products. Nitrate and nitrite are not used as sole curing agents. Each is always applied with salt. In meat products, the concentra-tions of nitrate and nitrite are usually in the range of 100–200 mg/kg, while salt is 2000 mg/kg or more. Salt lowers the water activity and enhances food safety. Salt also changes the protein struc-tures in meat. Nitrate and nitrite support the safety action of salt, and improve the appearance and flavour. Nitrate must undergo reduction to nitrite to be effective. During the curing process, myoglobin is converted to nitrosomyoglobin, resulting in the characteristic cured meat colour (EFSA, 2003; Honikel, 2008, 2010). Over the past few decades, ascorbic acid or its salt, ascorbate (e.g. isoascorbate or erythorbate), has been used in cured meat batters. Ascorbate reacts with oxygen
to form dehydroascorbate, and thus prevents the oxidation of nitrite to nitrate. Ascorbate is also added to reduce the formation of nitrosamines. Ascorbate, together with nitrite and salt, has an effective antimicrobial effect, particularly against Clostridium botulinum (Honikel, 2010; Sindelar & Milkowski, 2012). Citric acid or sodium citrate may replace up to half of either form of the ascor-bate/erythorbate reductants, but may not be used without the reductants (Sindelar et al., 2010). Nitrite addition is strictly regulated by inter-national standards, and the amount allowed in cured meat is decreasing (see Section 1.5).
(ii) SmokingSmoking refers to the exposure of meat
to the smoke of burning wood (Sikorski & Kalakowski, 2010). Many cured products are also smoked, or contain soluble components of wood smoke, mainly to add flavour and increase shelf-life. Smoking gives meat a brown colour. It changes its flavour and improves its pres-ervation, as smoke contains a wide variety of polyphenolic compounds as well as aldehydes and carboxylic acids, which have antimicrobial properties. Smoking can be done at different temperatures, depending on the end product (Sikorski & Kalakowski, 2010). However, wood pyro lys is may be hazardous, as the process is difficult to control and can lead to the gener-ation of PAHs. Modifications to traditional wood pyrolysis processes are being studied to reduce the production and deposition of PAHs in processed meat (Roseiro et al., 2011; Ledesma et al., 2014). An alternative is to use liquid smoke flavouring solutions produced from different wood products, under specific pyrolysis condi-tions and as per extraction protocols aimed at strongly reducing the concentration of PAHs (Sikorski & Kalakowski, 2010).

Red meat and processed meat
43
(iii) FermentationFermentation refers to a low-energy, biolog-
ical acidulation (by cultured or wild microor-ganisms) and preservation method that results in a distinctive flavour and palatability, colour, and tenderness, as well as in enhanced micro-biological safety. Since this process involves microorganisms, it is influenced by many envi-ronmental factors, including raw meat quality, sanitation, time, temperature, and humidity, all of which need to be strictly controlled during production. The reduction of pH and the lowering of water activity are microbial hurdles that aid in producing a safe product. Both natural and controlled fermentation processes involve lactic acid bacteria. Fermented sausages often have a long storage life, due to added salt, nitrate, and/or nitrite, and a low pH, due to lactic acid produc-tion by bacteria in the early stages of storage and later stages of drying (Ockermann & Basu, 2010).
1.2.3 Changes in meat composition due to cooking methods
Cooking can have a positive and negative impact on food quality. Cooking is important to inactivate pathogenic microorganisms, and improve palatability and digestibility (Santé-Lhoutellier et al., 2008; Bax et al., 2012, 2013).
Generally, cooking reduces, but does not eliminate, meat contaminants such as hormones, antibiotics, chemicals (e.g. PCBs, PCDFs, and PCDDs), or metals (e.g. arsenic, cadmium, mercury, and lead) (Hori et al., 2005; Perelló et al., 2008; Perelló et al., 2010; Braekevelt et al., 2011; Zeitoun & Ahmed, 2011; Heshmati, 2015). Furthermore, cooking can lead to the production of potential carcinogens.
The different cooking methods used to prepare red and processed meat may have varying influences on the production of potential carcinogens (Table 1.4). Cooking methods differ based on cooking temperature, direct or indirect contact with the heating source (flame), and use
of fat. The method has an impact on the forma-tion of carcinogenic compounds such as HAAs or PAHs (Skog et al., 1998; Giri et al., 2015). At low temperatures (around 100 °C), steaming, boiling, or stewing generate much lower levels of these carcinogenic compounds. For baking and roasting, temperatures are higher (up to 200 °C), but as there is limited direct contact with a hot surface, the formation of these carcinogenic compounds is also low (Rohrmann et al., 2002). Barbecuing, grilling, and pan-frying expose meat products to high temperatures, and to a hot surface or to direct flame, and thus can produce an appreciable level of these carcino-genic compounds (American Institute for Cancer Research/World Cancer Research Fund, 1997; Sinha et al., 1998a, b).
(a) Red meat
This part of the section focuses on the toxi-cants found in red meat that are mostly produced by certain heating and cooking conditions.
(i) N-Nitroso compounds N-Nitroso compounds (NOCs) are mainly
formed endogenously in human organisms. No data report their formation in red meat during heat treatment; they are mainly considered processed meat toxicants (see Section 1.2.3(b)(i)).
(ii) Heterocyclic aromatic aminesHAAs are a family of heat-induced food toxi-
cants that were discovered about 30 years ago by Professor Sugimura. Currently, about 25 HAAs have been identified in cooked meat, fish, and poultry products (Sugimura et al., 2004), as well as in cigarette smoke and diesel exhaust (Manabe et al., 1991). HAAs can be divided into two distinct families: aminoimidazoazaarenes and carbo-lines or pyrolytic HAAs (Fig. 1.2 and Table 1.5). Aminoimidazoazaarenes are formed by Maillard reaction (a chemical reaction between amino acids, creatine/creatinine, and sugars), whereas carbolines and pyrolytic HAAs are formed at

IARC MONOGRAPHS – 114
44
elevated temperatures (Murkovic, 2004). The main source of human exposure to HAAs is via cooked proteinaceous foods; however, the levels of HAAs are highly dependent on the type of meat, cooking time, and cooking temperature, and generally increase with the level of “done-ness” (Skog et al., 2000).
The cooking method also influences HAA formation; it has been shown that high-temper-ature methods (pan-frying, grilling, and barbe-cuing) cause the highest HAA concentrations, especially for 2-amino-1-methyl-6-phenylimida-zo[4,5-b]pyridine (PhIP) (Alaejos & Afonso, 2011). The concentrations of HAAs in different cooked
meats are given in Table 1.6. The concentrations of HAAs are highly variable. For a comprehen-sive review, see Alaejos & Afonso (2011). A series of linear tricyclic ring HAAs containing the 2-amino-1-methylimidazo[4,5-g]quinoxaline (IgQx) skeleton are formed in cooked meats at concentrations that are relatively high compared with the concentrations of their angular tricyclic ring isomers or related HAAs (Ni et al., 2008), such as 2-amino-3,8-dimethylimidazo[4,5-f]quinoxaline (MeIQx) and PhIP, which are known experimental animal carcinogens and potential human carcinogens (IARC, 1993). The toxicolog-ical properties of these recently discovered IgQx
Table 1.4 Definition of cooking methodsa
Cooking methodb Definition
Baked Cooked by dry heat in an oven, covered or uncovered, no additional fat used for cookingBarbecued Cooked on grill bars over burning charcoal, wood or gasBattered and baked Covered by batter (flour, milk, and egg mixture) and bakedBattered and fried Covered by batter (flour, milk, and egg mixture) and friedBoiled Cooked in boiling liquidBreaded and baked Covered by an outer layer of breadcrumbs and bakedBreaded and fried Covered by an outer layer of breadcrumbs and friedBreaded and griddled Covered by an outer layer of breadcrumbs and griddledCoated and fried Covered by an outer layer and fried: includes battered and fried, breaded and fried, in flour and friedDeep fried Cooked in hot fat or oil by immersing the food entirelyFried Generic descriptor for cooked in heated fat, usually over a direct source of heatGriddled Cooked on a heated flat metal surface over a source of direct heat; a little fat or oil may be used to
grease the metal surfaceGrilled Cooked rapidly without moisture, on grill bars under or over intense direct heat, no fat usedIn flour and fried Covered by an outer layer of flour and friedMicrowaved Cooked or reheated in a microwave oven; no fat usedPoached Cooked by dropping in boiling liquidReheated Made hot; no liquid nor fat is addedRoasted Cooked by dry heat in an oven or over a fireShallow fried Cooked in a shallow layer of heated fatSteamed Cooked by steam, in pressure cooker or cooked suspended above boiling waterStewed Cooked by boiling or simmering in liquid contained in an enclosed vessel; the food is cooked over a
low heat for a long period of timeStir fried/sautéed Cooked by frying food over high heat, by stirring constantly to avoid stickingToasted Cooked with direct heat until the surface of the food is browned
a Definitions based on the EPIC Study, Rohrmann et al. (2002)b Cooking method is defined as the preparation of meat items just before consumptionAdapted by permission from Macmillan Publishers Ltd: Rohrmann et al. (2002). Cooking of meat and fish in Europe--results from the European Prospective Investigation into Cancer and Nutrition (EPIC).European Journal of Clinical Nutrition, Volume 56, issue 12, pages 1216–1230, copyright (2002)

Red meat and processed meat
45
derivatives warrant further investigation and assessment.
Some methods to decrease the levels of HAAs in cooked meats have been described. For example, microwave pretreatment followed by disposal of the resulting liquid before frying of hamburger patties reduces the formation of some aminoimidazoazaarenes (Felton et al., 1992). Various studies have also emphasized the role of added antioxidants with phenolic or polyphenolic
moiety in the limitation of HAA formation – via their scavenging capacity for reactive radicals involved in the HAA mechanism of formation (Balogh et al., 2000; Vitaglione & Fogliano, 2004; Gibis & Weiss, 2010, 2012). Other compounds, such as organosulfur compounds, contained in garlic or onion, have also been shown to have an inhibitory effect on HAA formation (Shin et al., 2002).
Fig. 1.2 Structures of heterocyclic aromatic amines found in cooked red and/or processed meats
N
NN
R
NH2
CH3 N
N
NN
R1
NH2
CH3R3
R2N
N
N
CH3
NH2
R = H (IQ)
R = Me (MeIQ)
R1, R2 = H, R3 = Me (8-MeIQx)
R1, R3 = Me, R2 = H (4,8-DiMeIQx)
PhIP
Principal aminoimidazoazaarenes found in red and processed meats
Principal pyrolytic HAAs found in red and processed meats
N
N
CH3
H
Harman
N
N
HN
N
CH3
H3C
NH2
H
Norharman Trp-P-1
N
NNH2
H3C
H
Trp-P-2
NN
NH2
HN N
CH3
NH2
AC
H
MeAC
The full chemical names of these compounds are given in Table 1.5HAA, heterocyclic aromatic aminesReprinted from Cancer Science, Volume 95, Takashi Sugimura, Keiji Wakabayashi, Hitoshi Nakagama, Minako Nagao, Heterocyclic amines: Mutagens/carcinogens produced during cooking of meat and fish, Pages No. 290–299, Copyright (2004), with permission from John Wiley & Sons (Sugimura et al, 2004)

IARC MONOGRAPHS – 114
46
(iii) Polycyclic aromatic hydrocarbons The main source of non-occupational human
exposure, for non-smoking individuals, is food consumption (Kazerouni et al., 2001). PAHs can be formed by pyrolysis of organic materials, direct contact of fat with a flame, or incomplete combustion of charcoal, so they are present in grilled meats (Chen & Lin, 1997; Alomirah et al., 2011). More than 30 PAHs have been iden-tified; among them is benzo[a]pyrene (BaP), which is classified as a Group 1 human carcin-ogen (IARC, 2012a). The main PAHs found in processed meats are presented in Fig. 1.3 and Table 1.7. Representative concentrations of PAHs in different processed meat samples are given in Table 1.8.
By avoiding the direct contact of meat with a flame, PAH levels can be lowered. The amount of fat can also influence PAH levels. The more fat that is contained in meat, the more PAHs are
produced. This may be related to the pyrolysis of fat, which drips onto the heat source (Mottier et al., 2000).
Heat treatment of red and processed meat can also produce other toxicants, such as acrylamide (Tareke et al., 2002) and N-methylacrylamide (Yaylayan et al., 2004).
(iv) IronIron is a trace element essential for human
health that can be found in foods of animal and plant origin. In food, iron can be found in two forms: haem iron and non-haem iron. Haem iron, which is more bioavailable than non-haem iron, is only found in animal products (Schonfeldt & Hall, 2011). Haem iron is contained in myoglobin and haemoglobin, whereas non-haem iron is associated with small molecules such as phos-phate, ascorbate, or free amino acids to form salts. The amount of iron in meat, and the ratio between haem and non-haem iron, depends on
Table 1.5 Chemical names of heterocyclic aromatic amines potentially found in cooked red and processed meats
Common abbreviation Full name
IQ 2-amino-3-methylimidazo[4,5-f]quinolineMeIQ 2-amino-3,4-dimethylimidazo[4,5-f]quinolineIQx 2-amino-3-methylimidazo[4,5-f]quinoxalineMeIQx 2-amino-3,8-dimethylimidazo[4,5-f]quinoxaline4,8-DiMeIQx 2-amino-3,4,8-trimethylimidazo[4,5-f]quinoxaline7,8-DiMeIQx 2-amino-3,7,8-trimethylimidazo[4,5-f]quinoxaline4-CH2OH-8-MeIQx 2-amino-4-hydroxymethyl-3,8-dimethylimidazo[4,5-f]quinoxalinePhIP 2-amino-1-methyl-6-phenylimidazo[4,5-b]pyridine4′-hydroxy-PhIP 2-amino-6-(4-hydroxyphenyl)-1-methylimidazo[4,5-b] pyridineTrp-P-1 3-amino-1,4-dimethyl-5H-pyrido[4,3-b]indoleTrp-P-2 3-amino-1-methyl-5H-pyrido[4,3-b]indoleAαC 2-amino-9H-pyrido[2,3-b]indoleMeAαC 2-amino-3-methyl-9H-pyrido[2,3-b]indoleGlu-P-1 2-amino-6-methyldipyrido[1,2-a:3′2′-d]imidazoleGlu-P-2 2-aminodipyridol[1,2-a:3′2′-d]imidazoleHarman 1-methyl-9H-pyrido[3,4-b]indoleNorharman 9H-pyrido[3,4-b]indoleIgQx 2-amino-1-methylimidazo[4,5-g]quinoxalineNote: the chemical structure of some of these HAAs is given in Fig. 1.2Adapted with permission from Sugimura et al. (2004) and Alaejos & Afonso (2011)

Red meat and processed meat
47
Tabl
e 1.
6 Co
ncen
trat
ions
of h
eter
ocyc
lic a
rom
atic
am
ines
in d
iffer
ent c
ooke
d m
eats
Coo
ked
mea
tC
once
ntra
tion
s of H
AA
s (ng
/g)
IQM
eIQ
8-M
eIQ
x4,
8-D
iMeI
Qx
PhIP
Trp-
P-1
Trp-
P-2
Har
man
Nor
harm
anA
αC
Min
ced
beef
(fr
ied,
gri
lled,
an
d ba
rbec
ued)
ND
–12
ND
–8N
D–7
ND
–3N
D–3
4N
D to
<
1.45
ND
–2N
D–2
8N
D–3
0N
D–2
1
Beef
(roa
sted
an
d ov
en-
broi
led)
ND
to
< 0.
2N
D to
<
0.2
ND
–17.
5N
D–3
.4N
D–3
2.4
ND
–0.0
1N
DN
D–2
40a
ND
–205
bN
D–0
.11
Beef
ext
ract
(p
rodu
cts
com
mer
cial
ly
cook
ed)
ND
–75
ND
–10
ND
–38
ND
–6N
D–1
0N
D–1
3N
D–1
4N
Q–3
77N
Q–9
4N
Q to
< 8
.1
Lam
b (g
rille
d an
d fr
ied)
< 0.
1<
0.1
ND
–3N
D–2
ND
–11b
ND
–1<
0.3
ND
–7N
D–9
ND
–0.5
Pork
(gri
lled
and
frie
d)N
D–7
ND
–11
ND
–21
ND
–28
ND
–32
ND
–1N
D–5
ND
–25a
ND
–51a
ND
–3
Saus
age
(frie
d,
roas
ted,
and
ba
rbec
ued)
ND
–5N
D–2
ND
–5N
D–3
ND
–6N
D–1
ND
–2N
D–3
ND
–10
<0.0
3
Baco
n (fr
ied)
ND
–11
ND
–2N
D–2
7N
D–9
ND
–106
b0.
6<
0.29
N
D–3
3N
D–6
0N
Q to
< 0
.5Pa
n sc
rapi
ngs
from
diff
eren
t m
eats
< 2
29–6
34–
1583
–144
3–77
a Th
e hi
ghes
t lev
els o
f har
man
and
nor
harm
an w
ere
foun
d in
com
mer
cial
ly ro
aste
d be
ef (K
han
et a
l., 2
008)
b A
stud
y in
the
Repu
blic
of K
orea
repo
rted
ver
y hi
gh c
once
ntra
tions
of P
hIP
(258
ng/
g), h
arm
an (9
90 n
g/g)
, and
nor
harm
an (4
13 n
g/g)
in g
ridd
led
pork
loin
, and
of P
hIP
(168
ng/
g) in
gr
iddl
ed b
acon
(Bac
k et
al.,
200
9)4,
8-D
iMeI
Qx,
2-a
min
o-3,
4,8-
trim
ethy
limid
azo[
4,5-
f]qu
inox
alin
e; 8
-MeI
Qx,
2-a
min
o-3,
8-di
met
hylim
idaz
o[4,
5-f]
quin
oxal
ine;
AɑC
, 2-a
min
o-9H
-pyr
ido[
2,3-
b]in
dole
; HA
A,
hete
rocy
clic
aro
mat
ic a
min
es; h
arm
an, 1
-met
hyl-9
H-p
yrid
o[3,
4-b]
indo
le; I
Q, 2
-am
ino-
3-m
ethy
limid
azo[
4,5-
f]qu
inol
ine;
MeI
Q, 2
-am
ino-
3,4-
dim
ethy
limid
azo[
4,5-
f]qu
inol
ine;
ND
, no
t det
ecte
d; n
orha
rman
, 9H
-pyr
ido[
3,4-
b]in
dole
; NQ
, not
qua
ntifi
ed; P
hIP,
2-a
min
o-1-
met
hyl-
6-ph
enyl
imid
azo[
4,5-
b]py
ridi
ne; T
rp-P
-1, 3
-am
ino-
1,4-
dim
ethy
l-5H
-pyr
ido[
4,3-
b]in
dole
; Trp
-P-2
, 3-a
min
o-1-
met
hyl-5
H-p
yrid
o[4,
3-b]
indo
leTa
ble
com
pile
d us
ing
data
from
the
revi
ew o
f Ala
ejos
& A
fons
o (2
011)
, ind
icat
ing
the
low
est a
nd h
ighe
st v
alue
s fou
nd fo
r the
diff
eren
t HA
As i
n di
ffere
nt h
eat-p
roce
ssed
mea
ts

IARC MONOGRAPHS – 114
48
the species and the type of muscle (Lombardi-Boccia et al., 2002; Table 1.9). Red meat contains more total iron and haem iron than white meat. Beef, lamb, and horse meat are richer in haem iron and total iron than pork meat. The age of the animal is also important in iron intake, as older animals contain more iron. During cooking, part of haem iron is converted to non-haem iron, depending on the cooking parameters, such as time and temperature (Lombardi-Boccia et al., 2002; Purchas & Busboom, 2005; Purchas et al., 2006).
(v) Advanced glycation end productsAdvanced glycation end products (AGEPs) are
heat-induced food toxicants, which are protein-bound Maillard reaction products. AGEPs consti-tute a group of heterogeneous moieties produced endogenously from the non-enzymatic glycation of proteins, lipids, and nucleic acids (Krause et al., 2003; Goldberg et al., 2004). They are present in several heated foods, such as canned foods and meat products (Goldberg et al., 2004; Uribarri et al., 2010). The formation of AGEPs is part of the normal metabolism, but if their levels are very high in tissues and in the circulation, they can become pathogenic. Carboxymethyllysine is one of the best-characterized AGEP compounds, and is frequently used as a marker of AGEP forma-tion in food. In meat products, carboxymethyl-lysine ranges from 0.01 to 6.87 mg per 100 g of food (mean, 0.86), and in meat dishes, it ranges from 0.10 to 42.39 mg per 100 g of food (mean, 2.42) (Hull et al., 2012). AGEP levels depend on red meat composition (Goldberg et al., 2004; Chen & Smith, 2015). Indeed, foods high in
protein and lipid content show the highest AGEP levels, probably due to the large quan-tity of free radicals released via the various lipid peroxidation reactions that catalyse the formation of AGEPs during the cooking of meat products. AGEP formation depends on temperature, method, and duration of heating. The higher the cooking temperature, the more AGEPs are formed in red and processed meat. Different studies have shown that oven-frying produces more AGEPs than deep-frying, and broiling produces more AGEPs than roasting. Boiling produces less AGEPs (Goldberg et al., 2004; Chen & Smith, 2015). Cooking duration seems to be less important than the temperature and method, as shown in Table 1.10.
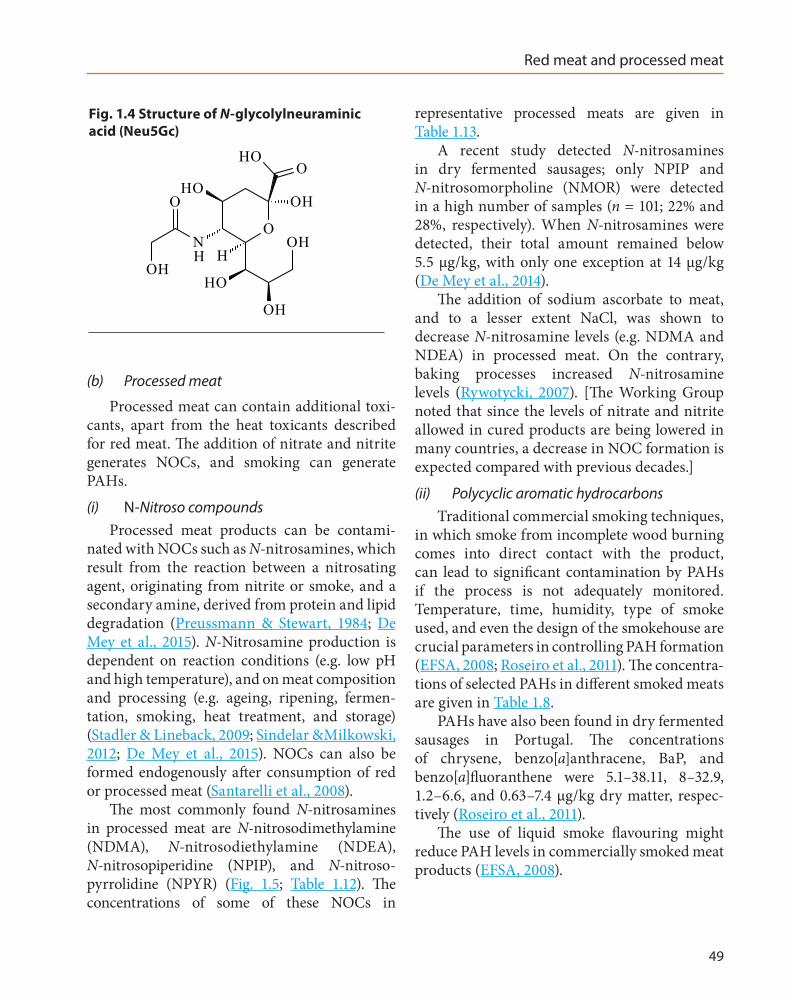
(vi) N-Glycolylneuraminic acid Sialic acids are a family of sugars with a
nine-carbon sugar acid. N-Glycolylneuraminic acid (Neu5Gc) (Fig. 1.4) is one of the most common sialic acids and is found in almost all mammals. Humans are genetically deficient in Neu5Gc production and instead metabolically accumulate it from dietary sources, particu-larly red meat and milk products. However, metabolically accumulated dietary Neu5Gc results in the production of circulating anti-Neu5Gc antibodies, leading to chronic local inflammation (Hedlund et al., 2008). It has been shown that the amount of Neu5Gc is high in red meats compared with other dietary sources, with beef being the most Neu5Gc-enriched compared with other red meats (Tangvoranuntakul et al., 2003; Samraj et al., 2015; Table 1.11).
Fig. 1.3 Structures of polycyclic aromatic hydrocarbons found in red and/or processed meats
Benzo[a]pyrene Chrysene Benz[a]anthracene Benzo[b]fluoranthene
Red meat and processed meat
49
(b) Processed meat
Processed meat can contain additional toxi-cants, apart from the heat toxicants described for red meat. The addition of nitrate and nitrite generates NOCs, and smoking can generate PAHs.
(i) N-Nitroso compoundsProcessed meat products can be contami-
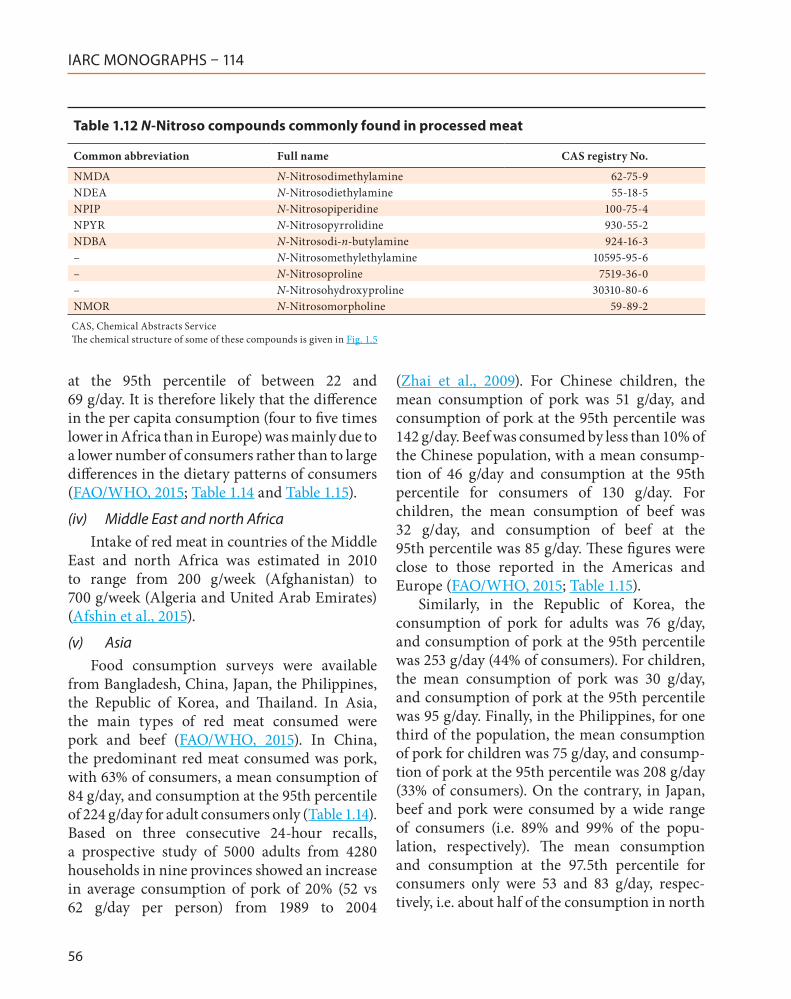
nated with NOCs such as N-nitrosamines, which result from the reaction between a nitrosating agent, originating from nitrite or smoke, and a secondary amine, derived from protein and lipid degradation (Preussmann & Stewart, 1984; De Mey et al., 2015). N-Nitrosamine production is dependent on reaction conditions (e.g. low pH and high temperature), and on meat composition and processing (e.g. ageing, ripening, fermen-tation, smoking, heat treatment, and storage) (Stadler & Lineback, 2009; Sindelar &Milkowski, 2012; De Mey et al., 2015). NOCs can also be formed endogenously after consumption of red or processed meat (Santarelli et al., 2008).
The most commonly found N-nitrosamines in processed meat are N-nitrosodimethylamine (NDMA), N-nitrosodiethylamine (NDEA), N-nitrosopiperidine (NPIP), and N-nitroso-pyrrolidine (NPYR) (Fig. 1.5; Table 1.12). The concentrations of some of these NOCs in
representative processed meats are given in Table 1.13.
A recent study detected N-nitrosamines in dry fermented sausages; only NPIP and N-nitrosomorpholine (NMOR) were detected in a high number of samples (n = 101; 22% and 28%, respectively). When N-nitrosamines were detected, their total amount remained below 5.5 µg/kg, with only one exception at 14 µg/kg (De Mey et al., 2014).
The addition of sodium ascorbate to meat, and to a lesser extent NaCl, was shown to decrease N-nitrosamine levels (e.g. NDMA and NDEA) in processed meat. On the contrary, baking processes increased N-nitrosamine levels (Rywotycki, 2007). [The Working Group noted that since the levels of nitrate and nitrite allowed in cured products are being lowered in many countries, a decrease in NOC formation is expected compared with previous decades.]
(ii) Polycyclic aromatic hydrocarbons Traditional commercial smoking techniques,
in which smoke from incomplete wood burning comes into direct contact with the product, can lead to significant contamination by PAHs if the process is not adequately monitored. Temperature, time, humidity, type of smoke used, and even the design of the smokehouse are crucial parameters in controlling PAH formation (EFSA, 2008; Roseiro et al., 2011). The concentra-tions of selected PAHs in different smoked meats are given in Table 1.8.
PAHs have also been found in dry fermented sausages in Portugal. The concentrations of chrysene, benzo[a]anthracene, BaP, and benzo[a]fluoranthene were 5.1–38.11, 8–32.9, 1.2–6.6, and 0.63–7.4 µg/kg dry matter, respec-tively (Roseiro et al., 2011).
The use of liquid smoke flavouring might reduce PAH levels in commercially smoked meat products (EFSA, 2008).
Fig. 1.4 Structure of N-glycolylneuraminic acid (Neu5Gc)
OOHN
OHO
OH
OHO
HO
OH
H
OH
H
IARC MONOGRAPHS – 114
50
1.3 Exposure via food intake
1.3.1 Data description
Consumption for a given food depends on two parameters: size of the portion and frequency of eating. In addition, the overall dietary pattern is based on types of foods consumed, which depends on socioeconomic factors (e.g. age, ethnicity, geographical origin, religion, level of education, and income). As a result of these difficulties, food consumption can be estimated using two different techniques: per capita studies and individual surveys, which can, respectively, underestimate or overestimate long-term dietary exposures.
Food consumption results can also be gener-ated using household budget surveys, which correspond to per capita estimates at the house-hold level. However, as the data for household budget surveys are weak, they will not be further considered in this Monograph.
In epidemiological studies, food frequency questionnaires (FFQs) are typically used for ranking subjects according to food or nutrient intake, rather than for estimating absolute levels of intake (Beaton, 1994; Kushi, 1994; Sempos et al., 1999). These questionnaires are further discussed in Section 1.4.1.
(a) Per capita consumption from economic surveys
The per capita consumption is calculated as follows: national production figures plus imports, minus exports, divided by the total number of individuals in the population. The average values are collected by the Food and Agriculture Organization of the United Nations Statistical Databases (FAOSTAT) (FAO, 2015) on a yearly basis, and may provide a superior estimate of long-term consumption. However, the per capita data underestimate the true consumption of food items, as less than 100% of the population are consumers, and the whole population is used to calculate the data. On the contrary, for food items consumed by 100% of the population, the data correctly account for both the amount consumed and the frequency of consumption. Based on the FAO per capita data, the World Health Organization (WHO) generated the Global Environment Monitoring System (GEMS) cluster diets (WHO, 2015a) using a mathematical technique to group coun-tries with similar dietary patterns (Sy et al., 2013). Consumption values were calculated for each cluster as the average consumption of the food commodity in each country of the cluster. The range of values was therefore narrower than those for FAO national per capita consumption.
Fig. 1.5 Structures of N-nitroso compounds commonly found in processed meats
H3C NN
CH3
OH3C
N
H3C
N O
N NO
NNO
NDMA NDEA NPIP NPYR
The full chemical names of these compounds are given in Table 1.12

Red meat and processed meat
51
(b) Individual food consumption data
Individual food consumption data are gener-ated from surveys based on recall or recording of daily consumption over 1–7 days. This method allows the distribution of consumption across a population and the consumption of high consumers to be estimated. The method over-estimates long-term consumption by extrapo-lating data collected over a short period of time (Tran et al., 2004; IPCS, 2009).
1.3.2 Results
(a) Total meat consumption
For total per capita meat consumption worldwide in 2011, important differences were observed between regions consuming high quantities of meat (i.e. Oceania, 318 g/day; north America, 315 g/day; south America, 215 g/day; Europe, 208 g/day; central America, 148 g/day) and regions consuming low quantities
of meat (i.e. Asia, 86 g/day; Africa, 51 g/day) (FAO, 2015).
In the European Prospective Investigation into Cancer and Nutrition (EPIC) study, surveys not representative of the national popu-lation were conducted in 10 European coun-tries. Food consumption was estimated based on one 24-hour dietary recall (Linseisen et al., 2002). This study concluded that for total meat, the lowest mean consumption in Europe was observed in Greece (47 g/day for women and 79 g/day for men), and the highest mean consump-tion was observed in Spain (124 g/day for women and 234 g/day for men) (Linseisen et al., 2002).
According to FAOSTAT, from 2003 to 2011, meat consumption increased in all regions, but most significantly in Asia (16%) and in Africa (20%). These figures were for both red and poultry meats, and for both processed and unprocessed meats (FAO, 2015).
Table 1.7 Polycyclic aromatic hydrocarbons cited in this Monograph
Common name (name used in this volume) CAS registry No.
Benz[a]anthracene 56-55-3Benzo[b]fluoranthene 205-99-2Benzo[j]fluoranthene 205-82-3Benzo[k]fluoranthene 207-08-9Benzo[c]fluorene 205-12-9Benzo[ghi]perylene 191-24-2Benzo[a]pyrene 50-32-8Chrysene 218-01-9Cyclopenta[cd]pyrene 27208-37-3Dibenz[a,h]anthracene 53-70-3Indeno[1,2,3-cd]pyrene 193-39-5Dibenzo[a,e]pyrene 192-65-4Dibenzo[a,h]pyrene 189-64-0Dibenzo[a,i]pyrene 189-55-9Dibenzo[a,l]pyrene 191-30-0Indeno[1,2,3-cd]pyrene 193-39-55-Methylchrysene 3697-24-3Note: the chemical structure of some of these PAHs is given in Fig. 1.3

IARC MONOGRAPHS – 114
52
(b) Association between consumption of red meat and consumption of other foods
Food categories are not independent in regard to consumption. In the field of nutrition, nutrient intake is estimated by combining consump-tion data with food nutrient composition data-bases. Thereafter, homogeneous subgroups of consumers with comparable nutrient intakes (dietary patterns) are identified by using clas-sical statistical clustering techniques (Pryer et al., 2001; Hu, 2002). The association between food categories can also be observed by using prin-cipal component analysis. For example, intake of processed meat was associated with intake of French fries, sweets, cakes, desserts, snacks, and alcoholic beverages (Fung et al., 2003; Dixon et al., 2004; Kesse et al., 2006).
Whereas clustering is based on nutrient intake, it is very difficult to a posteriori identify foods that contribute by a majority to a given dietary pattern. Zetlaoui et al. proposed the use of
principal component analysis for food clustering (Zetlaoui et al., 2011). Based on this approach, and its application in the FAO per capita data set (i.e. 415 food products in 179 countries), 30 consumption systems leading to 17 cluster diets have been described (Sy et al., 2013). According to this publication, the consumption of pork meat seemed to be associated with the consump-tion of barley beer, poultry meat, wheat flour, and refined sugar. The consumption of cattle meat seemed to be associated with cow milk and wheat flour (Sy et al., 2013).
(c) Red meat consumption
According to FAOSTAT in 2011, the cumu-lated mean per capita consumption of beef, mutton, goat, and pig meat was 30, 60, 130, 140, and 200 g/day, respectively, for Africa, Asia, America, Europe, and Oceania (FAO, 2015). From the WHO/GEMS clusters, the average
Table 1.8 Concentration levels (μg/kg) of selected polycyclic aromatic hydrocarbon in samples of white, red, and processed meat
PAH Cooking/ processing method
Beef Pork Chicken
Range Mean Range Mean Range Mean
Benzo[k]fluoranthene (BkF) Smoked 1.03–3.35 2.57 0.65–4.69 2.96 1.13–4.01 3.54Grilled 0.35–2.04 1.87 0.22–3.56 1.37 < 0.10–1.95 1.29Boiled < 0.10–1.81 1.09 0.36–1.45 1.01 0.12–1.54 1.19Unprocessed ND ND ND ND ND ND
Benzo[a]pyrene (BaP) Smoked < 0.10–5.43 5.34 0.50–10.02 1.28 < 0.10–5.91 2.91Grilled 0.17–2.93 2.74 0.21–5.73 1.75 0.48–3.73 1.82Boiled 0.27–1.30 0.87 0.17–1.45 0.94 < 0.10–1.66 0.99Unprocessed 1.71–2.42 0.34 ND ND ND ND
Indeno[123-cd]pyrene (IP) Smoked 1.82–27.59 5.10 8.81–31.11 5.29 1.40–7.17 1.39Grilled 1.34–8.48 0.62 1.65–8.59 4.01 1.07–3.42 0.61Boiled 0.41–1.22 0.54 0.54–1.81 0.97 0.34–1.19 0.45Unprocessed 1.32–7.86 3.16 0.27–3.06 1.73 0.21–1.08 0.45
Benzo[ghi]perylene (BghiP) Smoked < 0.30–2.55 1.42 < 0.30–3.18 1.09 0.88–3.41 2.68Grilled 0.61–1.64 1.50 0.78–2.66 1.84 < 0.30–2.56 1.34Boiled 0.36–1.19 0.82 < 0.30–1.62 0.93 < 0.30–1.87 1.12Unprocessed ND ND ND ND ND ND
Adapted from Food chemistry, Volume 156, Olatunji et al. (2014). Determination of polycyclic aromatic hydrocarbons [PAHs] in processed meat products using gas chromatography – Flame ionization detector, Pages No. 296–300, Copyright (2014), with permission from Elsevier

Red meat and processed meat
53
total red meat consumption ranged from 15 to 147 g/day (WHO, 2013).
In a systematic assessment, the Global Burden of Diseases Nutrition and Chronic Diseases Expert Group (NutriCoDE) evaluated the global consumption of key dietary items (foods and nutrients) by region, nation, age, and sex in 1990 and 2010 (Imamura et al., 2015). Consumption data were evaluated from 325 surveys (71.7% nationally representative) covering 88.7% of the global adult population. According to the analysis, the median of mean consumption
of red meat worldwide ranged from 23 g/day (2.6–28 g/day) for the first quintile to 84 g/day (71–138 g/day) for the fifth quintile (Imamura et al., 2015).
Individual food consumption surveys provide the distribution of consumption for consumers only (i.e. high percentiles of consumption as well as percentages of consumers by country) (FAO/WHO, 2015; FCID, 2015). Worldwide detailed data on red meat consumption (g/kg bw per day) are presented in Table 1.14 and Table 1.15 for adults and children, respectively.
Table 1.9 Total iron and percentage of haem iron in raw and cooked meat
Meats Total iron (mg/100 g) % Haem iron % Loss
Raw Cooked Raw Cooked
Red meatBeef Sirloin 2.07 3.59 83 74 11 Fillet 2.35 3.38 90 85 6 Roasted beef 2.04 3.74 87 84 3 Topside 1.93 2.88 87 66 24 Mean 2.09 3.39 87 78 11Veal Fillet 0.85 1.58 84 83 1Lamb Chop 2.23 3.20 75 70 7Horse Fillet 2.21 3.03 79 71 11Pork Loin 0.36 0.46 56 46 18 Chump chop 0.49 0.79 66 69 (+4) Mean 0.42 0.64 62 61 7White meatChicken Breast 0.40 0.58 30 28 7 Leg (thigh) 0.70 1.34 30 22 27 Leg (lower part) 0.63 1.20 46 35 24 Wing 0.63 0.92 44 25 43 Mean 0.59 1.01 38 28 28Turkey Breast 0.50 0.79 28 27 4 Leg (thigh) 0.99 1.46 50 39 22 Leg (lower part) 0.88 1.51 49 38 22 Mean 0.79 1.25 42 35 18Adapted from Lombardi-Boccia et al. (2002)

IARC MONOGRAPHS – 114
54
Table 1.10 Advanced glycation end product content in red meat, processed meat, and chickena
Meat Cooking/processing method Advanced glycation end product (kU/110 g)
Beef Raw 707Roast 6 071Steak, raw 800Steak, broiled 7 479Steak, grilled 4 min 7 416Steak, microwaved, 6 min 2 687Steak, pan fried w/olive oil 10 058Steak, strips, 450°F, 15 min 6 851Steak, strips, stir fried with 1 T canola oil, 15 min 9 522Steak, strips, stir fried without oil, 7 min 6 973Stewed 2 443Frankfurter, boiled in water, 212° F, 7 min 7 484Frankfurter, broiled 450°F, 5 min 11 270Ground, 20% fat, pan/cover 5 527Hamburger patty, olive oil 180°F, 6 min 2 639Meatball, potted (cooked in liquid), 1 h 4 300Meatball, w/sauce 2 852Meatloaf, crust off, 45 min 1 862
Pork Bacon, fried 5 min no added oil 91 577Bacon, microwaved, 2 slices, 3 min 9 023Ham, deli, smoked 2 349Liverwurst 633Chop, pan fried, 7 min 4 752Ribs, roasted 4 430Roast (Chinese take-out) 3 544Sausage, beef and pork links, pan fried 5 426Sausage, Italian, raw 1 861Sausage, Italian, barbecued 4 839Sausage, pork links, microwaved, 1 min 5 943
Lamb Leg, raw 826Leg, boiled, 30 min 1 218Leg, broiled, 450°F, 30 min 2 431Leg, microwave, 5 min 1 029
Veal Stewed 2 858Chicken Ground, white meat, raw 877
Meatball, potted (cooked in liquid) 1 h 1 501Potted (cooked in liquid) with onion and water 3 329Roasted 6 020Skin, back of thigh, roasted then barbecued 18 520
a Glycation end product content based on carboxymethyllysine contentAdapted from Journal of the American Dietetic Association, Volume 110, issue 6, Jaime Uribarri, Sandra Woodruff, Susan Goodman, Weijing Cai, Xue Chen, Renata Pyzik, Angie Yong, Gary E. Striker, Helen Vlassara, Advanced Glycation End Products in Foods and a Practical Guide to Their Reduction in the Diet, Pages No. 911-916.e12, Copyright (2010), with permission from Elsevier (Uribarri et al., 2010)

Red meat and processed meat
55
(i) EuropeThe European Food Safety Authority (EFSA)
collected in a harmonized way the results from national food consumption surveys of more than 20 member states of the EU. The median of mean meat consumption for adults was 35 g/day, ranging from about 10 g/day (Sweden) to 110 g/day (Austria). At the 95th percentile, meat consumption ranged from 20 g/day (Sweden, 21% of consumers) to 237 g/day (Austria, 88% of consumers). Similar results were found for adolescents, both in terms of amount consumed and percentage of the popu-lation that are consumers. For infants and toddlers, the median of mean meat consumption was about 50 g/day, ranging from 20 to 80 g/day, and the percentage of consumers ranged from about 5% (the Netherlands) to 100% (Germany). At the 95th percentile, the meat consumption ranged from 40 g/day (the Netherlands) to about 190 g/day (Belgium) (EFSA, 2011).
The EPIC study concluded that red meat consumption ranged from 24 to 57 g/day for women and from 40 to 121 g/day for men based on 24-hour recall (Linseisen et al., 2002).
(ii) AmericasFew representative national surveys were
available for the Americas. In the USA (FCID, 2015), the mean consumption of total red meat was 86 g/day for adult consumers and 242 g/day at the 95th percentile for the same population (72% consumers). For children aged between 1 and < 3 years, mean consumption was 31 g/day and 89 g/day at the 95th percentile (62% consumers). For children aged between 3 and 16 years, mean consumption was 60 g/day and 176 g/day at the 95th percentile (71% consumers) (FCID, 2015). Similarly, in Brazil, the mean consumption of beef was 92 g/day for the general population and 232 g/day at the 95th percen-tile for the same population (69% consumers). No data were available for children in Brazil, and no data were available for other countries in Latin America. However, according to the GEMS Cluster diets, the dietary patterns in this region seemed homogeneous (FAO/WHO, 2015; Table 1.14 and Table 1.15).
(iii) AfricaData were scarce and incomplete for Africa.
Fortunately, individual food consumption surveys were performed for adult women and children in Burkina Faso and Uganda. In these two countries, the percentage of consumers of red meat was less than 5% of the population. However, for these adult consumers, the mean consumption was between 23 and 90 g/day, and consumption at the 95th percentile was between 28 and 147 g/day. For children, the percentage of consumers of red meat was below 4% of this population. Similarly, compared with adults, consumption for child consumers was close to that observed in developed countries, with a mean between 13 and 62 g/day, and a high consumption
Table 1.11 Content of N-glycolylneuraminic acid in red or processed meat, raw or cooked under different conditions
Meat Neu5Gc content (µg/g)
Ground beef 25Beef steak (raw) 134Beef steak (baked) 210Beef steak (boiled) 231Beef steak (fried) 199Ground lamb 14Lamb steak (raw) 57Lamb steak (baked) 50Lamb steak (boiled) 47Lamb steak (fried) 19Ground pork 19Pork chop (raw) 25Pork chop (baked) 40Pork chop (boiled) 36Pork chop (fried) 29Pork bratwurst 11Pork bacon 7Neu5Gc, N-glycolylneuraminic acid From Samraj et al. (2015), with permission of the editor
IARC MONOGRAPHS – 114
56
at the 95th percentile of between 22 and 69 g/day. It is therefore likely that the difference in the per capita consumption (four to five times lower in Africa than in Europe) was mainly due to a lower number of consumers rather than to large differences in the dietary patterns of consumers (FAO/WHO, 2015; Table 1.14 and Table 1.15).
(iv) Middle East and north AfricaIntake of red meat in countries of the Middle
East and north Africa was estimated in 2010 to range from 200 g/week (Afghanistan) to 700 g/week (Algeria and United Arab Emirates) (Afshin et al., 2015).
(v) AsiaFood consumption surveys were available
from Bangladesh, China, Japan, the Philippines, the Republic of Korea, and Thailand. In Asia, the main types of red meat consumed were pork and beef (FAO/WHO, 2015). In China, the predominant red meat consumed was pork, with 63% of consumers, a mean consumption of 84 g/day, and consumption at the 95th percentile of 224 g/day for adult consumers only (Table 1.14). Based on three consecutive 24-hour recalls, a prospective study of 5000 adults from 4280 households in nine provinces showed an increase in average consumption of pork of 20% (52 vs 62 g/day per person) from 1989 to 2004
(Zhai et al., 2009). For Chinese children, the mean consumption of pork was 51 g/day, and consumption of pork at the 95th percentile was 142 g/day. Beef was consumed by less than 10% of the Chinese population, with a mean consump-tion of 46 g/day and consumption at the 95th percentile for consumers of 130 g/day. For children, the mean consumption of beef was 32 g/day, and consumption of beef at the 95th percentile was 85 g/day. These figures were close to those reported in the Americas and Europe (FAO/WHO, 2015; Table 1.15).
Similarly, in the Republic of Korea, the consumption of pork for adults was 76 g/day, and consumption of pork at the 95th percentile was 253 g/day (44% of consumers). For children, the mean consumption of pork was 30 g/day, and consumption of pork at the 95th percentile was 95 g/day. Finally, in the Philippines, for one third of the population, the mean consumption of pork for children was 75 g/day, and consump-tion of pork at the 95th percentile was 208 g/day (33% of consumers). On the contrary, in Japan, beef and pork were consumed by a wide range of consumers (i.e. 89% and 99% of the popu-lation, respectively). The mean consumption and consumption at the 97.5th percentile for consumers only were 53 and 83 g/day, respec-tively, i.e. about half of the consumption in north
Table 1.12 N-Nitroso compounds commonly found in processed meat
Common abbreviation Full name CAS registry No.
NMDA N-Nitrosodimethylamine 62-75-9NDEA N-Nitrosodiethylamine 55-18-5NPIP N-Nitrosopiperidine 100-75-4NPYR N-Nitrosopyrrolidine 930-55-2NDBA N-Nitrosodi-n-butylamine 924-16-3– N-Nitrosomethylethylamine 10595-95-6– N-Nitrosoproline 7519-36-0– N-Nitrosohydroxyproline 30310-80-6NMOR N-Nitrosomorpholine 59-89-2CAS, Chemical Abstracts ServiceThe chemical structure of some of these compounds is given in Fig. 1.5

Red meat and processed meat
57
America or in China. In Thailand, the percentage of pork meat consumers was 89%, with a mean consumption of 23 g/day. In Bangladesh, the percentage of red meat consumers was less than 10%. The mean consumption for consumers was between 10 and 23 g/day, and the consump-tion at the 95th percentile was between 25 and 77 g/day (FAO/WHO, 2015; Table 1.14 and Table 1.15).
(iv) OceaniaThe 2008/09 New Zealand Adult Nutrition
Survey (University of Otago and Ministry of Health, 2011) estimated the mean consumption of beef and veal to be 180 g/day, and consump-tion of beef and veal at the 90th percentile to be 397 g/day for consumers only. The same survey estimated the mean consumption of lamb and mutton to be 137 g/day, and consumption of lamb and mutton at the 90th percentile to be 275 g/day. For these two food categories, the percentage of consumers was 24% for beef and veal meat, and 7% for lamb and goat meat (Parnell et al., 2012). Data on the consumption of pork, as well as the total red meat consumption, were not available for adults. For Australia, data on consumption were only available for children. They showed
a mean consumption that for consumers only ranged from 13 to 70 g/day, and a consumption at the 97.5th percentile that ranged from 83 to 257 g/day (FAO/WHO, 2015; Table 1.15).
In summary, for most countries (e.g. Australia, central and southern Europe, China, the Philippines, the Republic of Korea, and the USA), the mean consumption of red meat for consumers only was around 50–100 g/day, and high consumption was around 200–300 g/day. The percentage of meat consumers seemed to be proportional to the income or the level of development. In other words, the distribution of meat consumption was fairly similar among consumers in these countries. Therefore, anal-ysis of per capita data only may give the wrong perception of the levels of consumption. In some countries (e.g. Japan, northern Europe, and Thailand), the consumption of red meat was low, despite a percentage of consumers of about 90%, probably due to substitution with fish and other seafoods. Finally, in less-industrialized countries for which data were available (e.g. Bangladesh, Burkina Faso, and Uganda), the percentage of consumers was below 10%, probably due to the high price of red meat. It should be noted that, in these countries, the mean and high
Table 1.13 Major sources of dietary N-nitrosamines in processed meats
Processed meat Concentration of nitrosamines (µg/kg)
NDMA NDEA NPYR NPIP
Bacon fried ND–30 ND–1 ND–200 ND–1Cured meats ND–4 ND–4 ND–25 ND–2Smoked meats ND–3 ND–7.9 ND–0.1 ND–0.1Sausages Frankfurter ND–84 – – –Mettwurst + + ND–105 ND–60Liver sausage ND–35 ND–25 ND–80 –Salami ND–80 – – –Bologna – ND–25 ND–105 –+, detected but not quantitated; –, not reported; ND, not detected; NDMA, N-nitrosodimethylamine; NDEA, N-nitrosodiethylamine; NPIP, N-nitrosopiperidine; NPYR, N-nitrosopyrrolidine From: Nitrates, nitrites and N‐nitrosocompounds: A review of the occurrence in food and diet and the toxicological implications, R. Walker, Food Additives & Contaminants, 1990, reprinted by permission of Taylor & Francis (Taylor & Francis Ltd, http://www.tandfonline.com) (Walker, 1990)

IARC MONOGRAPHS – 114
58
Tabl
e 1.
14 W
orld
wid
e co
nsum
ptio
n of
red
mea
t in
adul
ts
Age
cla
ssC
ount
rySu
rvey
Mea
t typ
eN
o. o
f su
bjec
tsN
o. o
f co
nsum
ers
Perc
enta
ge
of
cons
umer
s
Con
sum
ers,
M
ean
(g
/bw
per
da
y)
Con
sum
ers,
ST
D
(g/b
w p
er
day)
Con
sum
ers,
P9
75
(g/b
w p
er
day)
Adu
lt w
omen
Bang
lade
shH
arve
st_2
007/
8Be
ef a
nd o
ther
bov
ines
m
eat
474
398.
23%
0.4
0.3
0.9
Adu
lt w
omen
Bang
lade
shH
arve
st_2
007/
8G
oat a
nd o
ther
cap
rine
s47
49
1.90
%0.
50.
72.
0
Adu
ltsBe
lgiu
mD
iet_
Nat
iona
l_20
04Be
ef a
nd o
ther
bov
ines
m
eat
1304
449
34.4
3%0.
90.
72.
5
Adu
ltsBe
lgiu
mD
iet_
Nat
iona
l_20
04H
orse
and
oth
er e
quin
es13
0416
1.23
%1.
10.
72.
6A
dults
Belg
ium
Die
t_N
atio
nal_
2004
Mea
t fro
m m
amm
als
othe
r tha
n m
arin
e m
amm
als,
NES
1304
90.
69%
0.7
0.3
1.1
Adu
ltsBe
lgiu
mD
iet_
Nat
iona
l_20
04Po
rk a
nd o
ther
por
cine
s13
0427
320
.94%
0.9
0.5
2.3
Adu
ltsBe
lgiu
mD
iet_
Nat
iona
l_20
04Sh
eep
and
othe
r ovi
nes
1304
846.
44%
0.9
0.5
2.1
Gen
eral
po
pula
tion
Braz
ilBr
azili
an In
stitu
te
of G
eogr
aphy
and
St
atis
tics
Beef
and
oth
er b
ovin
es
mea
t34
003
23 3
2068
.58%
1.4
1.2
4.4
Gen
eral
po
pula
tion
Braz
ilBr
azili
an In
stitu
te
of G
eogr
aphy
and
St
atis
tics
Goa
t and
oth
er c
apri
nes
34 0
0319
40.
57%
1.8
1.2
4.8
Gen
eral
po
pula
tion
Braz
ilBr
azili
an In
stitu
te
of G
eogr
aphy
and
St
atis
tics
Mea
t fro
m m
amm
als
othe
r tha
n m
arin
e m
amm
als,
NES
34 0
0320
716.
09%
1.0
0.9
3.5
Gen
eral
po
pula
tion
Braz
ilBr
azili
an In
stitu
te
of G
eogr
aphy
and
St
atis
tics
Pork
and
oth
er p
orci
nes
34 0
0325
777.
58%
1.8
1.7
6.3
Gen
eral
po
pula
tion
Braz
ilBr
azili
an In
stitu
te
of G
eogr
aphy
and
St
atis
tics
Shee
p an
d ot
her o
vine
s34
003
136
0.40
%1.
51.
14.
8
Adu
lt w
omen
Burk
ina
Faso
Har
vest
_201
0Be
ef a
nd o
ther
bov
ines
m
eat
287
72.
44%
0.4
0.1
0.5
Adu
lt w
omen
Burk
ina
Faso
Har
vest
_201
0G
oat a
nd o
ther
cap
rine
s28
77
2.44
%0.
70.
51.
5
Adu
lt w
omen
Burk
ina
Faso
Har
vest
_201
0M
eat f
rom
mam
mal
s ot
her t
han
mar
ine
mam
mal
s, N
ES
287
31.
05%
1.7
0.5
2.2
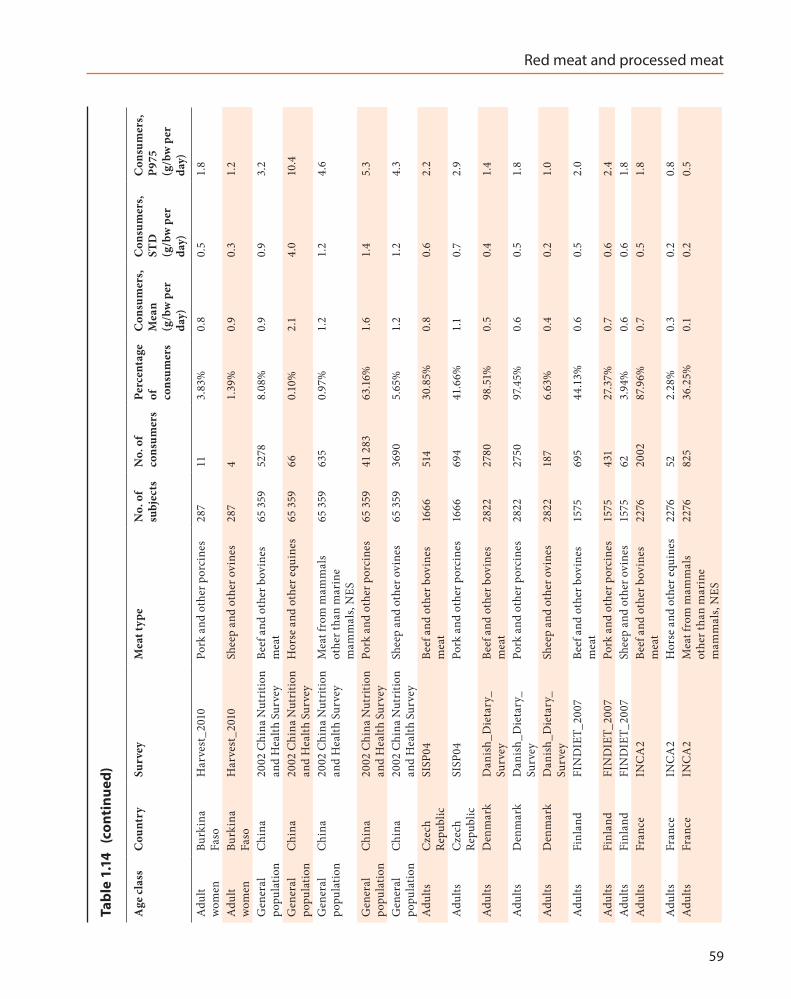
Red meat and processed meat
59
Age
cla
ssC
ount
rySu
rvey
Mea
t typ
eN
o. o
f su
bjec
tsN
o. o
f co
nsum
ers
Perc
enta
ge
of
cons
umer
s
Con
sum
ers,
M
ean
(g
/bw
per
da
y)
Con
sum
ers,
ST
D
(g/b
w p
er
day)
Con
sum
ers,
P9
75
(g/b
w p
er
day)
Adu
lt w
omen
Burk
ina
Faso
Har
vest
_201
0Po
rk a
nd o
ther
por
cine
s28
711
3.83
%0.
80.
51.
8
Adu
lt w
omen
Burk
ina
Faso
Har
vest
_201
0Sh
eep
and
othe
r ovi
nes
287
41.
39%
0.9
0.3
1.2
Gen
eral
po
pula
tion
Chi
na20
02 C
hina
Nut
ritio
n an
d H
ealth
Sur
vey
Beef
and
oth
er b
ovin
es
mea
t65
359
5278
8.08
%0.
90.
93.
2
Gen
eral
po
pula
tion
Chi
na20
02 C
hina
Nut
ritio
n an
d H
ealth
Sur
vey
Hor
se a
nd o
ther
equ
ines
65 3
5966
0.10
%2.
14.
010
.4
Gen
eral
po
pula
tion
Chi
na20
02 C
hina
Nut
ritio
n an
d H
ealth
Sur
vey
Mea
t fro
m m
amm
als
othe
r tha
n m
arin
e m
amm
als,
NES
65 3
5963
50.
97%
1.2
1.2
4.6
Gen
eral
po
pula
tion
Chi
na20
02 C
hina
Nut
ritio
n an
d H
ealth
Sur
vey
Pork
and
oth
er p
orci
nes
65 3
5941
283
63.16
%1.
61.
45.
3
Gen
eral
po
pula
tion
Chi
na20
02 C
hina
Nut
ritio
n an
d H
ealth
Sur
vey
Shee
p an
d ot
her o
vine
s65
359
3690
5.65
%1.
21.
24.
3
Adu
ltsC
zech
Re
publ
icSI
SP04
Beef
and
oth
er b
ovin
es
mea
t16
6651
430
.85%
0.8
0.6
2.2
Adu
ltsC
zech
Re
publ
icSI
SP04
Pork
and
oth
er p
orci
nes
1666
694
41.6
6%1.
10.
72.
9
Adu
ltsD
enm
ark
Dan
ish_
Die
tary
_Su
rvey
Beef
and
oth
er b
ovin
es
mea
t28
2227
8098
.51%
0.5
0.4
1.4
Adu
ltsD
enm
ark
Dan
ish_
Die
tary
_Su
rvey
Pork
and
oth
er p
orci
nes
2822
2750
97.4
5%0.
60.
51.
8
Adu
ltsD
enm
ark
Dan
ish_
Die
tary
_Su
rvey
Shee
p an
d ot
her o
vine
s28
2218
76.
63%
0.4
0.2
1.0
Adu
ltsFi
nlan
dFI
ND
IET_
2007
Beef
and
oth
er b
ovin
es
mea
t15
7569
544
.13%
0.6
0.5
2.0
Adu
ltsFi
nlan
dFI
ND
IET_
2007
Pork
and
oth
er p
orci
nes
1575
431
27.3
7%0.
70.
62.
4A
dults
Finl
and
FIN
DIE
T_20
07Sh
eep
and
othe
r ovi
nes
1575
623.
94%
0.6
0.6
1.8
Adu
ltsFr
ance
INC
A2
Beef
and
oth
er b
ovin
es
mea
t22
7620
0287
.96%
0.7
0.5
1.8
Adu
ltsFr
ance
INC
A2
Hor
se a
nd o
ther
equ
ines
2276
522.
28%
0.3
0.2
0.8
Adu
ltsFr
ance
INC
A2
Mea
t fro
m m
amm
als
othe
r tha
n m
arin
e m
amm
als,
NES
2276
825
36.2
5%0.
10.
20.
5
Tabl
e 1.
14 (
cont
inue
d)

IARC MONOGRAPHS – 114
60
Age
cla
ssC
ount
rySu
rvey
Mea
t typ
eN
o. o
f su
bjec
tsN
o. o
f co
nsum
ers
Perc
enta
ge
of
cons
umer
s
Con
sum
ers,
M
ean
(g
/bw
per
da
y)
Con
sum
ers,
ST
D
(g/b
w p
er
day)
Con
sum
ers,
P9
75
(g/b
w p
er
day)
Adu
ltsFr
ance
INC
A2
Pork
and
oth
er p
orci
nes
2276
1154
50.7
0%0.
30.
31.
1A
dults
Fran
ceIN
CA
2Sh
eep
and
othe
r ovi
nes
2276
627
27.5
5%0.
20.
20.
7A
dults
Hun
gary
Nat
iona
l_Re
pr_S
urv
Beef
and
oth
er b
ovin
es
mea
t10
7438
235
.57%
0.3
0.3
1.1
Adu
ltsH
unga
ryN
atio
nal_
Repr
_Sur
vPo
rk a
nd o
ther
por
cine
s10
7486
080
.07%
0.9
0.6
2.6
Adu
ltsH
unga
ryN
atio
nal_
Repr
_Sur
vSh
eep
and
othe
r ovi
nes
1074
80.
74%
0.5
0.2
0.8
Adu
ltsIr
elan
dN
SIFC
SBe
ef a
nd o
ther
bov
ines
m
eat
958
761
79.4
4%0.
70.
62.
0
Adu
ltsIr
elan
dN
SIFC
SPo
rk a
nd o
ther
por
cine
s95
842
744
.57%
0.5
0.4
1.5
Adu
ltsIr
elan
dN
SIFC
SSh
eep
and
othe
r ovi
nes
958
361
37.6
8%0.
40.
31.
4A
dults
Ital
yIN
RA
N_
SCA
I_20
05_0
6Be
ef a
nd o
ther
bov
ines
m
eat
2313
1698
73.4
1%0.
80.
62.
3
Adu
ltsIt
aly
INR
AN
_SC
AI_
2005
_06
Goa
t and
oth
er c
apri
nes
2313
30.
13%
0.6
0.2
0.8
Adu
ltsIt
aly
INR
AN
_SC
AI_
2005
_06
Hor
se a
nd o
ther
equ
ines
2313
572.
46%
0.7
0.4
1.5
Adu
ltsIt
aly
INR
AN
_SC
AI_
2005
_06
Pork
and
oth
er p
orci
nes
2313
735
31.7
8%0.
60.
51.
8
Adu
ltsIt
aly
INR
AN
_SC
AI_
2005
_06
Shee
p an
d ot
her o
vine
s23
1371
3.07
%0.
60.
81.
4
Gen
eral
po
pula
tion
Japa
nD
SFFQ
_FI
Beef
and
oth
er b
ovin
es
mea
t27
1124
0688
.75%
0.3
0.3
1.0
Gen
eral
po
pula
tion
Japa
nD
SFFQ
_FI
Mea
t fro
m m
amm
als
othe
r tha
n m
arin
e m
amm
als,
NES
2711
112
4.13
%0.
20.
10.
7
Gen
eral
po
pula
tion
Japa
nD
SFFQ
_FI
Pork
and
oth
er p
orci
nes
2711
2691
99.2
6%0.
60.
41.
5
Adu
ltsLa
tvia
EFSA
_TES
TBe
ef a
nd o
ther
bov
ines
m
eat
1306
665.
05%
0.8
0.6
2.7
Adu
ltsLa
tvia
EFSA
_TES
TG
oat a
nd o
ther
cap
rine
s13
061
0.08
%0.
70.
7A
dults
Latv
iaEF
SA_T
EST
Mea
t fro
m m
amm
als
othe
r tha
n m
arin
e m
amm
als,
NES
1306
201.
53%
0.7
0.4
1.7
Adu
ltsLa
tvia
EFSA
_TES
TPo
rk a
nd o
ther
por
cine
s13
0679
660
.95%
1.2
0.9
3.5
Tabl
e 1.
14 (
cont
inue
d)

Red meat and processed meat
61
Age
cla
ssC
ount
rySu
rvey
Mea
t typ
eN
o. o
f su
bjec
tsN
o. o
f co
nsum
ers
Perc
enta
ge
of
cons
umer
s
Con
sum
ers,
M
ean
(g
/bw
per
da
y)
Con
sum
ers,
ST
D
(g/b
w p
er
day)
Con
sum
ers,
P9
75
(g/b
w p
er
day)
Adu
ltsLa
tvia
EFSA
_TES
TSh
eep
and
othe
r ovi
nes
1306
50.
38%
0.8
0.3
1.3
Adu
ltsN
ethe
rland
sD
NFC
S_20
03Be
ef a
nd o
ther
bov
ines
m
eat
750
180
24.0
0%1.
00.
62.
5
Adu
ltsN
ethe
rland
sD
NFC
S_20
03H
orse
and
oth
er e
quin
es75
02
0.27
%0.
20.
10.
3A
dults
Net
herla
nds
DN
FCS_
2003
Pork
and
oth
er p
orci
nes
750
309
41.2
0%1.
20.
93.
8A
dults
Net
herla
nds
DN
FCS_
2003
Shee
p an
d ot
her o
vine
s75
030
4.00
%1.
20.
94.
1G
ener
al
popu
latio
nRe
publ
ic o
f K
orea
KN
HN
ESBe
ef a
nd o
ther
bov
ines
m
eat
9391
3141
33.4
5%0.
91.
24.
1
Gen
eral
po
pula
tion
Repu
blic
of
Kor
eaK
NH
NES
Pork
and
oth
er p
orci
nes
9391
4124
43.9
1%1.
41.
86.
3
Adu
ltsSp
ain
AES
AN
_FIA
BBe
ef a
nd o
ther
bov
ines
m
eat
981
680
69.3
2%1.
10.
72.
8
Adu
ltsSp
ain
AES
AN
Beef
and
oth
er b
ovin
es
mea
t41
017
642
.93%
1.2
0.8
3.2
Adu
ltsSp
ain
AES
AN
_FIA
BG
oat a
nd o
ther
cap
rine
s98
13
0.31
%1.
10.
21.
3A
dults
Spai
nA
ESA
N_F
IAB
Pork
and
oth
er p
orci
nes
981
366
37.3
1%1.
00.
73.
0A
dults
Spai
nA
ESA
NPo
rk a
nd o
ther
por
cine
s41
012
931
.46%
1.0
0.6
2.4
Adu
ltsSp
ain
AES
AN
_FIA
BSh
eep
and
othe
r ovi
nes
981
102
10.4
0%1.
00.
52.
3A
dults
Spai
nA
ESA
NSh
eep
and
othe
r ovi
nes
410
184.
39%
1.1
0.9
3.8
Adu
ltsSw
eden
Rik
smat
en_1
997_
98Be
ef a
nd o
ther
bov
ines
m
eat
1210
590
48.7
6%0.
30.
20.
9
Adu
ltsSw
eden
Rik
smat
en_1
997_
98H
orse
and
oth
er e
quin
es12
108
0.66
%0.
10.
10.
5A
dults
Swed
enR
iksm
aten
_199
7_98
Pork
and
oth
er p
orci
nes
1210
699
57.7
7%0.
40.
21.
0A
dults
Swed
enR
iksm
aten
_199
7_98
Shee
p an
d ot
her o
vine
s12
1032
2.64
%0.
20.
21.
0G
ener
al
popu
latio
nTh
aila
ndFC
DT
Beef
and
oth
er b
ovin
es
mea
t16
383
7880
48.1
0%0.
1
Gen
eral
po
pula
tion
Thai
land
FCD
TPo
rk a
nd o
ther
por
cine
s16
383
14 6
4689
.40%
0.4
Adu
lt w
omen
Uga
nda
Har
vest
_200
7Be
ef a
nd o
ther
bov
ines
m
eat
176
84.
55%
1.2
0.8
2.8
Adu
lt w
omen
Uga
nda
Har
vest
_200
7G
oat a
nd o
ther
cap
rine
s17
62
1.14
%1.
20.
71.
7
Adu
ltsU
nite
d K
ingd
omN
DN
SBe
ef a
nd o
ther
bov
ines
m
eat
1724
1349
78.2
5%0.
40.
31.
1
Tabl
e 1.
14 (
cont
inue
d)
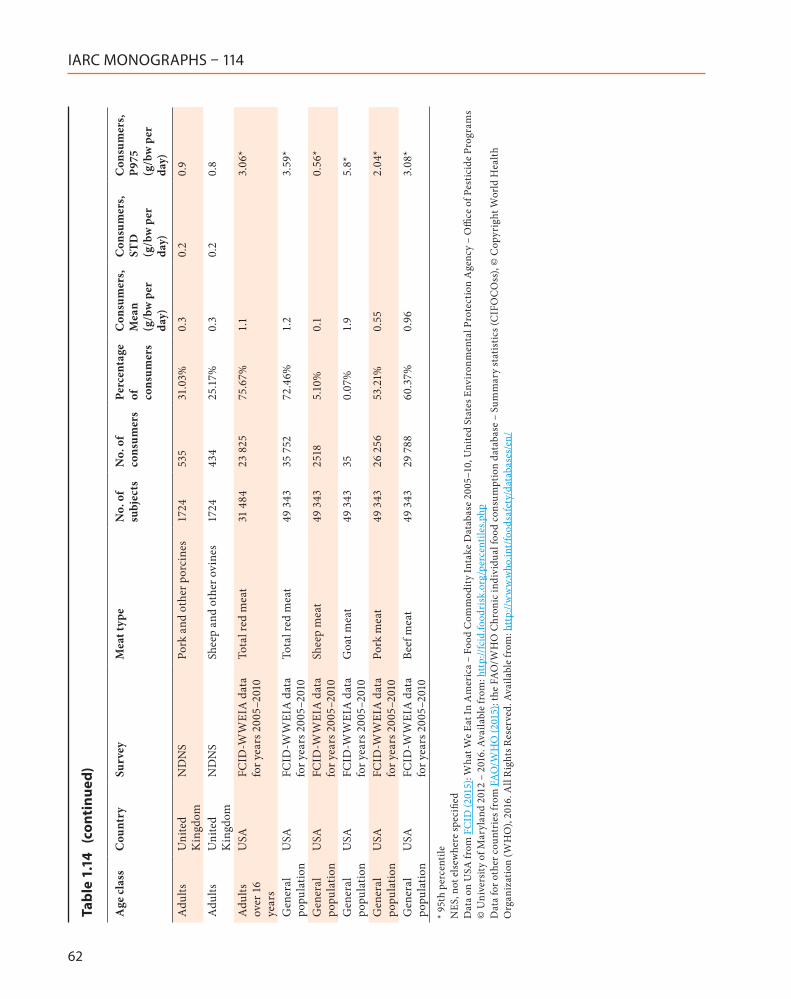
IARC MONOGRAPHS – 114
62
Age
cla
ssC
ount
rySu
rvey
Mea
t typ
eN
o. o
f su
bjec
tsN
o. o
f co
nsum
ers
Perc
enta
ge
of
cons
umer
s
Con
sum
ers,
M
ean
(g
/bw
per
da
y)
Con
sum
ers,
ST
D
(g/b
w p
er
day)
Con
sum
ers,
P9
75
(g/b
w p
er
day)
Adu
ltsU
nite
d K
ingd
omN
DN
SPo
rk a
nd o
ther
por
cine
s17
2453
531
.03%
0.3
0.2
0.9
Adu
ltsU
nite
d K
ingd
omN
DN
SSh
eep
and
othe
r ovi
nes
1724
434
25.1
7%0.
30.
20.
8
Adu
lts
over
16
year
s
USA
FCID
-WW
EIA
dat
a fo
r yea
rs 2
005–
2010
Tota
l red
mea
t31
484
23 8
2575
.67%
1.1
3.06
*
Gen
eral
po
pula
tion
USA
FCID
-WW
EIA
dat
a fo
r yea
rs 2
005–
2010
Tota
l red
mea
t49
343
35 7
5272
.46%
1.2
3.59
*
Gen
eral
po
pula
tion
USA
FCID
-WW
EIA
dat
a fo
r yea
rs 2
005–
2010
Shee
p m
eat
49 3
4325
185.
10%
0.1
0.56
*
Gen
eral
po
pula
tion
USA
FCID
-WW
EIA
dat
a fo
r yea
rs 2
005–
2010
Goa
t mea
t49
343
350.
07%
1.9
5.8*
Gen
eral
po
pula
tion
USA
FCID
-WW
EIA
dat
a fo
r yea
rs 2
005–
2010
Pork
mea
t49
343
26 2
5653
.21%
0.55
2.04
*
Gen
eral
po
pula
tion
USA
FCID
-WW
EIA
dat
a fo
r yea
rs 2
005–
2010
Beef
mea
t49
343
29 7
8860
.37%
0.96
3.08
*
* 95t
h pe
rcen
tile
NES
, not
els
ewhe
re sp
ecifi
edD
ata
on U
SA fr
om F
CID
(201
5): W
hat W
e Ea
t In
Am
eric
a –
Food
Com
mod
ity In
take
Dat
abas
e 20
05–1
0, U
nite
d St
ates
Env
iron
men
tal P
rote
ctio
n A
genc
y –
Offi
ce o
f Pes
ticid
e Pr
ogra
ms
© U
nive
rsity
of M
aryl
and
2012
– 2
016.
Ava
ilabl
e fr
om: h
ttp:
//fci
d.fo
odri
sk.o
rg/p
erce
ntile
s.php
Dat
a fo
r oth
er c
ount
ries
from
FA
O/W
HO
(201
5): t
he F
AO
/WH
O C
hron
ic in
divi
dual
food
con
sum
ptio
n da
taba
se –
Sum
mar
y st
atis
tics (
CIF
OC
Oss
), ©
Cop
yrig
ht W
orld
Hea
lth
Org
aniz
atio
n (W
HO
), 20
16. A
ll R
ight
s Res
erve
d. A
vaila
ble
from
: htt
p://w
ww
.who
.int/
food
safe
ty/d
atab
ases
/en/
Tabl
e 1.
14 (
cont
inue
d)
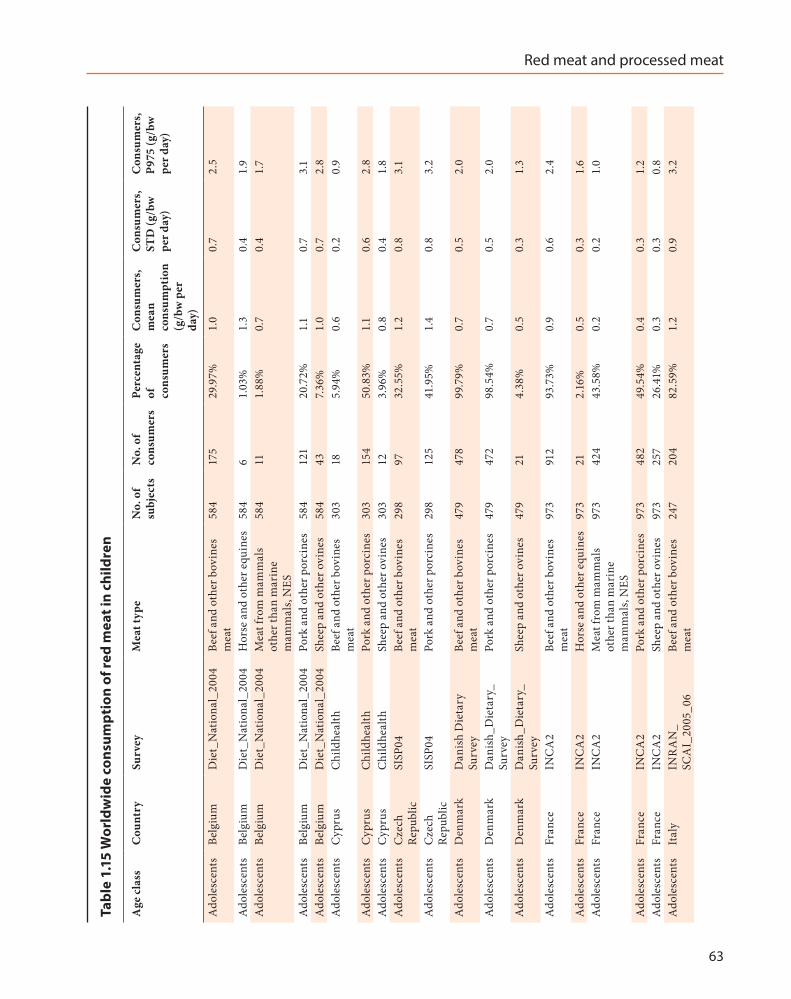
Red meat and processed meat
63
Tabl
e 1.
15 W
orld
wid
e co
nsum
ptio
n of
red
mea
t in
child
ren
Age
cla
ssC
ount
rySu
rvey
Mea
t typ
eN
o. o
f su
bjec
tsN
o. o
f co
nsum
ers
Perc
enta
ge
of
cons
umer
s
Con
sum
ers,
m
ean
cons
umpt
ion
(g/b
w p
er
day)
Con
sum
ers,
ST
D (g
/bw
pe
r day
)
Con
sum
ers,
P9
75 (g
/bw
pe
r day
)
Ado
lesc
ents
Belg
ium
Die
t_N
atio
nal_
2004
Beef
and
oth
er b
ovin
es
mea
t58
417
529
.97%
1.0
0.7
2.5
Ado
lesc
ents
Belg
ium
Die
t_N
atio
nal_
2004
Hor
se a
nd o
ther
equ
ines
584
61.
03%
1.3
0.4
1.9
Ado
lesc
ents
Belg
ium
Die
t_N
atio
nal_
2004
Mea
t fro
m m
amm
als
othe
r tha
n m
arin
e m
amm
als,
NES
584
111.
88%
0.7
0.4
1.7
Ado
lesc
ents
Belg
ium
Die
t_N
atio
nal_
2004
Pork
and
oth
er p
orci
nes
584
121
20.7
2%1.
10.
73.
1A
dole
scen
tsBe
lgiu
mD
iet_
Nat
iona
l_20
04Sh
eep
and
othe
r ovi
nes
584
437.
36%
1.0
0.7
2.8
Ado
lesc
ents
Cyp
rus
Chi
ldhe
alth
Beef
and
oth
er b
ovin
es
mea
t30
318
5.94
%0.
60.
20.
9
Ado
lesc
ents
Cyp
rus
Chi
ldhe
alth
Pork
and
oth
er p
orci
nes
303
154
50.8
3%1.
10.
62.
8A
dole
scen
tsC
ypru
sC
hild
heal
thSh
eep
and
othe
r ovi
nes
303
123.
96%
0.8
0.4
1.8
Ado
lesc
ents
Cze
ch
Repu
blic
SISP
04Be
ef a
nd o
ther
bov
ines
m
eat
298
9732
.55%
1.2
0.8
3.1
Ado
lesc
ents
Cze
ch
Repu
blic
SISP
04Po
rk a
nd o
ther
por
cine
s29
812
541
.95%
1.4
0.8
3.2
Ado
lesc
ents
Den
mar
kD
anis
h D
ieta
ry
Surv
eyBe
ef a
nd o
ther
bov
ines
m
eat
479
478
99.7
9%0.
70.
52.
0
Ado
lesc
ents
Den
mar
kD
anis
h_D
ieta
ry_
Surv
eyPo
rk a
nd o
ther
por
cine
s47
947
298
.54%
0.7
0.5
2.0
Ado
lesc
ents
Den
mar
kD
anis
h_D
ieta
ry_
Surv
eySh
eep
and
othe
r ovi
nes
479
214.
38%
0.5
0.3
1.3
Ado
lesc
ents
Fran
ceIN
CA
2Be
ef a
nd o
ther
bov
ines
m
eat
973
912
93.7
3%0.
90.
62.
4
Ado
lesc
ents
Fran
ceIN
CA
2H
orse
and
oth
er e
quin
es97
321
2.16
%0.
50.
31.
6A
dole
scen
tsFr
ance
INC
A2
Mea
t fro
m m
amm
als
othe
r tha
n m
arin
e m
amm
als,
NES
973
424
43.5
8%0.
20.
21.
0
Ado
lesc
ents
Fran
ceIN
CA
2Po
rk a
nd o
ther
por
cine
s97
348
249
.54%
0.4
0.3
1.2
Ado
lesc
ents
Fran
ceIN
CA
2Sh
eep
and
othe
r ovi
nes
973
257
26.4
1%0.
30.
30.
8A
dole
scen
tsIt
aly
INR
AN
_SC
AI_
2005
_06
Beef
and
oth
er b
ovin
es
mea
t24
720
482
.59%
1.2
0.9
3.2

IARC MONOGRAPHS – 114
64
Age
cla
ssC
ount
rySu
rvey
Mea
t typ
eN
o. o
f su
bjec
tsN
o. o
f co
nsum
ers
Perc
enta
ge
of
cons
umer
s
Con
sum
ers,
m
ean
cons
umpt
ion
(g/b
w p
er
day)
Con
sum
ers,
ST
D (g
/bw
pe
r day
)
Con
sum
ers,
P9
75 (g
/bw
pe
r day
)
Ado
lesc
ents
Ital
yIN
RA
N_
SCA
I_20
05_0
6H
orse
and
oth
er e
quin
es24
78
3.24
%0.
80.
31.
4
Ado
lesc
ents
Ital
yIN
RA
N_
SCA
I_20
05_0
6Po
rk a
nd o
ther
por
cine
s24
781
32.7
9%0.
80.
72.
5
Ado
lesc
ents
Ital
yIN
RA
N_
SCA
I_20
05_0
6Sh
eep
and
othe
r ovi
nes
247
20.
81%
0.7
0.2
0.9
Ado
lesc
ents
Latv
iaEF
SA_T
EST
Beef
and
oth
er b
ovin
es
mea
t47
016
3.40
%0.
90.
62.
3
Ado
lesc
ents
Latv
iaEF
SA_T
EST
Mea
t fro
m m
amm
als
othe
r tha
n m
arin
e m
amm
als,
NES
470
40.
85%
0.5
0.1
0.5
Ado
lesc
ents
Latv
iaEF
SA_T
EST
Pork
and
oth
er p
orci
nes
470
263
55.9
6%1.
41.
14.
1A
dole
scen
tsSp
ain
AES
AN
_FIA
BBe
ef a
nd o
ther
bov
ines
m
eat
8662
72.0
9%1.
41.
04.
5
Ado
lesc
ents
Spai
nN
UT_
INK
05Be
ef a
nd o
ther
bov
ines
m
eat
651
294
45.16
%1.
71.
14.
8
Ado
lesc
ents
Spai
nN
UT_
INK
05G
oat a
nd o
ther
cap
rine
s65
12
0.31
%1.
30.
51.
6A
dole
scen
tsSp
ain
enK
idH
orse
and
oth
er e
quin
es20
92
0.96
%1.
00.
21.
2A
dole
scen
tsSp
ain
NU
T_IN
K05
Hor
se a
nd o
ther
equ
ines
651
10.
15%
1.3
1.
3A
dole
scen
tsSp
ain
enK
idM
eat f
rom
mam
mal
s ot
her t
han
mar
ine
mam
mal
s, N
ES
209
6933
.01%
1.5
0.9
3.9
Ado
lesc
ents
Spai
nA
ESA
N_F
IAB
Pork
and
oth
er p
orci
nes
8642
48.8
4%1.
00.
62.
0A
dole
scen
tsSp
ain
enK
idPo
rk a
nd o
ther
por
cine
s20
960
28.7
1%1.
20.
83.
3A
dole
scen
tsSp
ain
NU
T_IN
K05
Pork
and
oth
er p
orci
nes
651
212
32.5
7%1.
10.
73.
3A
dole
scen
tsSp
ain
AES
AN
_FIA
BSh
eep
and
othe
r ovi
nes
864
4.65
%1.
30.
62.
0A
dole
scen
tsSp
ain
enK
idSh
eep
and
othe
r ovi
nes
209
115.
26%
1.9
2.3
8.5
Ado
lesc
ents
Spai
nN
UT_
INK
05Sh
eep
and
othe
r ovi
nes
651
294.
45%
1.3
0.7
3.8
Ado
lesc
ents
Swed
enN
FABe
ef a
nd o
ther
bov
ines
m
eat
1018
542
53.2
4%0.
50.
41.
7
Ado
lesc
ents
Swed
enN
FAH
orse
and
oth
er e
quin
es10
189
0.88
%0.
30.
30.
9A
dole
scen
tsSw
eden
NFA
Pork
and
oth
er p
orci
nes
1018
286
28.0
9%0.
80.
52.
0A
dole
scen
tsSw
eden
NFA
Shee
p an
d ot
her o
vine
s10
186
0.59
%0.
80.
82.
4
Tabl
e 1.
15 (
cont
inue
d)

Red meat and processed meat
65
Age
cla
ssC
ount
rySu
rvey
Mea
t typ
eN
o. o
f su
bjec
tsN
o. o
f co
nsum
ers
Perc
enta
ge
of
cons
umer
s
Con
sum
ers,
m
ean
cons
umpt
ion
(g/b
w p
er
day)
Con
sum
ers,
ST
D (g
/bw
pe
r day
)
Con
sum
ers,
P9
75 (g
/bw
pe
r day
)
Chi
ldre
nBa
ngla
desh
Har
vest
_200
7/8
Beef
and
oth
er b
ovin
es
mea
t55
541
7.39
%1.
00.
83.
0
Chi
ldre
nBa
ngla
desh
Har
vest
_200
7/8
Goa
t and
oth
er c
apri
nes
555
122.
16%
0.9
0.7
2.1
Chi
ldre
nBu
rkin
a Fa
soH
arve
st_2
010
Beef
and
oth
er b
ovin
es
mea
t28
87
2.43
%0.
90.
61.
5
Chi
ldre
nBu
rkin
a Fa
soH
arve
st_2
010
Goa
t and
oth
er c
apri
nes
288
62.
08%
1.8
1.0
3.3
Chi
ldre
nBu
rkin
a Fa
soH
arve
st_2
010
Mea
t fro
m m
amm
als
othe
r tha
n m
arin
e m
amm
als,
NES
288
31.
04%
4.8
3.6
8.0
Chi
ldre
nBu
rkin
a Fa
soH
arve
st_2
010
Pork
and
oth
er p
orci
nes
288
103.
47%
2.2
1.6
5.7
Chi
ldre
nBu
rkin
a Fa
soH
arve
st_2
010
Shee
p an
d ot
her o
vine
s28
83
1.04
%1.
90.
92.
8
Chi
ldre
nC
hina
2002
Chi
na N
utri
tion
and
Hea
lth S
urve
yBe
ef a
nd o
ther
bov
ines
m
eat
2784
171
6.14
%2.
01.
76.
7
Chi
ldre
nC
hina
2002
Chi
na N
utri
tion
and
Hea
lth S
urve
yH
orse
and
oth
er e
quin
es27
847
0.25
%7.
610
.430
.9
Chi
ldre
nC
hina
2002
Chi
na N
utri
tion
and
Hea
lth S
urve
yM
eat f
rom
mam
mal
s ot
her t
han
mar
ine
mam
mal
s, N
ES
2784
270.
97%
2.6
2.6
10.6
Chi
ldre
nC
hina
2002
Chi
na N
utri
tion
and
Hea
lth S
urve
yPo
rk a
nd o
ther
por
cine
s27
8417
0361
.17%
3.3
2.7
10.5
Chi
ldre
nC
hina
2002
Chi
na N
utri
tion
and
Hea
lth S
urve
ySh
eep
and
othe
r ovi
nes
2784
119
4.27
%2.
82.
910
.3
Chi
ldre
nJa
pan
DSF
FQ _
FIBe
ef a
nd o
ther
bov
ines
m
eat
7166
92.9
6%0.
50.
41.
3
Chi
ldre
nJa
pan
DSF
FQ _
FIM
eat f
rom
mam
mal
s ot
her t
han
mar
ine
mam
mal
s, N
ES
711
1.41
%0.
1
Chi
ldre
nJa
pan
DSF
FQ _
FIPo
rk a
nd o
ther
por
cine
s71
7110
0.00
%1.
30.
83.
7C
hild
ren
Phili
ppin
esH
arve
st_2
003
Beef
and
oth
er b
ovin
es
mea
t12
0561
5.06
%1.
30.
82.
8
Tabl
e 1.
15 (
cont
inue
d)

IARC MONOGRAPHS – 114
66
Age
cla
ssC
ount
rySu
rvey
Mea
t typ
eN
o. o
f su
bjec
tsN
o. o
f co
nsum
ers
Perc
enta
ge
of
cons
umer
s
Con
sum
ers,
m
ean
cons
umpt
ion
(g/b
w p
er
day)
Con
sum
ers,
ST
D (g
/bw
pe
r day
)
Con
sum
ers,
P9
75 (g
/bw
pe
r day
)
Chi
ldre
nPh
ilipp
ines
Har
vest
_200
3M
eat f
rom
mam
mal
s ot
her t
han
mar
ine
mam
mal
s, N
ES
1205
221.
83%
1.4
0.9
3.1
Chi
ldre
nPh
ilipp
ines
Har
vest
_200
3Po
rk a
nd o
ther
por
cine
s12
0539
532
.78%
1.4
1.5
5.2
Chi
ldre
nRe
publ
ic o
f K
orea
KN
HN
ESBe
ef a
nd o
ther
bov
ines
m
eat
654
255
38.9
9%1.
11.
34.
9
Chi
ldre
nRe
publ
ic o
f K
orea
KN
HN
ESPo
rk a
nd o
ther
por
cine
s65
432
950
.31%
1.9
2.0
6.5
Chi
ldre
n (2
-16
yrs)
Aus
tral
ia20
07 A
NC
NPA
SBe
ef a
nd o
ther
bov
ines
m
eat
4487
3898
86.8
7%1.
81.
96.
8
Chi
ldre
n (2
-16
yrs)
Aus
tral
ia20
07 A
NC
NPA
SPo
rk a
nd o
ther
por
cine
s44
8735
9480
.10%
0.9
1.2
4.1
Chi
ldre
n (2
-16
yrs)
Aus
tral
ia20
07 A
NC
NPA
SSh
eep
and
othe
r ovi
nes
4487
2479
55.2
5%0.
61.
14.
0
Chi
ldre
n (2
-6 y
rs)
Aus
tral
ia20
07 A
NC
NPA
SBe
ef a
nd o
ther
bov
ines
m
eat
1463
1226
83.8
0%2.
32.
18.
4
Chi
ldre
n (2
-6 y
rs)
Aus
tral
ia20
07 A
NC
NPA
SPo
rk a
nd o
ther
por
cine
s14
6311
1476
.14%
1.3
1.4
5.1
Chi
ldre
n (2
-6 y
rs)
Aus
tral
ia20
07 A
NC
NPA
SSh
eep
and
othe
r ovi
nes
1463
741
50.6
5%0.
71.
24.
4
Infa
nts
Bulg
aria
NU
TRIC
HIL
DBe
ef a
nd o
ther
bov
ines
m
eat
860
8910
.35%
2.7
1.6
7.8
Infa
nts
Bulg
aria
NU
TRIC
HIL
DPo
rk a
nd o
ther
por
cine
s86
09
1.05
%2.
32.
27.
3In
fant
sBu
lgar
iaN
UTR
ICH
ILD
Shee
p an
d ot
her o
vine
s86
02
0.23
%2.
41.
03.
1In
fant
sIt
aly
INR
AN
_SC
AI_
2005
_06
Beef
and
oth
er b
ovin
es
mea
t16
16.
25%
3.8
3.
8
Infa
nts
Ital
yIN
RA
N_
SCA
I_20
05_0
6Po
rk a
nd o
ther
por
cine
s16
16.
25%
1.0
1.
0
Infa
nts
Ital
yIN
RA
N_
SCA
I_20
05_0
6Sh
eep
and
othe
r ovi
nes
161
6.25
%1.
3
1.3
Oth
er
child
ren
Belg
ium
Regi
onal
_Fla
nder
sM
eat f
rom
mam
mal
s ot
her t
han
mar
ine
mam
mal
s, ne
s
625
162.
56%
1.2
0.8
3.3
Tabl
e 1.
15 (
cont
inue
d)
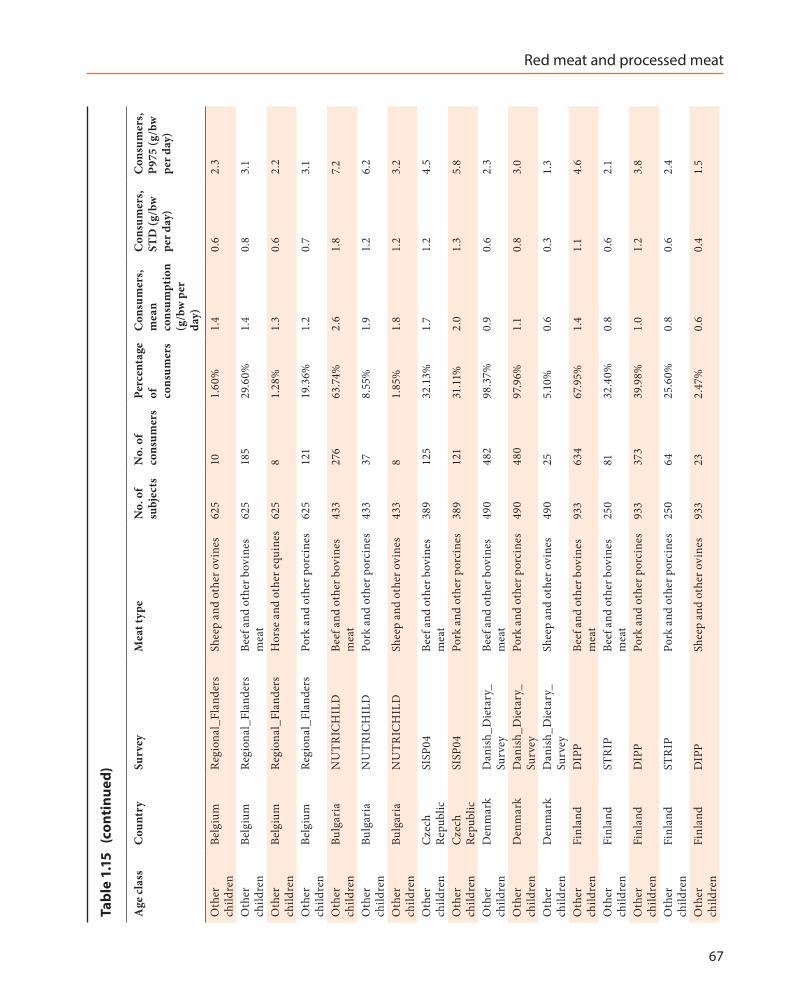
Red meat and processed meat
67
Age
cla
ssC
ount
rySu
rvey
Mea
t typ
eN
o. o
f su
bjec
tsN
o. o
f co
nsum
ers
Perc
enta
ge
of
cons
umer
s
Con
sum
ers,
m
ean
cons
umpt
ion
(g/b
w p
er
day)
Con
sum
ers,
ST
D (g
/bw
pe
r day
)
Con
sum
ers,
P9
75 (g
/bw
pe
r day
)
Oth
er
child
ren
Belg
ium
Regi
onal
_Fla
nder
sSh
eep
and
othe
r ovi
nes
625
101.
60%
1.4
0.6
2.3
Oth
er
child
ren
Belg
ium
Regi
onal
_Fla
nder
sBe
ef a
nd o
ther
bov
ines
m
eat
625
185
29.6
0%1.
40.
83.
1
Oth
er
child
ren
Belg
ium
Regi
onal
_Fla
nder
sH
orse
and
oth
er e
quin
es62
58
1.28
%1.
30.
62.
2
Oth
er
child
ren
Belg
ium
Regi
onal
_Fla
nder
sPo
rk a
nd o
ther
por
cine
s62
512
119
.36%
1.2
0.7
3.1
Oth
er
child
ren
Bulg
aria
NU
TRIC
HIL
DBe
ef a
nd o
ther
bov
ines
m
eat
433
276
63.7
4%2.
61.
87.
2
Oth
er
child
ren
Bulg
aria
NU
TRIC
HIL
DPo
rk a
nd o
ther
por
cine
s43
337
8.55
%1.
91.
26.
2
Oth
er
child
ren
Bulg
aria
NU
TRIC
HIL
DSh
eep
and
othe
r ovi
nes
433
81.
85%
1.8
1.2
3.2
Oth
er
child
ren
Cze
ch
Repu
blic
SISP
04Be
ef a
nd o
ther
bov
ines
m
eat
389
125
32.1
3%1.
71.
24.
5
Oth
er
child
ren
Cze
ch
Repu
blic
SISP
04Po
rk a
nd o
ther
por
cine
s38
912
131
.11%
2.0
1.3
5.8
Oth
er
child
ren
Den
mar
kD
anis
h_D
ieta
ry_
Surv
eyBe
ef a
nd o
ther
bov
ines
m
eat
490
482
98.3
7%0.
90.
62.
3
Oth
er
child
ren
Den
mar
kD
anis
h_D
ieta
ry_
Surv
eyPo
rk a
nd o
ther
por
cine
s49
048
097
.96%
1.1
0.8
3.0
Oth
er
child
ren
Den
mar
kD
anis
h_D
ieta
ry_
Surv
eySh
eep
and
othe
r ovi
nes
490
255.
10%
0.6
0.3
1.3
Oth
er
child
ren
Finl
and
DIP
PBe
ef a
nd o
ther
bov
ines
m
eat
933
634
67.9
5%1.
41.
14.
6
Oth
er
child
ren
Finl
and
STR
IPBe
ef a
nd o
ther
bov
ines
m
eat
250
8132
.40%
0.8
0.6
2.1
Oth
er
child
ren
Finl
and
DIP
PPo
rk a
nd o
ther
por
cine
s93
337
339
.98%
1.0
1.2
3.8
Oth
er
child
ren
Finl
and
STR
IPPo
rk a
nd o
ther
por
cine
s25
064
25.6
0%0.
80.
62.
4
Oth
er
child
ren
Finl
and
DIP
PSh
eep
and
othe
r ovi
nes
933
232.
47%
0.6
0.4
1.5
Tabl
e 1.
15 (
cont
inue
d)
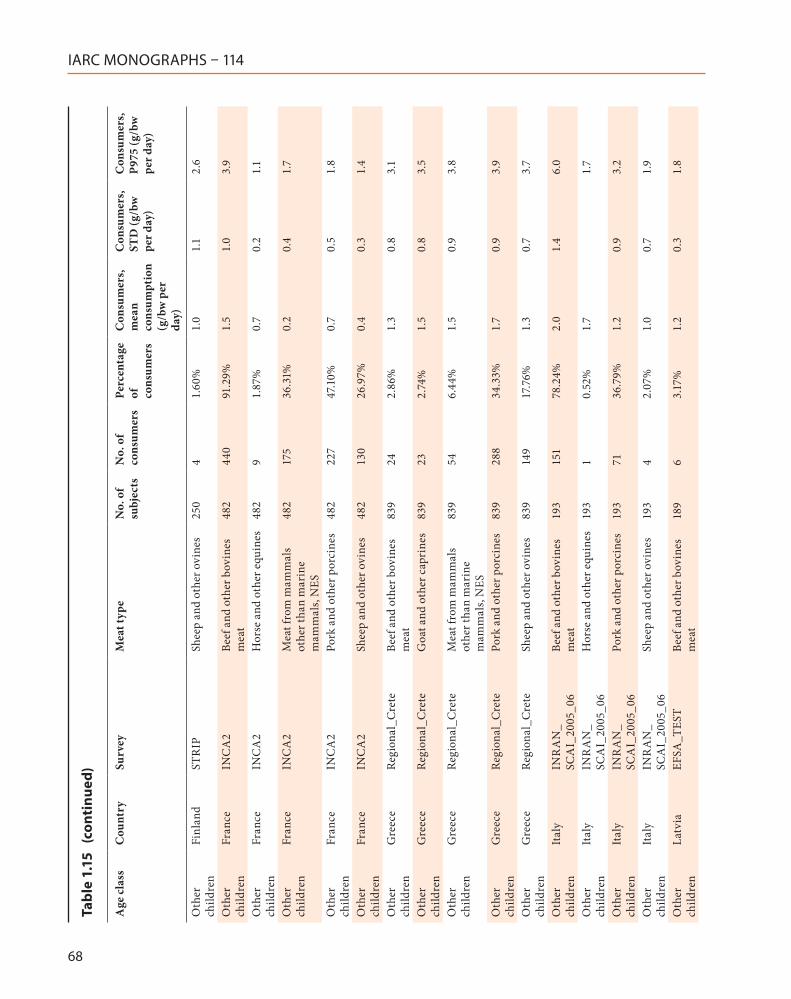
IARC MONOGRAPHS – 114
68
Age
cla
ssC
ount
rySu
rvey
Mea
t typ
eN
o. o
f su
bjec
tsN
o. o
f co
nsum
ers
Perc
enta
ge
of
cons
umer
s
Con
sum
ers,
m
ean
cons
umpt
ion
(g/b
w p
er
day)
Con
sum
ers,
ST
D (g
/bw
pe
r day
)
Con
sum
ers,
P9
75 (g
/bw
pe
r day
)
Oth
er
child
ren
Finl
and
STR
IPSh
eep
and
othe
r ovi
nes
250
41.
60%
1.0
1.1
2.6
Oth
er
child
ren
Fran
ceIN
CA
2Be
ef a
nd o
ther
bov
ines
m
eat
482
440
91.2
9%1.
51.
03.
9
Oth
er
child
ren
Fran
ceIN
CA
2H
orse
and
oth
er e
quin
es48
29
1.87
%0.
70.
21.
1
Oth
er
child
ren
Fran
ceIN
CA
2M
eat f
rom
mam
mal
s ot
her t
han
mar
ine
mam
mal
s, N
ES
482
175
36.3
1%0.
20.
41.
7
Oth
er
child
ren
Fran
ceIN
CA
2Po
rk a
nd o
ther
por
cine
s48
222
747
.10%
0.7
0.5
1.8
Oth
er
child
ren
Fran
ceIN
CA
2Sh
eep
and
othe
r ovi
nes
482
130
26.9
7%0.
40.
31.
4
Oth
er
child
ren
Gre
ece
Regi
onal
_Cre
teBe
ef a
nd o
ther
bov
ines
m
eat
839
242.
86%
1.3
0.8
3.1
Oth
er
child
ren
Gre
ece
Regi
onal
_Cre
teG
oat a
nd o
ther
cap
rine
s83
923
2.74
%1.
50.
83.
5
Oth
er
child
ren
Gre
ece
Regi
onal
_Cre
teM
eat f
rom
mam
mal
s ot
her t
han
mar
ine
mam
mal
s, N
ES
839
546.
44%
1.5
0.9
3.8
Oth
er
child
ren
Gre
ece
Regi
onal
_Cre
tePo
rk a
nd o
ther
por
cine
s83
928
834
.33%
1.7
0.9
3.9
Oth
er
child
ren
Gre
ece
Regi
onal
_Cre
teSh
eep
and
othe
r ovi
nes
839
149
17.7
6%1.
30.
73.
7
Oth
er
child
ren
Ital
yIN
RA
N_
SCA
I_20
05_0
6Be
ef a
nd o
ther
bov
ines
m
eat
193
151
78.2
4%2.
01.
46.
0
Oth
er
child
ren
Ital
yIN
RA
N_
SCA
I_20
05_0
6H
orse
and
oth
er e
quin
es19
31
0.52
%1.
7
1.7
Oth
er
child
ren
Ital
yIN
RA
N_
SCA
I_20
05_0
6Po
rk a
nd o
ther
por
cine
s19
371
36.7
9%1.
20.
93.
2
Oth
er
child
ren
Ital
yIN
RA
N_
SCA
I_20
05_0
6Sh
eep
and
othe
r ovi
nes
193
42.
07%
1.0
0.7
1.9
Oth
er
child
ren
Latv
iaEF
SA_T
EST
Beef
and
oth
er b
ovin
es
mea
t18
96
3.17
%1.
20.
31.
8
Tabl
e 1.
15 (
cont
inue
d)

Red meat and processed meat
69
Age
cla
ssC
ount
rySu
rvey
Mea
t typ
eN
o. o
f su
bjec
tsN
o. o
f co
nsum
ers
Perc
enta
ge
of
cons
umer
s
Con
sum
ers,
m
ean
cons
umpt
ion
(g/b
w p
er
day)
Con
sum
ers,
ST
D (g
/bw
pe
r day
)
Con
sum
ers,
P9
75 (g
/bw
pe
r day
)
Oth
er
child
ren
Latv
iaEF
SA_T
EST
Mea
t fro
m m
amm
als
othe
r tha
n m
arin
e m
amm
als,
NES
189
21.
06%
1.4
0.7
1.9
Oth
er
child
ren
Latv
iaEF
SA_T
EST
Pork
and
oth
er p
orci
nes
189
105
55.5
6%1.
61.
14.
5
Oth
er
child
ren
Net
herla
nds
VC
P_ki
dsBe
ef a
nd o
ther
bov
ines
m
eat
957
255
26.6
5%1.
21.
03.
4
Oth
er
child
ren
Net
herla
nds
VC
P_ki
dsH
orse
and
oth
er e
quin
es95
72
0.21
%0.
30.
10.
4
Oth
er
child
ren
Net
herla
nds
VC
P_ki
dsPo
rk a
nd o
ther
por
cine
s95
716
717
.45%
1.1
0.8
3.0
Oth
er
child
ren
Net
herla
nds
VC
P_ki
dsSh
eep
and
othe
r ovi
nes
957
101.
04%
0.6
0.3
1.3
Oth
er
child
ren
Spai
nN
UT_
INK
05Be
ef a
nd o
ther
bov
ines
m
eat
399
155
38.8
5%2.
31.
46.
1
Oth
er
child
ren
Spai
nen
Kid
Hor
se a
nd o
ther
equ
ines
156
10.
64%
3.9
3.
9
Oth
er
child
ren
Spai
nN
UT_
INK
05H
orse
and
oth
er e
quin
es39
92
0.50
%3.
11.
34.
1
Oth
er
child
ren
Spai
nen
Kid
Mea
t fro
m m
amm
als
othe
r tha
n m
arin
e m
amm
als,
NES
156
4428
.21%
2.4
1.4
6.4
Oth
er
child
ren
Spai
nen
Kid
Pork
and
oth
er p
orci
nes
156
3220
.51%
1.8
1.0
4.6
Oth
er
child
ren
Spai
nN
UT_
INK
05Po
rk a
nd o
ther
por
cine
s39
912
431
.08%
1.5
0.9
3.7
Oth
er
child
ren
Spai
nen
Kid
Shee
p an
d ot
her o
vine
s15
65
3.21
%2.
71.
03.
8
Oth
er
child
ren
Spai
nN
UT_
INK
05Sh
eep
and
othe
r ovi
nes
399
123.
01%
1.9
1.2
4.9
Oth
er
child
ren
Swed
enN
FABe
ef a
nd o
ther
bov
ines
m
eat
1473
826
56.0
8%0.
60.
51.
9
Oth
er
child
ren
Swed
enN
FAH
orse
and
oth
er e
quin
es14
7315
1.02
%0.
20.
20.
7
Tabl
e 1.
15 (
cont
inue
d)
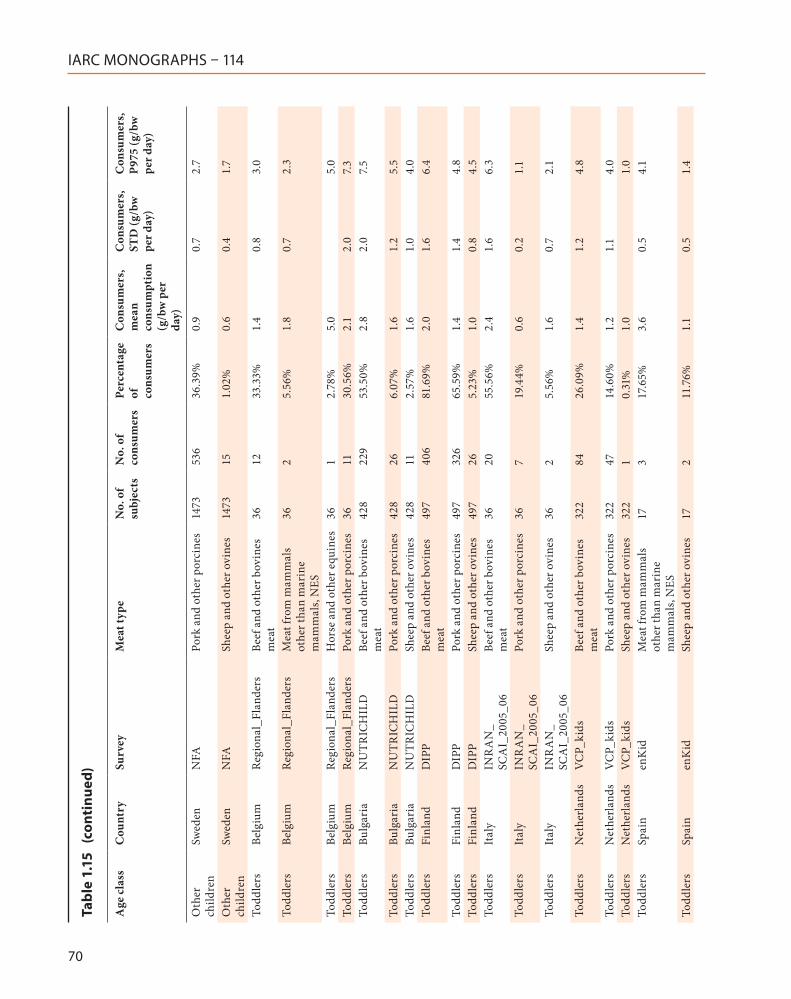
IARC MONOGRAPHS – 114
70
Age
cla
ssC
ount
rySu
rvey
Mea
t typ
eN
o. o
f su
bjec
tsN
o. o
f co
nsum
ers
Perc
enta
ge
of
cons
umer
s
Con
sum
ers,
m
ean
cons
umpt
ion
(g/b
w p
er
day)
Con
sum
ers,
ST
D (g
/bw
pe
r day
)
Con
sum
ers,
P9
75 (g
/bw
pe
r day
)
Oth
er
child
ren
Swed
enN
FAPo
rk a
nd o
ther
por
cine
s14
7353
636
.39%
0.9
0.7
2.7
Oth
er
child
ren
Swed
enN
FASh
eep
and
othe
r ovi
nes
1473
151.
02%
0.6
0.4
1.7
Todd
lers
Belg
ium
Regi
onal
_Fla
nder
sBe
ef a
nd o
ther
bov
ines
m
eat
3612
33.3
3%1.
40.
83.
0
Todd
lers
Belg
ium
Regi
onal
_Fla
nder
sM
eat f
rom
mam
mal
s ot
her t
han
mar
ine
mam
mal
s, N
ES
362
5.56
%1.
80.
72.
3
Todd
lers
Belg
ium
Regi
onal
_Fla
nder
sH
orse
and
oth
er e
quin
es36
12.
78%
5.0
5.
0To
ddle
rsBe
lgiu
mRe
gion
al_F
land
ers
Pork
and
oth
er p
orci
nes
3611
30.5
6%2.
12.
07.
3To
ddle
rsBu
lgar
iaN
UTR
ICH
ILD
Beef
and
oth
er b
ovin
es
mea
t42
822
953
.50%
2.8
2.0
7.5
Todd
lers
Bulg
aria
NU
TRIC
HIL
DPo
rk a
nd o
ther
por
cine
s42
826
6.07
%1.
61.
25.
5To
ddle
rsBu
lgar
iaN
UTR
ICH
ILD
Shee
p an
d ot
her o
vine
s42
811
2.57
%1.
61.
04.
0To
ddle
rsFi
nlan
dD
IPP
Beef
and
oth
er b
ovin
es
mea
t49
740
681
.69%
2.0
1.6
6.4
Todd
lers
Finl
and
DIP
PPo
rk a
nd o
ther
por
cine
s49
732
665
.59%
1.4
1.4
4.8
Todd
lers
Finl
and
DIP
PSh
eep
and
othe
r ovi
nes
497
265.
23%
1.0
0.8
4.5
Todd
lers
Ital
yIN
RA
N_
SCA
I_20
05_0
6Be
ef a
nd o
ther
bov
ines
m
eat
3620
55.5
6%2.
41.
66.
3
Todd
lers
Ital
yIN
RA
N_
SCA
I_20
05_0
6Po
rk a
nd o
ther
por
cine
s36
719
.44%
0.6
0.2
1.1
Todd
lers
Ital
yIN
RA
N_
SCA
I_20
05_0
6Sh
eep
and
othe
r ovi
nes
362
5.56
%1.
60.
72.
1
Todd
lers
Net
herla
nds
VC
P_ki
dsBe
ef a
nd o
ther
bov
ines
m
eat
322
8426
.09%
1.4
1.2
4.8
Todd
lers
Net
herla
nds
VC
P_ki
dsPo
rk a
nd o
ther
por
cine
s32
247
14.6
0%1.
21.
14.
0To
ddle
rsN
ethe
rland
sV
CP_
kids
Shee
p an
d ot
her o
vine
s32
21
0.31
%1.
0
1.0
Todd
lers
Spai
nen
Kid
Mea
t fro
m m
amm
als
othe
r tha
n m
arin
e m
amm
als,
NES
173
17.6
5%3.
60.
54.
1
Todd
lers
Spai
nen
Kid
Shee
p an
d ot
her o
vine
s17
211
.76%
1.1
0.5
1.4
Tabl
e 1.
15 (
cont
inue
d)

Red meat and processed meat
71
Age
cla
ssC
ount
rySu
rvey
Mea
t typ
eN
o. o
f su
bjec
tsN
o. o
f co
nsum
ers
Perc
enta
ge
of
cons
umer
s
Con
sum
ers,
m
ean
cons
umpt
ion
(g/b
w p
er
day)
Con
sum
ers,
ST
D (g
/bw
pe
r day
)
Con
sum
ers,
P9
75 (g
/bw
pe
r day
)
Chi
ldre
n
(1–3
yrs
)U
SAFC
ID-W
WEI
A d
ata
for y
ears
200
5–20
10To
tal r
ed m
eat
5,33
824
5145
.92%
2.4
7.0
4
Chi
ldre
n
(3–1
6 yr
s)U
SAFC
ID-W
WEI
A d
ata
for y
ears
200
5–20
10To
tal r
ed m
eat
1252
196
0576
.71%
1.7
4.
98
NES
, not
els
ewhe
re sp
ecifi
edD
ata
on U
SA fr
om F
CID
(201
5): W
hat W
e Ea
t In
Am
eric
a - F
ood
Com
mod
ity In
take
Dat
abas
e 20
05-1
0, U
.S. E
nvir
onm
enta
l Pro
tect
ion
Age
ncy
- Offi
ce o
f Pes
ticid
e Pr
ogra
ms ©
U
nive
rsity
of M
aryl
and
2012
– 2
016.
Ava
ilabl
e fr
om: h
ttp:
//fci
d.fo
odri
sk.o
rg/p
erce
ntile
s.php
Dat
a fo
r oth
er c
ount
ries
from
FA
O/W
HO
(201
5): t
he F
AO
/WH
O C
hron
ic in
divi
dual
food
con
sum
ptio
n da
taba
se –
Sum
mar
y st
atis
tics (
CIF
OC
Oss
), ©
Cop
yrig
ht W
orld
Hea
lth
Org
aniz
atio
n (W
HO
), 20
16. A
ll R
ight
s Res
erve
d. A
vaila
ble
from
: htt
p://w
ww
.who
.int/
food
safe
ty/d
atab
ases
/en/
Tabl
e 1.
15 (
cont
inue
d)

IARC MONOGRAPHS – 114
72
consumption for consumers were up to 90 and 150 g/day, respectively (FAO/WHO, 2015; Table 1.14, Table 1.15).
(d) Offal consumption
The per capita consumption of mammalian offal worldwide was generally lower than 10 g/day per person, except for Australia and European countries, where the highest levels (15 g/day per person) were reported by GEMS clusters diets (WHO, 2013). From National food consumption surveys, high mean consumption for consumers only was reported for a limited proportion of the population. For example, in Brazil, the average consumption of mammalian offal in the general population was 84 g/day per person for 3.5% of consumers (FAO/WHO, 2015). In Germany, the mean consumption of cattle offal for adults was 53 g/day per person for 0.3% of consumers. In China, the consumption of mammalian offal by the general population was 44 g/day per person for 3.5% of consumers. It should be noted that high consumers can eat up to about 260 g/day per person of mammalian offal (Brazil), and in such situations, offal was a likely substitute for other meat products (FAO/WHO, 2015).
(e) Processed meat consumption
The consumption of processed meat is more difficult to estimate than that of red meat, as it is a heterogeneous food group with different defini-tions across countries. Detailed worldwide data on processed meat consumption (g/kg bw per day) are presented in Table 1.16 and Table 1.17 for adults and children, respectively.
According to the per capita data collected by FAOSTAT, the total processed meat consump-tion was between 0 and 33 g/day (FAO/WHO, 2015). Based on the GEMS cluster diets, the total processed meat consumption ranged from less than 1 to 18 g/day (WHO, 2013).
In the NutriCoDE study, the median of mean consumption of processed meat ranged from 3.9 g/day (1.8–5.1 g/day) for the first quintile
to 34 g/day (26–76 g/day) for the fifth quintile (Imamura et al., 2015).
These levels of consumption of processed meat were consistent with those in Japan, where the percentage of consumers was about 97%, the mean consumption was 14 g/day, and the consumption at the 95th percentile was 34 g/day (FAO/WHO, 2015; Table 1.16). On the contrary, in China, the percentage of consumers of processed meat was about 2–3.8% of the total population; however, for this group, the mean consumption and the consumption at the 95th percentile were 66 and 182 g/day, respectively (FAO/WHO, 2015; Table 1.16). Based on three consecutive 24-hour recalls, a prospective study of 5000 adults from 4280 households in nine provinces showed that the average processed meat consumption increased by three-fold (5 vs 15 g/day per person) from 1989 to 2004 (Zhai et al., 2009).
Intake of processed meat in countries of the Middle East and north Africa was estimated in 2010 to range from 2.5 g/day (Palestine) to 6.7 g/day (United Arab Emirates) (Afshin et al., 2015).
In New Zealand, the mean consumption of sausages and processed meat was 110 g/day for women and 142 g/day for men. At the 90th percentile, the consumption reached 212 g/day for women and 300 g/day for men. In addition, the percentage of consumers older than 15 years was about 16% of the population (Parnell et al., 2012).
In Brazil, the percentage of consumers of processed meat was about 27% of the total popula-tion; however, for this group, the mean consump-tion and the consumption at the 95th percentile were 33 and 94 g/day, respectively (FAO/WHO, 2015; Table 1.16).
In the USA, detailed results were available for processed meat from game, beef, goat, and pork. Interestingly, the percentage of consumers ranged from 0.07% (processed goat meat) to 65% (processed beef meat), but the mean consumption ranged from 42 to 99 g/day, and the consumption

Red meat and processed meat
73
Tabl
e 1.
16 W
orld
wid
e co
nsum
ptio
n of
pro
cess
ed m
eat i
n ad
ults
Age
cla
ssC
ount
rySu
rvey
Mea
t typ
eN
o. o
f su
bjec
tsN
o. o
f co
nsum
ers
Perc
enta
ge o
f co
nsum
ers
Con
sum
ers,
m
ean
cons
umpt
ion
(g/b
w p
er d
ay)
Con
sum
ers,
ST
D (g
/bw
pe
r day
)
Con
sum
ers,
P9
75 (g
/bw
pe
r day
)
Gen
eral
po
pula
tion
Braz
ilBr
azili
an In
stitu
te
of G
eogr
aphy
and
St
atis
tics
Proc
esse
d m
eat a
nd
mea
t pro
duct
s, N
ES34
003
334
0.98
%0.
60.
62.
1
Gen
eral
po
pula
tion
Braz
ilBr
azili
an In
stitu
te
of G
eogr
aphy
and
St
atis
tics
Proc
esse
d m
eat a
nd
mea
t pro
duct
s, N
ES34
003
9047
26.6
1%0.
50.
51.
8
Gen
eral
po
pula
tion
Braz
ilBr
azili
an In
stitu
te
of G
eogr
aphy
and
St
atis
tics
Proc
esse
d m
eat a
nd
mea
t pro
duct
s, N
ES34
003
540.
16%
1.2
0.8
2.6
Gen
eral
po
pula
tion
Braz
ilBr
azili
an In
stitu
te
of G
eogr
aphy
and
St
atis
tics
Proc
esse
d m
eat a
nd
mea
t pro
duct
s, N
ES34
003
140.
04%
1.4
0.8
3.6
Gen
eral
po
pula
tion
Braz
ilBr
azili
an In
stitu
te
of G
eogr
aphy
and
St
atis
tics
Proc
esse
d m
eat a
nd
mea
t pro
duct
s, N
ES34
003
80.
02%
0.5
0.2
0.8
Gen
eral
po
pula
tion
Braz
ilBr
azili
an In
stitu
te
of G
eogr
aphy
and
St
atis
tics
Proc
esse
d m
eat a
nd
mea
t pro
duct
s, N
ES34
003
240.
07%
0.9
0.7
2.1
Gen
eral
po
pula
tion
Chi
na20
02 C
hina
Nut
ritio
n an
d H
ealth
Sur
vey
Proc
esse
d m
eat a
nd
mea
t pro
duct
s, N
ES65
359
1430
2.19
%1.
21.
14.
2
Gen
eral
po
pula
tion
Chi
na20
02 C
hina
Nut
ritio
n an
d H
ealth
Sur
vey
Proc
esse
d m
eat a
nd
mea
t pro
duct
s, N
ES65
359
2483
3.80
%0.
91.
32.
7
Gen
eral
po
pula
tion
Japa
nD
SFFQ
_FI
Proc
esse
d m
eat a
nd
mea
t pro
duct
s, N
ES27
1126
4297
.45%
0.3
0.2
0.8
Gen
eral
po
pula
tion
Japa
nD
SFFQ
_FI
Proc
esse
d m
eat a
nd
mea
t pro
duct
s, N
ES27
1124
0.89
%0.
00.
0
Adu
ltsBe
lgiu
mD
iet_
Nat
iona
l_20
04Pr
oces
sed
mea
t and
m
eat p
rodu
cts,
NES
1304
956
73.3
1%0.
80.
72.
7
Adu
ltsC
zech
Re
publ
icSI
SP04
Proc
esse
d m
eat a
nd
mea
t pro
duct
s, N
ES16
6614
2785
.65%
1.2
1.0
3.9
Adu
ltsD
enm
ark
Dan
ish
Die
tary
Su
rvey
Proc
esse
d m
eat a
nd
mea
t pro
duct
s, N
ES28
2228
0099
.22%
0.4
0.3
1.3
Adu
ltsFi
nlan
dFI
ND
IET_
2007
Proc
esse
d m
eat a
nd
mea
t pro
duct
s, N
ES15
7511
8875
.43%
0.7
0.7
2.9

IARC MONOGRAPHS – 114
74
Age
cla
ssC
ount
rySu
rvey
Mea
t typ
eN
o. o
f su
bjec
tsN
o. o
f co
nsum
ers
Perc
enta
ge o
f co
nsum
ers
Con
sum
ers,
m
ean
cons
umpt
ion
(g/b
w p
er d
ay)
Con
sum
ers,
ST
D (g
/bw
pe
r day
)
Con
sum
ers,
P9
75 (g
/bw
pe
r day
)
Adu
ltsFr
ance
INC
A2
Proc
esse
d m
eat a
nd
mea
t pro
duct
s, N
ES22
7621
6795
.21%
0.6
0.4
1.6
Adu
ltsH
unga
ryN
atio
nal_
Repr
_Sur
vPr
oces
sed
mea
t and
m
eat p
rodu
cts,
NES
1074
1003
93.3
9%1.
10.
83.
0
Adu
ltsIr
elan
dN
SIFC
SPr
oces
sed
mea
t and
m
eat p
rodu
cts,
NES
958
906
94.5
7%0.
80.
62.
1
Adu
ltsIt
aly
INR
AN
_SC
AI_
2005
_06
Proc
esse
d m
eat a
nd
mea
t pro
duct
s, N
ES23
1319
2183
.05%
0.5
0.4
1.6
Adu
ltsLa
tvia
EFSA
_TES
TPr
oces
sed
mea
t and
m
eat p
rodu
cts,
NES
1306
868
66.4
6%0.
90.
72.
8
Adu
ltsN
ethe
rland
sD
NFC
S_20
03Pr
oces
sed
mea
t and
m
eat p
rodu
cts,
NES
750
618
82.4
0%0.
70.
62.
4
Adu
ltsSp
ain
AES
AN
Proc
esse
d m
eat a
nd
mea
t pro
duct
s, N
ES41
033
481
.46%
0.9
0.7
2.5
Adu
ltsSp
ain
AES
AN
_FIA
BPr
oces
sed
mea
t and
m
eat p
rodu
cts,
NES
981
908
92.5
6%0.
80.
62.
5
Adu
ltsSw
eden
Rik
smat
en_1
997_
98Pr
oces
sed
mea
t and
m
eat p
rodu
cts,
NES
1210
1147
94.7
9%0.
70.
41.
6
Adu
ltsU
nite
d K
ingd
omN
DN
SPr
oces
sed
mea
t and
m
eat p
rodu
cts,
NES
1724
1492
86.5
4%0.
50.
41.
4
NES
, not
els
ewhe
re sp
ecifi
edD
ata
on U
SA fr
om F
CID
(201
5): W
hat W
e Ea
t In
Am
eric
a –
Food
Com
mod
ity In
take
Dat
abas
e 20
05–1
0, U
S. E
nvir
onm
enta
l Pro
tect
ion
Age
ncy
– O
ffice
of P
estic
ide
Prog
ram
s ©
Uni
vers
ity o
f Mar
ylan
d 20
12 –
201
6. A
vaila
ble
from
: htt
p://f
cid.
food
risk
.org
/per
cent
iles.p
hpD
ata
for o
ther
cou
ntri
es fr
om F
AO
/WH
O (2
015)
: the
FA
O/W
HO
Chr
onic
indi
vidu
al fo
od c
onsu
mpt
ion
data
base
– S
umm
ary
stat
istic
s (C
IFO
CO
ss),
© C
opyr
ight
Wor
ld H
ealth
O
rgan
izat
ion
(WH
O),
2016
. All
Rig
hts R
eser
ved.
Ava
ilabl
e fr
om: h
ttp:
//ww
w.w
ho.in
t/fo
odsa
fety
/dat
abas
es/e
n/
Tabl
e 1.
16 (
cont
inue
d)
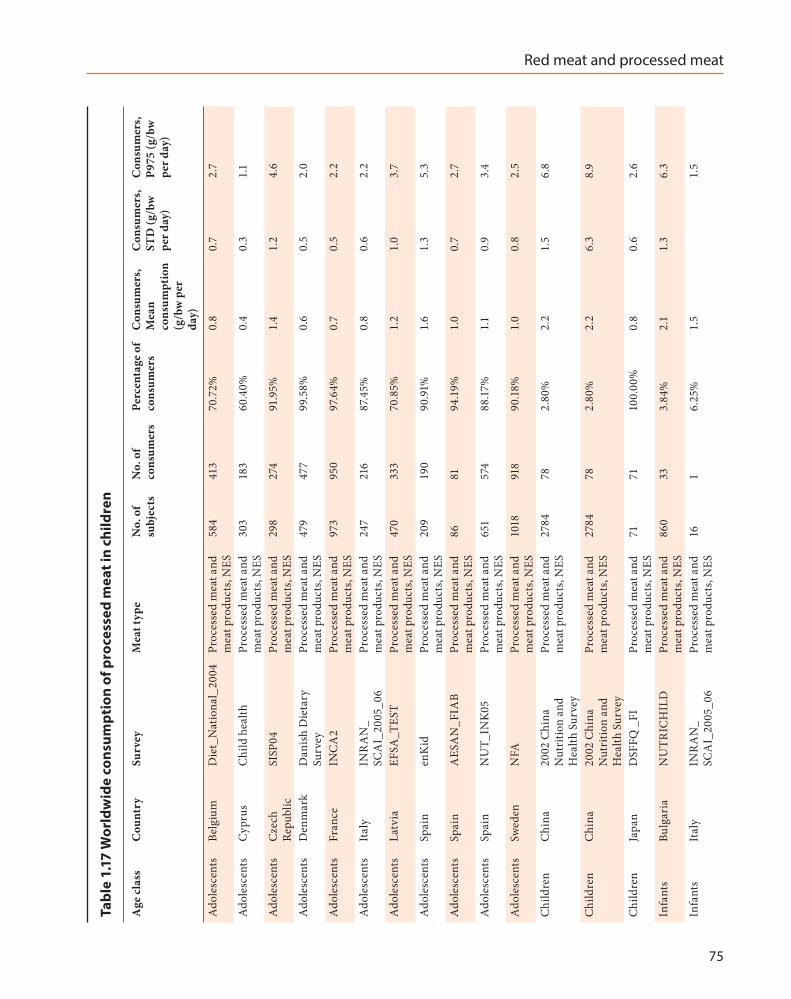
Red meat and processed meat
75
Tabl
e 1.
17 W
orld
wid
e co
nsum
ptio
n of
pro
cess
ed m
eat i
n ch
ildre
n
Age
cla
ssC
ount
rySu
rvey
Mea
t typ
eN
o. o
f su
bjec
tsN
o. o
f co
nsum
ers
Perc
enta
ge o
f co
nsum
ers
Con
sum
ers,
M
ean
cons
umpt
ion
(g/b
w p
er
day)
Con
sum
ers,
ST
D (g
/bw
pe
r day
)
Con
sum
ers,
P9
75 (g
/bw
pe
r day
)
Ado
lesc
ents
Belg
ium
Die
t_N
atio
nal_
2004
Proc
esse
d m
eat a
nd
mea
t pro
duct
s, N
ES58
441
370
.72%
0.8
0.7
2.7
Ado
lesc
ents
Cyp
rus
Chi
ld h
ealth
Proc
esse
d m
eat a
nd
mea
t pro
duct
s, N
ES30
318
360
.40%
0.4
0.3
1.1
Ado
lesc
ents
Cze
ch
Repu
blic
SISP
04Pr
oces
sed
mea
t and
m
eat p
rodu
cts,
NES
298
274
91.9
5%1.
41.
24.
6
Ado
lesc
ents
Den
mar
kD
anis
h D
ieta
ry
Surv
eyPr
oces
sed
mea
t and
m
eat p
rodu
cts,
NES
479
477
99.5
8%0.
60.
52.
0
Ado
lesc
ents
Fran
ceIN
CA
2Pr
oces
sed
mea
t and
m
eat p
rodu
cts,
NES
973
950
97.6
4%0.
70.
52.
2
Ado
lesc
ents
Ital
yIN
RA
N_
SCA
I_20
05_0
6Pr
oces
sed
mea
t and
m
eat p
rodu
cts,
NES
247
216
87.4
5%0.
80.
62.
2
Ado
lesc
ents
Latv
iaEF
SA_T
EST
Proc
esse
d m
eat a
nd
mea
t pro
duct
s, N
ES47
033
370
.85%
1.2
1.0
3.7
Ado
lesc
ents
Spai
nen
Kid
Proc
esse
d m
eat a
nd
mea
t pro
duct
s, N
ES20
919
090
.91%
1.6
1.3
5.3
Ado
lesc
ents
Spai
nA
ESA
N_F
IAB
Proc
esse
d m
eat a
nd
mea
t pro
duct
s, N
ES86
8194
.19%
1.0
0.7
2.7
Ado
lesc
ents
Spai
nN
UT_
INK
05Pr
oces
sed
mea
t and
m
eat p
rodu
cts,
NES
651
574
88.1
7%1.
10.
93.
4
Ado
lesc
ents
Swed
enN
FAPr
oces
sed
mea
t and
m
eat p
rodu
cts,
NES
1018
918
90.1
8%1.
00.
82.
5
Chi
ldre
nC
hina
2002
Chi
na
Nut
ritio
n an
d H
ealth
Sur
vey
Proc
esse
d m
eat a
nd
mea
t pro
duct
s, N
ES27
8478
2.80
%2.
21.
56.
8
Chi
ldre
nC
hina
2002
Chi
na
Nut
ritio
n an
d H
ealth
Sur
vey
Proc
esse
d m
eat a
nd
mea
t pro
duct
s, N
ES27
8478
2.80
%2.
26.
38.
9
Chi
ldre
nJa
pan
DSF
FQ _
FIPr
oces
sed
mea
t and
m
eat p
rodu
cts,
NES
7171
100.
00%
0.8
0.6
2.6
Infa
nts
Bulg
aria
NU
TRIC
HIL
DPr
oces
sed
mea
t and
m
eat p
rodu
cts,
NES
860
333.
84%
2.1
1.3
6.3
Infa
nts
Ital
yIN
RA
N_
SCA
I_20
05_0
6Pr
oces
sed
mea
t and
m
eat p
rodu
cts,
NES
161
6.25
%1.
51.
5

IARC MONOGRAPHS – 114
76
Age
cla
ssC
ount
rySu
rvey
Mea
t typ
eN
o. o
f su
bjec
tsN
o. o
f co
nsum
ers
Perc
enta
ge o
f co
nsum
ers
Con
sum
ers,
M
ean
cons
umpt
ion
(g/b
w p
er
day)
Con
sum
ers,
ST
D (g
/bw
pe
r day
)
Con
sum
ers,
P9
75 (g
/bw
pe
r day
)
Oth
er
child
ren
Belg
ium
Regi
onal
Fla
nder
sPr
oces
sed
mea
t and
m
eat p
rodu
cts,
NES
625
468
74.8
8%1.
51.
34.
7
Oth
er
child
ren
Bulg
aria
NU
TRIC
HIL
DPr
oces
sed
mea
t and
m
eat p
rodu
cts,
NES
433
261
60.2
8%1.
91.
65.
7
Oth
er
child
ren
Cze
ch
Repu
blic
SISP
04Pr
oces
sed
mea
t and
m
eat p
rodu
cts,
NES
389
314
80.7
2%1.
61.
45.
5
Oth
er
child
ren
Den
mar
kD
anis
h D
ieta
ry
Surv
eyPr
oces
sed
mea
t and
m
eat p
rodu
cts,
NES
490
488
99.5
9%1.
30.
94.
0
Oth
er
child
ren
Finl
and
STR
IPPr
oces
sed
mea
t and
m
eat p
rodu
cts,
NES
250
218
87.2
0%1.
31.
03.
9
Oth
er
child
ren
Finl
and
DIP
PPr
oces
sed
mea
t and
m
eat p
rodu
cts,
NES
933
825
88.4
2%1.
81.
66.
1
Oth
er
child
ren
Fran
ceIN
CA
2Pr
oces
sed
mea
t and
m
eat p
rodu
cts,
NES
482
465
96.4
7%1.
30.
93.
5
Oth
er
child
ren
Gre
ece
Regi
onal
Cre
tePr
oces
sed
mea
t and
m
eat p
rodu
cts,
NES
839
327
38.9
7%0.
50.
51.
8
Oth
er
child
ren
Ital
yIN
RA
N_
SCA
I_20
05_0
6Pr
oces
sed
mea
t and
m
eat p
rodu
cts,
NES
193
157
81.3
5%1.
21.
04.
0
Oth
er
child
ren
Latv
iaEF
SA_T
EST
Proc
esse
d m
eat a
nd
mea
t pro
duct
s, N
ES18
911
359
.79%
1.8
1.6
6.4
Oth
er
child
ren
Net
herla
nds
VC
P ki
dsPr
oces
sed
mea
t and
m
eat p
rodu
cts,
NES
957
748
78.16
%1.
61.
24.
5
Oth
er
child
ren
Spai
nen
Kid
Proc
esse
d m
eat a
nd
mea
t pro
duct
s, N
ES15
613
888
.46%
2.2
1.5
6.5
Oth
er
child
ren
Spai
nN
UT_
INK
05Pr
oces
sed
mea
t and
m
eat p
rodu
cts,
NES
399
357
89.4
7%1.
71.
24.
5
Oth
er
child
ren
Swed
enN
FAPr
oces
sed
mea
t and
m
eat p
rodu
cts,
NES
1473
1379
93.6
2%1.
51.
14.
3
Todd
lers
Belg
ium
Regi
onal
Fla
nder
sPr
oces
sed
mea
t and
m
eat p
rodu
cts,
NES
3624
66.6
7%1.
91.
25.
7
Todd
lers
Bulg
aria
NU
TRIC
HIL
DPr
oces
sed
mea
t and
m
eat p
rodu
cts,
NES
428
164
38.3
2%2.
01.
55.
2
Tabl
e 1.
17 (
cont
inue
d)

Red meat and processed meat
77
Age
cla
ssC
ount
rySu
rvey
Mea
t typ
eN
o. o
f su
bjec
tsN
o. o
f co
nsum
ers
Perc
enta
ge o
f co
nsum
ers
Con
sum
ers,
M
ean
cons
umpt
ion
(g/b
w p
er
day)
Con
sum
ers,
ST
D (g
/bw
pe
r day
)
Con
sum
ers,
P9
75 (g
/bw
pe
r day
)
Todd
lers
Finl
and
DIP
PPr
oces
sed
mea
t and
m
eat p
rodu
cts,
NES
497
142
28.5
7%1.
51.
65.
5
Todd
lers
Ital
yIN
RA
N_
SCA
I_20
05_0
6Pr
oces
sed
mea
t and
m
eat p
rodu
cts,
NES
3622
61.11
%1.
61.
25.
6
Todd
lers
Net
herla
nds
VC
P ki
dsPr
oces
sed
mea
t and
m
eat p
rodu
cts,
NES
322
254
78.8
8%1.
81.
66.
5
Todd
lers
Spai
nen
Kid
Proc
esse
d m
eat a
nd
mea
t pro
duct
s, N
ES17
1376
.47%
2.7
1.8
6.9
NES
, not
els
ewhe
re sp
ecifi
edD
ata
on U
SA fr
om F
CID
(201
5): W
hat W
e Ea
t In
Am
eric
a –
Food
Com
mod
ity In
take
Dat
abas
e 20
05–1
0, U
nite
d St
ates
Env
iron
men
tal P
rote
ctio
n A
genc
y –
Offi
ce o
f Pes
ticid
e Pr
ogra
ms
© U
nive
rsity
of M
aryl
and
2012
– 2
016.
Ava
ilabl
e fr
om: h
ttp:
//fci
d.fo
odri
sk.o
rg/p
erce
ntile
s.php
Dat
a fo
r oth
er c
ount
ries
from
FA
O/W
HO
(201
5): t
he F
AO
/WH
O C
hron
ic in
divi
dual
food
con
sum
ptio
n da
taba
se –
Sum
mar
y st
atis
tics (
CIF
OC
Oss
), ©
Cop
yrig
ht W
orld
Hea
lth
Org
aniz
atio
n (W
HO
), 20
16. A
ll R
ight
s Res
erve
d. A
vaila
ble
from
: htt
p://w
ww
.who
.int/
food
safe
ty/d
atab
ases
/en/
Tabl
e 1.
17 (
cont
inue
d)

IARC MONOGRAPHS – 114
78
at the 95th percentile ranged from 152 to 309 g/day (FCID, 2015).
In Europe, the mean consumption of processed meat for adults was between about 10 and 80 g/day. The consumption at the 95th percentile was up to 200 g/day (EFSA, 2011). In the EPIC cohort, the lowest consumption of processed meat was found in Greece, with 11 g/day for women and 19 g/day for men. The highest consumption of processed meat was found in Norway for women (48 g/day) and in Germany for men (89 g/day) (Linseisen et al., 2006).
[The Working Group noted that despite the weaknesses of the data set, it seemed that in certain countries the consumption of processed meat is similar to the consumption of red meat for consumers only. However, the percentage of consumers of processed meat seemed to be much smaller, leading to a per capita consumption four to five times lower than that of red meat.]
(f) Dietary exposure to chemicals in meat
(i) Chemicals in the environmentSeveral chemicals classified as carcinogens by
the International Agency for Research on Cancer (IARC) are present in the environment and can contaminate meat through air, water, or animal feed. They can be generated either from indus-trial activities or from microorganisms (IARC, 2010a, b, 2012a, b, 2016).
Dioxin and dioxin-like compounds: The Joint FAO/WHO Expert Committee on Food Additives (JECFA) assessed dioxins and related compounds in 2002. The dietary exposure estimate, expressed as toxic equiva-lency factors for PCDDs and PCDFs based on national data, ranged from 33 to 42 pg/kg bw per month and from 81 to 100 pg/kg bw per month at the 50th and 90th percen-tiles, respectively. For coplanar PCBs, the dietary exposure estimate ranged from 9 to 47 pg/kg bw per month and from 25 to
130 pg/kg bw per month at the 50th and 90th percentiles, respectively. The contribution from meat was estimated to range from 6% in Asia to 23% in north America for PCDDs and PCDFs, and from 4% in Asia to 55% in north America for dioxin-like PCBs (JECFA, 2002).Brominated flame retardants (BFRs): Food consumption, especially fish and meat product consumption, is a major route of human contamination (Lyche et al., 2015). For example, higher levels of PBDEs in humans were found in studies in the USA where fish were most highly contaminated (median, 616 pg/g), followed by meat (median, 190 pg/g). However, unlike many European countries where fish consumption predom-inates, dietary intake of PBDEs in the USA is mostly from meat consumption (Schecter et al., 2008).Heavy metals: The heavy metals cadmium, arsenic, and lead have been classified as carcinogens by IARC (IARC, 2012a). For the EU, the European Food Safety Authority (EFSA) has estimated that average weekly dietary exposure to cadmium was 2.04 µg/kg bw, and at the 95th percentile, weekly dietary exposure to cadmium was 3.66 µg/kg bw. Food consumed in larger quan-tities had the greatest impact on dietary expo-sure to cadmium. This was true for the broad food categories of grains and grain products (26.9%). Meat and edible offal were estimated to contribute 7.7% of the total dietary expo-sure (EFSA, 2012). In 2010, JECFA estimated that for adults, the mean dietary expo-sure to cadmium was 2.2–12 μg/kg bw per month, and high-level dietary exposure to cadmium was 6.9–12.1 μg/kg bw per month. For children aged 6 months to 12 years, the mean dietary exposure to cadmium was 3.9–20.6 μg/kg bw per month. Meat was not part of the food groups that contributed significantly (40–85%) to the total dietary
Red meat and processed meat
79
exposure to cadmium (i.e. rice, wheat, vege-tables, and molluscs) (JECFA, 2013). Dietary exposure to inorganic arsenic was last evaluated by JECFA in 2011. The occur-rence of total arsenic in meat ranged from 0.004 to 0.78 mg/kg, and meat was not a major contributor to dietary exposure to inorganic arsenic (JECFA, 2011). Lead was last evaluated by JECFA in 2011. Mean dietary exposure to lead ranged from 0.02 to 3 μg/kg bw per day for adults, and from 0.03 to 9 μg/kg bw per day for children. The contribution of meat and meat products, including offal, was estimated to be 9% of the total dietary exposure to lead (JECFA, 2013).Mycotoxins: EFSA concluded that carry-over of aflatoxin, deoxynivalenol, zearalenone, and fumonisin to products of animal origin was very low (EFSA, 2004a, b, c, 2005c; Kan & Meijer, 2007). Accumulation of ochratoxin A occurred predominantly in the blood, liver, and kidney. Muscle, milk, and eggs contained much lower levels of this mycotoxin (EFSA, 2004d).
(ii) Chemicals from cooking practices
Heterocyclic aromatic amines (HAAs): No international dietary exposure assessment was available for HAAs; however, in the EPIC study, dietary exposure to HAAs was esti-mated in the Heidelberg cohort (Germany) using a detailed dietary questionnaire that assessed meat consumption, cooking methods, and degree of browning of the respective food items. Results based on total meat consumption (including poultry meat) showed a total median exposure to HAAs of 30.6 ng/day (13–71.3 ng/day) (Rohrmann et al., 2007). Other studies’ results showed a significantly lower dietary exposure to HAAs for Europe (6.1 ng/kg bw per day) (Zimmerli et al., 2001) and the USA (11.0–19.9 ng/kg bw per day) (Keating & Bogen, 2004).
Polycyclic aromatic hydrocarbons (PAHs): In 2006, JECFA estimated the dietary exposure to PAHs in 18 countries, including Australia, Brazil, New Zealand, and the United Kingdom. Estimated intake of BaP ranged from < 1 to 2.0 µg/day and from 0.0001 to 0.005 µg/kg bw per day. For the other nine PAHs, intake ranged from less than 1 to ~12 µg/day and from 0.0001 to 0.015 µg/kg bw per day (WHO, 2006). Generally, despite high concentrations of PAHs, meat and barbecued foods were not major contributors to PAH exposure; however, in the USA, grilled and barbecued meat was estimated to contribute to 21% of the intake of BaP (WHO, 2006). Cereals, vegetal oil, animal fat, and vegetal fat contributed up to 60% to the whole food intake of PAHs, as they are major contribu-tors by weight to the total diet (Dennis et al., 1983).Nitrosamines: The main sources of NOCs in the diet are nitrite-preserved meat products (Tricker, 1997; Haorah et al., 2001). Haorah et al. (2001) reported a mean concentration of 5.5 µmol/kg of NOCs in frankfurters, but only 0.5 µmol/kg of NOCs in fresh meat.Acrylamide: Acrylamide may occur in meat during cooking (Tareke et al., 2002). However, meat has been estimated to be a minor contributor, between 0.2% and 2% of total dietary intake (WHO, 2006).
1.4 Exposure assessment and biological markers
1.4.1 Questionnaires
A description of the epidemiological studies included in this Monograph, in terms of their study design, is provided in Section 2. A review of dietary assessment methodologies used in the epidemiological studies is beyond the scope of this Monograph (e.g. Thompson & Subar, 2013).

IARC MONOGRAPHS – 114
80
The majority of the studies used food frequency questionnaires (FFQs) to assess individual meat intake (including red meat and processed meat). FFQs are typically used in epidemio-logical studies to measure usual dietary intake in individuals for several reasons. First, FFQs are a feasible approach in case–control studies, where usual diet must be ascertained retrospec-tively (often from the distant past). Second, in large prospective cohort studies, FFQs can be distributed by mail or online to a large number of participants; are self-administered (typically); may be optically scanned, computer-assisted, or web-based; and are analysed using precoded foods/food groups and portion sizes.
The FFQ approach asks respondents to report their usual frequency of consumption for each food from a list of foods during a specific period of time (several months or a year). FFQs are generally used for ranking subjects according to food or nutrient intake, rather than for esti-mating absolute levels of intake. In addition, they are widely used in case–control and cohort studies to assess an association between dietary intake and disease risk (Kushi, 1994; Beaton, 1994; Sempos et al., 1999).
The ability to quantify total dietary intake depends on the number of food items listed in the FFQ, on the level of detail collected within the questionnaire, on whether portion sizes for the foods/food groups are included, and on the timeframe of intake or reference period used. For red meat and processed meat specifically, the classifications used to define red meat and processed meat as a food category also influence the calculation of total dietary intake (Block et al. 1986; Rimm et al., 1992).
Although food lists included in FFQs vary based on the purpose of the study and the study population, the appropriateness of the food lists is crucial. The full variability of an individual’s diet, which includes many foods and mixed dishes, cannot be captured by a finite food list. Ollberding et al. (2012), for example, identified
a food list for their FFQ using 3-day measured food records that could capture 85% or more of the intake of key nutrients and also food items traditionally consumed by the populations repre-sented in the Multiethnic Cohort Study.
Many FFQs have been developed and adapted to suit different research questions and popula-tions. In the USA, for example, several question-naires are commonly used (and are cited in this Monograph), including:
Health Habits and History Questionnaire (HHHQ) or Block questionnaire (Block et al., 1986, 1990; Sobell et al., 1989): This is a semiquantitative food frequency question-naire (SQFFQ) originally developed by the National Cancer Institute (NCI). The SQFFQ collects portion size information; however, portion sizes are specified as standardized portions or by choosing from a range of portions sizes (e.g. small, medium, or large). The original Block FFQ has been modified, and is continually updated by researchers to suit their research questions and populations.Harvard FFQ or Willett questionnaire (Caan et al., 1998; McCann et al., 1999): This FFQ was developed at Harvard University. Standard portion size defaults are included as part of the food items listed, rather than as a separate listing.NCI Diet History Questionnaire (DHQ): The DHQ was designed with an emphasis on cognitive ease of use for respondents (Subar et al., 1995, 2001). It is an SQFFQ, which uses an embedded question approach, that was developed by NCI.
Definitions of red meat and processed meat as a food category varied across the studies included in this Monograph. Red meat was commonly defined as beef, pork, lamb, or a combination thereof, and processed meat was generally defined as meat made largely from pork, beef, or poultry that undergoes methods of preservation,

Red meat and processed meat
81
such as curing, smoking, or drying (Santarelli et al., 2008). While many studies explicitly defined these classifications (Tiemersma et al., 2002; Ferrucci et al., 2009; Cross et al., 2010), other studies provided either no description or an unclear description of these classifications (Kato et al., 1997; Järvinen et al., 2001). The level of detail collected by the epidemiological studies, in terms of meat intake, varied widely. Most studies reported the association between categories of meat intake labelled “red meat” or “processed meat” and cancer risk; however, several studies reported results for individual red meat items (e.g. beef or pork) (Brink et al., 2005; Norat et al., 2005; Sato et al., 2006; Takachi et al., 2011; Egeberg et al., 2013) and/or processed meat items (e.g., hot dogs or bacon). The studies that included detailed information on the intake of specific processed meat items were superior to those that combined generic items into one food group or one-line items (e.g. “processed meat”), as the amount of nitrate, nitrite, and haem iron in processed foods can vary dramatically.
(a) Portion size
Scientists have used many methods to improve assessment of portion size in the studies included in this report. For example, Pietinen et al. (1999) included a portion size booklet of 122 photographs of foods, each with three to five different portion sizes. In the Canadian National Breast Screening Study (CNBSS), Kabat et al. (2007) also included photographs of portion sizes to improve portion size assessment. In the Finnish Mobile Clinic Health Examination Survey, Järvinen et al. (2001) used plastic food models and real foods to help estimate portion sizes for their interviewer-assisted FFQ. Dixon et al. (2004) also used three-dimensional food models, plastic cups, and spoons to help partic-ipants identify usual serving sizes in the Kaiser Permanente Medical Care Program in northern California, USA.
(b) Validation and calibration
The relative validity of an FFQ provides information on how well the instrument is measuring what it is intended to measure. This is completed by comparing intake assessed using an FFQ with intake assessed using a reference method (which is deemed to be superior) in the same individuals (e.g. an interviewer-led dietary history or multiple 24-hour recalls). FFQs may often be validated for their ability to assess total energy intake in comparison with the doubly labelled water technique (Hill & Davies, 2001). The superior method is often prohibitive for use in large epidemiological studies due to partici-pant burden, or overall cost of administering and coding the instrument. Calibration studies are used to calibrate an FFQ to a reference method using a regression model. Many of the studies included in this Monograph used various statis-tical methods, employing measurement error models and energy adjustment to assess the validity of the FFQs and to adjust estimates of the relative risks for disease outcomes (Bingham & Day, 1997; Kipnis et al., 1997; Carroll et al., 1998; Hu et al., 1999). For example, in the National Institutes of Health – American Association of Retired Persons (NIH-AARP) Diet and Health Study, the FFQ used was calibrated against two non-consecutive 24-hour dietary recalls (Cross et al., 2010). In the EPIC study, investigators used a computerized 24-hour dietary recall method to calibrate dietary measurements across countries and to correct for systematic over- or underes-timation of dietary intake (Norat et al., 2005; Pala et al., 2009). Tiemersma et al. (2002) vali-dated their short SQFFQ using a dietary history method, which is a robust, interviewer-admin-istered dietary assessment method. Each study included in this Monograph was examined to determine whether the FFQ used to assess red meat and processed meat exposure had been validated (see Section 2).
IARC MONOGRAPHS – 114
82
(i) Heterocyclic aromatic aminesAssessment of dietary HAA intake is chal-
lenging, as HAA concentrations vary greatly according to cooking technique, temperature, cooking time, and meat type (Sinha et al., 1995; Knize et al., 1998; Sinha et al., 1998a, b). Epidemiological studies have tried to overcome these difficulties using surrogate markers of HAA intake, such as method of cooking, surface browning, total cooking time, and gravy intake.
To estimate the intake of these cooked meat mutagens, a detailed meat-cooking module was developed. The meat-cooking module was a modi-fied version of the 1992, 100-item, self-adminis-tered HHHQ to assess usual dietary intake over the past year (Block et al., 1986). An interview-er-administered questionnaire on meat-cooking practices was also used to assess the consumption of 23 meat, poultry, and fish items using a matrix similar to the 100-item HHHQ. The question-naire collected information on cooking methods; embedded questions assessed how well the meat was cooked. Portion size was estimated as small, medium, or large, relative to the standard portion size indicated for each food listed in the ques-tionnaire and meat-cooking module. A mutagen database, called Computerized Heterocyclic Amines Resource for Research in Epidemiology of Disease (CHARRED), developed by NCI/NIH (NCI, 2017) was used to estimate the intake of mutagenic compounds from cooked meats. The CHARRED database estimates the HAA content of commonly consumed meats, based on detailed information about the meat-cooking methods used and meat-doneness level. The rela-tive validity of this meat-cooking module has been measured using multiple food diaries (three of four non-consecutive day diaries completed over a 3-month period) as the reference method (Cantwell et al., 2004). Dietary intake of the three most abundant HAAs was considered: MeIQx, 2-amino-3,4,8-trimethylimidazo[4,5-f]quinoxaline (4,8-DiMeIQx), and PhIP. Crude
correlation coefficients of HAA intake, assessed using the FFQ and food diaries, were 0.43 (95% confidence interval, CI, 0.30–0.55) for MeIQx intake and 0.22 (95% CI, 0.07–0.36) for PhIP intake. Deattenuated correlations were 0.60 (95% CI, 0.49–0.69) and 0.36 (95% CI, 0.22–0.49), respectively (Cantwell et al., 2004). This meat-cooking module has been used in the Prostate, Lung, Colorectal and Ovarian (PLCO) Cancer Screening Trial (Cross et al., 2005), Nurses’ Health Study (NHS) (Wu et al., 2010), Health Professionals Follow-Up Study (HPFS), and other studies (Cantwell et al., 2004).
(ii) Nitrate and nitriteDietary assessment of nitrate and nitrite
intake was reported by the NIH-AARP Diet and Health Study (Dellavalle et al., 2013). The base-line questionnaire included an FFQ that asked participants about their frequency of consump-tion and portion sizes of 124 food items over the past 12 months. Intake of each item was assessed using 10 predefined categories, ranging from “never” to “≥ 2 times per day” for foods, “never” to “≥ 6 times per day” for beverages, and three portion size categories. The FFQ was developed and validated by NCI using two 24-hour recalls in a subset of the cohort (Thompson et al., 2008). Concentrations of nitrate and nitrite for each food item were estimated from the existing body of scientific literature, as previously described (Ward et al., 2003, 2006; Kilfoy et al., 2011). Daily intake of nitrate and nitrite was calculated by multiplying the frequency of consumption by the portion size and the nitrate and nitrite content of each food item, and then summing across all food items. Nitrate and nitrite intake from animal sources and plant sources was calculated separately. In addition to examining nitrate and nitrite intake from all animal sources, intake from processed meat sources was examined separately, as were animal sources excluding processed meat (this primarily included intake

Red meat and processed meat
83
from fresh meats, eggs, yogurt, cheese, and other dairy products).
The nitrate and nitrite content of over 3000 foods was determined by conducting a review of the literature, focusing on Canadian and USA foods, and by calculating the means of the published values weighted by the number of samples analysed (Ward et al., 2003, 2006; Kilfoy et al., 2011). The nitrate and nitrite values for foods constituting an FFQ line item were combined by weighting the food-specific values by sex-specific intake amounts from the 1994–1996 Continuing Survey of Food Intakes by Individuals (CSFII) (Subar et al., 2000). For example, the nitrate content of a line item was calculated using the weighted average of the nitrate content of the included foods, where the weights were deter-mined by intake amounts from the CSFII, based on age group and sex. Daily intake of nitrate and nitrite was calculated by multiplying the frequency of consumption of each line item by its nitrate or nitrite content and summing over line items. In addition to calculating nitrate and nitrite intake from all foods, nitrite intake from plant, animal, and processed meat sources was calculated separately.
(c) Heterogeneity across studies
There was substantial heterogeneity across the studies included in this Monograph due to a variety of factors, such as different methods of dietary assessment and/or measurement, defini-tions (e.g. food groups and serving sizes), analyt-ical categorizations (e.g. servings/week and g/day), exposure contrasts (e.g. analytical cut-points and intake level comparisons), and degrees of adjustment for potential confounding factors. Each cohort study included in this Monograph is described in Section 2. The strengths and limitations of the questionnaires used in studies included in this Monograph are outlined below.
(d) Cohort studies
A major strength of cohort studies in nutri-tional epidemiology is their ability to demon-strate a temporal relationship between dietary exposure and cancer risk, as all dietary assess-ments are completed before diagnoses. This limits difficulties with recall bias and reverse causation.
Wei et al. (2004) used a validated, self-ad-ministered, 61-item SQFFQ at baseline in 87 733 women from the NHS and a validated, self-ad-ministered, 131-item SQFFQ in 46 632 men from the HPFS. The study had several strengths. For example, the FFQs used were extensively vali-dated and tested for reproducibility using data collected from a subgroup of participants who completed two FFQs (1 year apart) and two 1-week diet records (6 months apart during the intervening year). The association between base-line meat intake and cancer risk was assessed in this study, and red meat intake was clearly defined as the consumption of beef, pork, or lamb as a main dish. In addition, in this combined cohort of women and men, risk estimates were adjusted using a multivariate model that included impor-tant confounders (age; family history; body mass index, BMI; physical activity; beef, pork, or lamb as a main dish; processed meat; alcohol; calcium; folate; height; smoking pack-years before aged 30 years; history of endoscopy; and sex). A limi-tation of this study was the quantification of red meat in servings per day only (i.e. not in g/day).
In the Physicians’ Health Study (PHS), Chen et al. (1998) used a nested case–control design to assess the relationship between red meat intake and colorectal cancer by N-acetyltransferase (NAT) genotype. The study included 212 men who were recruited as part of the Physicians’ Health Study and were subsequently diagnosed with colorectal cancer or rectal cancer during 13 years of follow-up and were genotyped via baseline blood sample, along with 221 controls. At baseline, participants completed an abbre-viated, self-administered FFQ, which inquired

IARC MONOGRAPHS – 114
84
about usual consumption of red meat (beef, pork, or lamb as a main dish, as a mixed dish or sandwich, and as hot dogs), chicken, and fish. The abbreviated FFQ used in this study was not validated, but an expanded form of this FFQ was validated among other male health professionals. There were some limitations to this study, as the use of an abbreviated FFQ (with fewer food items listed) prevented the adjustment of risk estimates for total energy intake. In addition, dietary intake of processed meat was included with red meat intake, and meat intake was assessed as servings per day only (i.e. not in g/day).
Dietary assessment in the NIH-AARP Diet and Health Study was described in detail by Cross et al. (2010). The study included approx-imately half a million women and men, each of whom completed a validated, self-adminis-tered, 124-item FFQ at baseline. Approximately 6 months later, cancer-free participants were mailed a risk factor questionnaire, which detailed information on meat intake and cooking pref-erences. Meat cooking method (grilled/barbe-cued, pan-fried, microwaved, and broiled) and doneness level (well done/very well done and medium/rare) were used in conjunction with the CHARRED database to estimate the intake of several HAAs. The FFQ assessed the usual frequency of consumption and portion size information of foods and drinks over the past 12 months. All types of beef, pork, and lamb were considered red meat, including bacon, beef, cold cuts, ham, hamburger, hot dogs, liver, pork, sausage, and steak. Processed meat included bacon, cold cuts (red and white meat), ham, luncheon meats (red and white meat), poultry sausage, red meat sausage, and standard hot dogs and low-fat hot dogs made from poultry. Meats added to complex food mixtures, such as pizza, chilli, lasagne, and stew, contributed to the relevant meat type. There were many notable strengths to this study. Several of these strengths were related to the FFQ, which not only contained detailed questions pertaining to the components
of meat, but also was calibrated within this study population using two non-consecutive 24-hour dietary recalls. However, there was overlap in the definitions of red meat and processed meat, as some processed meat items were classified as red meat.
In the EPIC study (Norat et al., 2005), dietary intake over the 12 months before enrolment was measured by country-specific, validated dietary questionnaires (88–266 food items, depending on the country), which were self-administered in most countries; in Malmö, Sweden, a question-naire combined with a food record was used. A second dietary measurement was taken from an 8% random sample of the cohort (36 994 partic-ipants) using a computerized 24-hour dietary recall method to calibrate dietary measurements across countries and to correct for systematic over- or underestimation of dietary intake. The major strengths of this study were the large vari-ability in dietary intake across the population and the use of a computerized 24-hour dietary recall method to calibrate dietary measurements across countries.
In the Alpha-Tocopherol, Beta-Carotene Cancer Prevention (ATBC) Study, researchers used a self-administered, modified dietary history method to capture usual dietary intake 12 months before recruitment. The dietary history method included 276 food items and a portion size booklet of 122 photographs of foods, each with 3–5 different portion sizes. Red meat intake was defined as intake of beef, pork, or lamb (Pietinen et al., 1999). A major strength of this study was the use of a detailed questionnaire.
In the Multiethnic Cohort Study, Ollberding et al. (2012) assessed diet using a validated quantitative FFQ, which included a list of foods identified from 3-day measured food records, to capture 85% or more of the intake of key nutri-ents and food items traditionally consumed by the populations represented in the cohort. The definition of meat intake was clearly defined as total meat, red meat, and processed meat. Risk

Red meat and processed meat
85
estimates were adjusted for important potential confounders, including energy intake. This study had many strengths, including a large variability in diet due to the inclusion of multiple ethnicities and the use of an extensive dietary questionnaire.
The PLCO Cancer Screening Trial (Ferrucci et al., 2009) used an NCI DHQ to assess usual intake (both frequency and portion size) of 124 food items over the past year. The definition of red meat (g/day) included bacon, beef, cheese-burger, cold cuts, ham, hamburger, hot dogs, liver, pork, sausage, veal, venison, and red meat from mixed dishes. Processed meat included bacon, cold cuts, ham, hot dogs, and sausage. However, a limitation of this study was the clear overlap in the definitions of red meat and processed meat, as some processed meat items were classified as red meat.
Flood et al. (2003) used a 62-item NCI Block FFQ in the Breast Cancer Detection Demonstration Project (BCDDP) to assess red meat intake in the previous year. A limitation of this study was the combined estimate of exposure to meat, which included pork, beef, hamburger, processed meat, and liver, so risk estimates for red meat alone or processed meat alone were not possible. As the cohort was generated based on a screening programme, participants may have changed their dietary habits before baseline, and recorded intake may therefore not have accu-rately reflected long-term intake.
Singh & Fraser (1998) assessed dietary intake in the Adventists Health Study cohort using a self-administered, mailed, 55-item SQFFQ. The SQFQQ included just six questions regarding red meat intake, defined as current intake of beef or pork. A limitation of this study was the relatively short dietary questionnaire in a low-risk popula-tion, with low red meat consumption.
In the New York University Women’s Health Study, Kato et al. (1997) assessed red meat intake using a 70-item FFQ, which was slightly modi-fied from the questionnaire designed by Block and coworkers (Block et al., 1986). However, the
FFQ was not very extensive, and there were no quantitative data on red meat intake provided. It is also unclear whether intake of red meat included processed meat.
A study by Tiemersma et al. (2002) in the Netherlands examined the association between meat intake and cancer risk using a nested case–control design. A strength of this study was the use of an SQFFQ, which was validated for use through comparison with a dietary history method. A limitation of this study, however, was that a major source of meat in the population (i.e. a mixture of pork and beef) was not captured by the FFQ.
In the Shanghai Women’s Health Study, Lee et al. (2009) assessed dietary intake at base-line using a validated quantitative FFQ, which included 19 food items/groups of animal origin. A major strength of this study was that the FFQ was administered by interview.
In the prospective cohort study of 37 112 residents of Melbourne, Australia, English et al. (2004) assessed dietary intake using a 124-item FFQ. They also provided a clear definition of what they included in terms of fresh red meat (veal, beef, lamb, pork, rabbit, or other game). A limitation of this study, however, was that portion size was not measured.
In the Iowa Women’s Health Study, (Lee et al., 2005) assessed usual dietary intake over the past year using a validated, 127-item, self-adminis-tered SQFFQ virtually identical to the question-naire used in the 1984 survey of the NHS (Bostick et al., 1994). Red meat was defined as beef, pork, or lamb as a main dish. This study had several strengths, including assessment of reliability and accuracy of the FFQ used, which was comparable to what was observed in the NHS. The exten-sive FFQ allowed for multivariable adjustment, including age, total energy intake, height, parity, total vitamin E intake, interaction term vitamin E *age, and vitamin A supplement use.

IARC MONOGRAPHS – 114
86
(e) Case–control studies
A description of the case–control studies included in this Monograph is provided in Section 2. Case–control studies investigating the association between meat intake and cancer risk are limited, as they assess dietary intake after cancer has been diagnosed, which can lead to recall bias. In addition, patients often change their dietary intake due the presence of a solid tumour to avoid pain or reflux, for example. As a result, investigators usually ask cases included in their studies to recall dietary intake in the period before diagnosis of cancer to capture usual diet before diagnosis. As a result, case–control studies are limited due to the measurement error asso-ciated with dietary intake due to memory recall. Tavani et al. (2000), for example, assessed total red meat intake (beef, veal, and pork) per week 2 years before diagnosis, while Chiu et al. (2003) assessed dietary intake 5 years before diagnosis in a case–control study in Shanghai.
In the North Carolina Colon Cancer Study, Butler et al. (2003) assessed usual diet in the year before diagnosis for patients, or the year before the date of selection for controls, using a 150-item FFQ, which was a modified version of the Block questionnaire. However, no informa-tion regarding validation was provided. Red meat intake was calculated as the sum of hamburger, steak, pork chop, sausage, and bacon intake.
(f) Conclusion
As outlined in this section, the question-naires used in the cohort and case–control studies varied in several ways, including in the methods of dietary assessment and/or measure-ment, the use of validated/calibrated question-naires, the definitions of meat and processed meat as food groups, the inclusion of serving or portion sizes, the ability to assess intake (i.e. in g/day), and the degree of adjustment for poten-tial confounding factors.
1.4.2 Biological markers
Despite more than 35 years of research, no long-term validated biomarkers of exposure have been employed in molecular epidemi-ology studies to assess the role of genotoxicants in cooked or processed meat and cancer risk. Additionally, other than HAAs, the biomarkers of PAHs or NOCs are not specific to meat, as they may also measure environmental or endog-enous exposure.
[The Working Group noted that short-lived biomarkers, including urinary metabolites and DNA adducts of meat-related genotoxi-cants, exist; however, they cannot be used as biomarkers of exposure in epidemiological studies, and do not belong in this section (see Section 4 for details).]
The accumulation of PhIP in hair may represent the first long-term biomarker of HAA exposure in cooked meats, although this biomarker is a measure of the unmetabolized chemical and not the biologically effective dose. Harmonization of the method across laborato-ries is required for validation and implementa-tion in epidemiological studies.
Recent studies of omnivores have used metabolomics to identify constituents of meat in plasma and urine to measure meat consump-tion. Metabolomics is still a developing tech-nology. It employs liquid chromatography-mass spectrometry (LC-MS)–based methods to iden-tify the constituents or chemicals present in cooked or processed meat, and may provide reli-able assessment of dietary habits and patterns of meat consumption in the future.
Data on the most promising biomarkers of exposure for red meat and processed meat consumption in epidemiological studies are summarized in Section 1.4.2(a) and (b).

Red meat and processed meat
87
(a) Hair biomarkers
Gas chromatography-mass spectrometry (GC-MS) with negative ion chemical ioniza-tion or liquid chromatography-tandem mass spectrometry (LC-MS/MS) with triple quadru-pole-mass spectrometry (TQ-MS) instruments have been employed to measure PhIP in the hair of subjects in European countries (Alexander et al., 2002), Japan (Kobayashi et al., 2005; Kobayashi et al., 2007; Iwasaki et al., 2014), and the USA (Bessette et al., 2009; Turesky et al., 2013). PhIP was identified in the hair of omni-vores, but not in the hair of vegetarians (Bessette et al., 2009). The binding of PhIP to hair is strongly driven by melanin content, and binding levels of PhIP in hair should be normalized to melanin content (Bessette et al., 2009; Turesky et al., 2013). Turesky et al. (2013) observed that, after being fed a semicontrolled diet, levels of PhIP in the hair of volunteers increased in an exposure-dependent manner. Levels of PhIP in hair were stable over time, varying in two meat eaters by less than 24% over a 6-month interval (Turesky et al., 2013). In another study, levels of PhIP in the hair of Japanese subjects were corre-lated with grilled/stir-fried meat intake, but not with grilled/stir-fried fish intake (Kobayashi et al., 2005). Levels of PhIP were further corre-lated with dietary HAA intake, according to an FFQ (Kobayashi et al., 2007). Since the binding of PhIP to hair is largely influenced by pigmentation, the biomonitoring of PhIP in an older population with predominantly white hair may be difficult. Moreover, because the growth cycles of individual hair follicles are asynchronous across the scalp, hair samples should be consistently collected from the same area of the scalp for comparison of PhIP levels in the hair of individuals (Bessette et al., 2009; Turesky et al., 2013). Despite these limitations, biomonitoring of PhIP levels in hair is the first biomarker for assessing long-term exposure to this cooked meat carcinogen. Other HAAs bind
less efficiently to hair, and exposure cannot be assessed with hair (Bessette et al., 2009; Iwasaki et al., 2014).
There are reports on the measurement by GC-NICI/MS of hydroxylated PAHs, including naphthalene and pyrene, in the hair of subjects (Schummer et al., 2009; Appenzeller et al., 2012; Appenzeller & Tsatsakis, 2012). Using hair to assess exposure to PAHs through meat consump-tion is challenging because of the multiple sources of exposure to PAHs and the low levels of hydroxylated PAHs in hair.
(b) Urinary and plasma biomarkers
Targeted approaches have been used to measure different procarcinogens, their metab-olites, and DNA adducts in urine. More recently, untargeted metabolomics approaches have been used to understand dietary patterns of meat consumption, to strengthen self-administered FFQs.
(i) Metabolomics: nutrients and secondary or indirect biomarkers
Plasma and urine from subjects on different diets have been characterized by proton nuclear magnetic resonance, GC-MS, and LC-MS tech-niques, and hundreds of chemicals have been identified (Puiggròs et al., 2011; Hedrick et al., 2012; Scalbert et al., 2014).
Correlations were observed among chem-ical biomarkers of red meat, shellfish, fish, other food components, multivitamins, and diets, in plasma (Guertin et al., 2014). Several biomarkers in urine correlated to meat intake included: creatine, creatinine, carnitine, carnosine, ophi-dine, 1-methylhistidine, and 1-methylhistidine and 3-methylhistidine (Dragsted, 2010; Puiggròs et al., 2011).
In a urinary metabolomic study employing LC-MS, 3-indoleacetyl-glucuronide, a micro-biome metabolite of tryptophan, which is found at high concentrations in animal protein, was identified, possibly reflecting differences in the

IARC MONOGRAPHS – 114
88
protein sources between the diets (Andersen et al., 2014). Indole propionate was also identified as a potential biomarker of red meat in plasma (Guertin et al., 2014). Indoles are metabolites of tryptophan that are largely produced by the bacterial flora; however, they are not specific to meat, as they are also found in high amounts in soya and eggs (Guertin et al., 2014).
(ii) Urinary 1-methylhistidine, 3-methylhistidine, creatinine, and taurine
There were marked differences between the proton nuclear magnetic resonance spectra of high–red meat, low–red meat, and vegetarian diets, which included elevated urinary levels of creatinine, taurine, carnitine, trimethyl-amine-N-oxide, and methylhistidine in the high–red meat group. However, the spectral changes differentiating the low–red meat and vegetarian groups were subtle. The urinary metabolite trimethylamine-N-oxide, a product formed from carnitine by the bacterial microbiota, was associ-ated with meat intake, but it is also a biomarker of fish intake, and may confound the interpreta-tion of meat consumption patterns (Stella et al., 2006).
In another controlled meat-feeding study, the urinary excretion of creatinine, taurine, 1-methylhistidine, and 3-methylhistidine was investigated in individuals who consumed various amounts of red meat: vegetarian (0 g/day), low red meat (60 g/day), medium red meat (120 g/day), and high red meat (420 g/day) (Cross et al., 2011). All components demon-strated a significant dose–response relationship, increasing as red meat intake increased (Ptrend < 0.0001). There were significant differences in the mean levels of 1-methylhistidine and 3-methyl-histidine across the four dietary intake groups (P < 0.01 and P < 0.05, respectively). However, taurine and creatinine levels in the vegetarian and low–red meat intake groups could not be distinguished (P = 0.95 and P = 0.88, respec-tively). 3-Methylhistidine and creatinine are
formed during muscle catabolism, thus lack specificity for meat intake. 1-Methylhistidine has also been found in the urine of subjects on a fish diet (Lloyd et al., 2011). Another study reported that the mean urinary levels of 1-methylhisti-dine and 3-methylhistidine did not differ among 131 colorectal adenoma and control subjects (P = 0.72) (Cross et al., 2014). Thus, methyl-histidine may not be a good indicator of meat processing conditions, and the levels of methyl-histidine present in meat may not correlate to the levels of procarcinogens formed in cooked or processed meat.
To date, there are no chemical markers or metabolites of meat constituents that can provide information on the methods of meat processing and cooking that produce carcinogens.
1.5 Regulations and guidelines
In many countries, the production of red meat and processed meat is subject to stringent regulations. These regulations are primarily intended to prevent infectious diseases and minimize contamination of the meat prod-ucts. Under the auspices of WHO and FAO, the Codex Alimentarius was established to provide international food standards, guidelines, and codes of practice to protect and promote safety, quality, and fairness in the international food trade (Codex Alimentarius, 2015). The scope of standards issued by the Codex Alimentarius is illustrative of standards and regulatory meas-ures typically issued on a national basis for the maintenance of food safety in relation to meat products (Table 1.18).
An exhaustive list of all regional and national food authorities is not provided here, but a summary of those operating in Europe and the USA is provided.
EFSA (EFSA, 2015) is the EU risk assessment authority for food and feed safety. For red meat and processed meat, relevant EFSA panels or units include animal health and welfare, biological

Red meat and processed meat
89
monitoring, contaminants, and assessment and methodological support.
In the USA, the relevant statutory authority for safety in relation to meat products is the United States Department of Agriculture (Department of Agriculture, 2015). The United States Food and Drug Administration (FDA) is responsible for regulating chemicals authorized in meat. A range of guidance documents and regulations are issued by this administration (FDA, 2015).
1.5.1 Prevention of infectious disease
The broad issues addressed by food safety regulations have been summarized by Henson & Caswell (1999), and include new potential food-borne risks, such as bovine spongiform enceph-alopathy and genetically modified organisms, as well as recognized risks posed by well-char-acterized bacteria. The scientific rationale for food safety regulations involves risk assessment, management, and communication.
For meat products, the regulations aim to decrease contamination by microbial pathogens (e.g. Listeria monocytogenes, Escherichia coli, and Salmonella) by minimizing cross-contamination
of other foods and water with enteric pathogens of animal origin (Sofos, 2008).
Many countries approach food safety, specif-ically in relation to meat production, through compliance with hazard analysis and critical control point (HACCP)-based regulations; HACCP is a safety and quality management tool (Hudson et al., 1996).
1.5.2 Prevention of contamination
(a) Red meat
Red meat may contain residues from veter-inary drugs. These compounds are generally regulated at the national level, but 67 of them are regulated by international standards (i.e. maximum residue limits, MRLs) established by the Codex Alimentarius (2015). There is currently no international monitoring of the frequency of use of these chemicals.
Red meat is usually free of additives. However, in certain circumstances, colours are used for certification stamps on the surfaces of fresh cuts of meat, and are indicated in the food category system with a notation for “stamping, marking or branding the product” (Codex Alimentarius, 2016a).
Table 1.18 Examples of meat-related food safety standards issued by Codex Alimentarius
Reference Standard Committee Last modified
CAC/GL 14-1991 Guide for the Microbiological Quality of Spices and Herbs Used in Processed Meat and Poultry Products
CCPMPP 1991
CAC/GL 78-2011 Guidelines for the Control of Campylobacter and Salmonella in Chicken Meat
CCFH 2011
CAC/GL 85-2014 Guidelines for the Control of Taenia saginata in Meat of Domestic Cattle CCFH 2014CAC/GL 86-2015 Guidelines for the Control of Trichinella spp. in Meat of Suidae CCFH 2015CAC/GL 87-2016 Guidelines for the Control of Nontyphoidal Salmonella spp. in Beef and
Pork MeatCCFH 2016
CAC/RCP 58-2005 Code of Hygienic Practice for Meat CCMPH 2005CODEX STAN 89-1981 Standard for Luncheon Meat CCPMPP 2015CODEX STAN 98-1981 Standard for Cooked Cured Chopped Meat CCPMPP 2015CCFH, Codex Committee on Food Hygiene; CCMPH, Codex Committee on Meat Hygiene; CCPMPP, Codex Committee on Processed Meat and Poultry ProductsFrom Codex Alimentarius (2016a)
IARC MONOGRAPHS – 114
90
Red meat may also contain chemicals present in the environment or used in the production of feed-like pesticide residues. When there is sufficient scientific information available about a chemical, the Joint FAO/WHO Expert Committee defines its acceptable daily intake (ADI), which is the amount of chemical, expressed based on body weight, that can be ingested over a lifetime without appreciable health risks. From the ADI, the Codex Alimentarius Commission establishes an MRL per kilogram of food that is recommended as being legally acceptable. The Codex Alimentarius Commission does not estab-lish an MRL for a chemical if dietary exposure is above the ADI. Furthermore, no MRL is estab-lished if a chemical is assessed to be a genotoxic carcinogen in humans (Codex Alimentarius, 2015). MRLs have been established by the Codex Alimentarius for several pesticide residues possibly occurring in meat (Codex Alimentarius, 2016b). Most of these limits were established at the limit of detection of the analytical method.
Other chemical contaminants present in the environment, such as heavy metals or persistent organic pollutants, may also occur in red meat. Some of these contaminants are regulated inter-nationally by the Codex Alimentarius. WHO/GEMS has collected national monitoring data on 145 environmental contaminants (WHO, 2015b). Moreover, the Codex Alimentarius has adopted codes of practice to reduce food and feed contamination by lead (Codex Alimentarius, 2004), by dioxin and dioxin-like PCBs (Codex Alimentarius, 2006), and by PAHs (Codex Alimentarius, 2009).
(b) Processed meat
National regulations are in place for processed meat in many countries around the world, e.g. in the USA (Office of the Federal Register, 2015). In Europe, the European Parliament and the Council of the EU define a “meat product” in Annex I to Regulation (EC) No 853/2004. The annex states that “meat products” means processed products
resulting from the processing of meat or from the further processing of such processed products, so that the cut surface shows that the product no longer has the characteristics of fresh meat” (European Commission, 2004).
At the international level, there is currently no active committee of the Codex Alimentarius to deal with meat (abolished in 1971) or processed meat (abolished in 1990), and the international standards for meat products are established by horizontal committees (e.g. committees for food additives, contaminants, or pesticide residues). In addition to the chemicals possibly present in meat in general, processed meat may contain food additives. However, many of these food additives, such as nitrites (80 mg/kg), colouring agents such as erythrosine (30 mg/kg), and antioxidants including butylated hydroxytoluene (100 mg/kg) are regulated by international standards estab-lished by the Codex Alimentarius (2016a).
References
Afshin A, Micha R, Khatibzadeh S, Fahimi S, Shi P, Powles J et al.; 2010 Global Burden of Diseases, Injuries, and Risk Factors Study: NUTRItrition and ChrOnic Diseases Expert Group (NUTRICODE), and Metabolic Risk Factors of ChrOnic Diseases Collaborating Group(2015). The impact of dietary habits and meta-bolic risk factors on cardiovascular and diabetes mortality in countries of the Middle East and North Africa in 2010: a comparative risk assessment analysis. BMJ Open, 5(5):e006385 doi:10.1136/bmjopen-2014-006385 PMID:25995236
AFSSA (2005). Avis de l’Agence française de sécurité sani-taire des aliments relatif à l’évaluation de l’exposition de la population française aux dioxines, furanes et PCB de type dioxine. Saisine No.2005-SA-0372. Maisons-Alfort, France: l’Agence française de sécurité sanitaire des aliments. [French]
Alaejos MS, Afonso AM (2011). Factors that affect the content of heterocyclic aromatic amines in foods. Comp Rev Food Sci Food Safe, 10(2):52–108. doi:10.1111/j.1541-4337.2010.00141.x
Alexander J, Reistad R, Hegstad S, Frandsen H, Ingebrigtsen K, Paulsen JE et al. (2002). Biomarkers of exposure to heterocyclic amines: approaches to
Red meat and processed meat
91
improve the exposure assessment. Food Chem Toxicol, 40(8):1131–7. doi:10.1016/S0278-6915(02)00053-4 PMID:12067575
Alomirah H, Al-Zenki S, Al-Hooti S, Zaghloul S, Sawaya W, Ahmed N et al. (2011). Concentrations and dietary exposure to polycyclic aromatic hydrocarbons (PAHs) from grilled and smoked foods. Food Contr, 22(12):2028–35. doi:10.1016/j.foodcont.2011.05.024
American Institute for Cancer Research/World Cancer Research Fund (1997). Food, nutrition, and the preven-tion of cancer: a global perspective. Washington (DC), USA: American Institute for Cancer Research.
Andersen MB, Rinnan Å, Manach C, Poulsen SK, Pujos-Guillot E, Larsen TM et al. (2014). Untargeted metab-olomics as a screening tool for estimating compliance to a dietary pattern. J Proteome Res, 13(3):1405–18. doi:10.1021/pr400964s PMID:24444418
ANSES (2011). Etude de l’alimentation totale française 2 (EAT 2). Avis de l’ANSES, rapport d’expertise. Résidus de pesticides, additifs, acrylamide, hydrocarbures aromatiques polycycliques. Maisons-Alfort, France: Agence nationale de sécurité sanitaire de l’alimenta-tion, de l’environnement et du travail. [French]
ANSES (2012). Avis de l’Agence nationale de sécurité sani-taire de l’alimentation, de l’environnement et du travail relatif aux analyses de retardateurs de flamme bromés (RFB) à mettre en œuvre dans le cadre des prochains plans de surveillance. Avis de l’Anses - Saisine No. 2010-SA-0225. Maisons-Alfort, France: Agence nationale de sécurité sanitaire de l’alimentation, de l’environnement et du travail. [French]
Appenzeller BM, Mathon C, Schummer C, Alkerwi A, Lair ML (2012). Simultaneous determination of nicotine and PAH metabolites in human hair specimen: a potential methodology to assess tobacco smoke contribution in PAH exposure. Toxicol Lett, 210(2):211–9. doi:10.1016/j.toxlet.2011.11.022 PMID:22155355
Appenzeller BM, Tsatsakis AM (2012). Hair analysis for biomonitoring of environmental and occupational exposure to organic pollutants: state of the art, critical review and future needs. Toxicol Lett, 210(2):119–40. doi:10.1016/j.toxlet.2011.10.021 PMID:22079616
Asgar MA, Fazilah A, Huda N, Bhat R, Karim AA (2010). Nonmeat protein alternatives as meat extenders and meat analogs. Comp Rev Food Sci Food Safe, 9(5):513–29. doi:10.1111/j.1541-4337.2010.00124.x
Awadt WA, Ghareeb K, Bohm J (2012). Occurrence, health risks and methods of analysis for aflatoxins and ochra-toxin A. J Vet. Anim Sci, 2(1):1–10.
Back YM, Lee JH, Shin HS, Lee KG (2009). Analysis of heterocyclic amines and beta-carbolines by liquid chromatography–mass spectrometry in cooked meats commonly consumed in Korea. Food Addit Contam Part A Chem Anal Control Expo Risk Assess, 26(3):298–305. doi:10.1080/02652030802526834 PMID:19680902
Balogh Z, Gray JI, Gomaa EA, Booren AM (2000). Formation and inhibition of heterocyclic aromatic amines in fried ground beef patties. Food Chem Toxicol, 38(5):395–401. doi:10.1016/S0278-6915(00)00010-7 PMID:10762724
Barnes K, Collins T, Dion S, Reynolds H, Riess H, Stanzyk A et al. (2012). Importance of cattle biodiversity and its influence on the nutrient composition of beef. Anim Front, 2(4):54–60. doi:10.2527/af.2012-0062
Bax ML, Aubry L, Ferreira C, Daudin JD, Gatellier P, Rémond D et al. (2012). Cooking temperature is a key determinant of in vitro meat protein digestion rate: investigation of underlying mechanisms. J Agric Food Chem, 60(10):2569–76. doi:10.1021/jf205280y PMID:22335241
Bax ML, Buffière C, Hafnaoui N, Gaudichon C, Savary-Auzeloux I, Dardevet D et al. (2013). Effects of meat cooking, and of ingested amount, on protein digestion speed and entry of residual proteins into the colon: a study in minipigs. PLoS One, 8(4):e61252 doi:10.1371/journal.pone.0061252 PMID:23593443
Beaton GH (1994). Approaches to analysis of dietary data: relationship between planned analyses and choice of methodology. Am J Clin Nutr, 59(1):Suppl: 253S–61S. PMID:8279436
Bender A (1992). Meat and meat products in human nutrition in developing countries. Food & Nutrition Paper (Vol. 53). Rome, Italy: Food and Agriculture Organization of the United Nations. Available from: http://www.fao.org/docrep/T0562E/T0562E00.HTM
Bessette EE, Yasa I, Dunbar D, Wilkens LR, Le Marchand L, Turesky RJ (2009). Biomonitoring of carcinogenic heterocyclic aromatic amines in hair: a validation study. Chem Res Toxicol, 22(8):1454–63. doi:10.1021/tx900155f PMID:19588936
Bingham SA, Day NE (1997). Using biochemical markers to assess the validity of prospective dietary assessment methods and the effect of energy adjustment. Am J Clin Nutr, 65(4):Suppl: 1130S–7S. PMID:9094909
Block G, Hartman AM, Dresser CM, Carroll MD, Gannon J, Gardner L (1986). A data-based approach to diet questionnaire design and testing. Am J Epidemiol, 124(3):453–69. PMID:3740045
Block G, Woods M, Potosky A, Clifford C (1990). Validation of a self-administered diet history questionnaire using multiple diet records. J Clin Epidemiol, 43(12):1327–35. doi:10.1016/0895-4356(90)90099-B PMID:2254769
Bostick RM, Potter JD, Kushi LH, Sellers TA, Steinmetz KA, McKenzie DR et al. (1994). Sugar, meat, and fat intake, and non-dietary risk factors for colon cancer incidence in Iowa women (United States). Cancer Causes Control, 5(1):38–52. doi:10.1007/BF01830725 PMID:8123778
Braekevelt E, Lau BP, Tague B, Popovic S, Tittlemier SA (2011). Effect of cooking on concentrations of β-es-tradiol and metabolites in model matrices and beef.

IARC MONOGRAPHS – 114
92
J Agric Food Chem, 59(3):915–20. doi:10.1021/jf103064q PMID:21218831
Brink M, Weijenberg MP, de Goeij AF, Roemen GM, Lentjes MH, de Bruïne AP et al. (2005). Meat consumption and K-ras mutations in sporadic colon and rectal cancer in The Netherlands Cohort Study. Br J Cancer, 92(7):1310–20. doi:10.1038/sj.bjc.6602491 PMID:15812479
Butler LM, Sinha R, Millikan RC, Martin CF, Newman B, Gammon MD et al. (2003). Heterocyclic amines, meat intake, and association with colon cancer in a popu-lation-based study. Am J Epidemiol, 157(5):434–45. doi:10.1093/aje/kwf221 PMID:12615608
Caan BJ, Slattery ML, Potter J, Quesenberry CPJ Jr, Coates AO, Schaffer DM (1998). Comparison of the Block and the Willett self-administered semiquan-titative food frequency questionnaires with an inter-viewer-administered dietary history. Am J Epidemiol, 148(12):1137–47. doi:10.1093/oxfordjournals.aje.a009598 PMID:9867257
Cantwell M, Mittl B, Curtin J, Carroll R, Potischman N, Caporaso N et al. (2004). Relative validity of a food frequency questionnaire with a meat-cooking and heterocyclic amine module. Cancer Epidemiol Biomarkers Prev, 13(2):293–8. doi:10.1158/1055-9965.EPI-270-2 PMID:14973110
Carroll RJ, Freedman LS, Kipnis V, Li L (1998). A new class of measurement-error models, with appli-cations to dietary data. Can J Stat, 26(3):467–77. doi:10.2307/3315770
Chattopadhyay MK (2014). Use of antibiotics as feed addi-tives: a burning question. Front Microbiol, 5(334):334 PMID:25071747
Chen BH, Lin YS (1997). Formation of polycyclic aromatic hydrocarbons during processing of duck meat. J Agric Food Chem, 45(4):1394–403. doi:10.1021/jf9606363
Chen G, Smith JS (2015). Determination of advanced glycation endproducts in cooked meat products. Food Chem, 168:190–5. doi:10.1016/j.foodchem.2014.06.081 PMID:25172699
Chen J, Stampfer MJ, Hough HL, Garcia-Closas M, Willett WC, Hennekens CH et al. (1998). A prospective study of N-acetyltransferase genotype, red meat intake, and risk of colorectal cancer. Cancer Res, 58(15):3307–11. PMID:9699660
Chiu BC, Ji BT, Dai Q, Gridley G, McLaughlin JK, Gao YT et al. (2003). Dietary factors and risk of colon cancer in Shanghai, China. Cancer Epidemiol Biomarkers Prev, 12(3):201–8. PMID:12646508
Codex Alimentarius (2004). Code of practice for the prevention and reduction of lead contamination in foods (CAC/RCP 56-2004). Rome, Italy: World Health Organization/Food and Agriculture Organization of the United Nations. Available from: http://www.codexalimentarius.org/download/standards/10099/CXP_056e.pdf
Codex Alimentarius (2006). Code of practice for the reduction of dioxin and dioxin-like PCB contam-ination in foods and feeds (CAC/RCP 62-2006). Rome, Italy: World Health Organization/Food and Agriculture Organization of the United Nations. Available from: http://www.codexalimentarius.org/download/standards/10693/CXP_062e.pdf
Codex Alimentarius (2009). Code of practice for the reduction of contamination of food with polycy-clic aromatic hydrocarbons (PAH) from smoking and direct drying processes (CAC/RCP 68-2009). Rome, Italy: World Health Organization/Food and Agriculture Organization of the United Nations. Available from: http://www.codexalimentarius.org/download/standards/11257/CXP_068e.pdf
Codex Alimentarius (2015). International food standards. Maximum residue limits (MRLs) and risk management recommendations (RMRs) for residues of veterinary drugs in foods. CAC/MRL 2-2015. Updated at the 38th Session of the Codex Alimentarius Commission (July 2015). Rome, Italy: World Health Organization/Food and Agriculture Organization of the United Nations. Available from: http://fao.org/input/download/standards/45/MRL2_2015e.pdf
Codex Alimentarius (2016a). General standard for food additives. Codex STAN 192-1995. Adopted in 1995. Revised in 2016. Rome, Italy: World Health Organization/Food and Agriculture Organization of the United Nations. Available from: www.fao.org/gsfaonline/docs/CXS_192e.pdf
Codex Alimentarius (2016b). Pesticide residues in food and feed. Codex pesticides residues in food online database. Rome, Italy: World Health Organization/Food and Agriculture Organization of the United Nations. Available from: http://www.fao.org/fao-who-codexalimentarius/codex-texts/dbs/pestres/en/
Cross AJ, Ferrucci LM, Risch A, Graubard BI, Ward MH, Park Y et al. (2010). A large prospective study of meat consumption and colorectal cancer risk: an investiga-tion of potential mechanisms underlying this associa-tion. Cancer Res, 70(6):2406–14. doi:10.1158/0008-5472.CAN-09-3929 PMID:20215514
Cross AJ, Major JM, Rothman N, Sinha R (2014). Urinary 1-methylhistidine and 3-methylhistidine, meat intake, and colorectal adenoma risk. Eur J Cancer Prev, 23(5):385–90. doi:10.1097/CEJ.0000000000000027 PMID:24681531
Cross AJ, Major JM, Sinha R (2011). Urinary biomarkers of meat consumption. Cancer Epidemiol Biomarkers Prev, 20(6):1107–11. doi:10.1158/1055-9965.EPI-11-0048 PMID:21527577
Cross AJ, Peters U, Kirsh VA, Andriole GL, Reding D, Hayes RB et al. (2005). A prospective study of meat and meat mutagens and prostate cancer risk. Cancer Res, 65(24):11779–84. doi:10.1158/0008-5472.CAN-05-2191 PMID:16357191

Red meat and processed meat
93
De Mey E, De Klerck K, De Maere H, Dewulf L, Derdelinckx G, Peeters MC et al. (2014). The occurrence of N-nitrosamines, residual nitrite and biogenic amines in commercial dry fermented sausages and evaluation of their occasional relation. Meat Sci, 96(2 Pt A):821–8. doi:10.1016/j.meatsci.2013.09.010 PMID:24200576
De Mey E, De Maere H, Paelinck H, Fraeye I (2015). Volatile N-nitrosamines in meat products: potential precursors, influence of processing and mitigation strategies. Crit Rev Food Sci Nutr, 57(13):2909–2923 doi:10.1080/10408398.2015.1078769 PMID:26528731
Dellavalle CT, Daniel CR, Aschebrook-Kilfoy B, Hollenbeck AR, Cross AJ, Sinha R et al. (2013). Dietary intake of nitrate and nitrite and risk of renal cell carcinoma in the NIH-AARP Diet and Health Study. Br J Cancer, 108(1):205–12. doi:10.1038/bjc.2012.522 PMID:23169285
Dennis MJ, Massey RC, McWeeny DJ, Knowles ME, Watson D (1983). Analysis of polycyclic aromatic hydrocarbons in UK total diets. Food Chem Toxicol, 21(5):569–74. doi:10.1016/0278-6915(83)90142-4 PMID:6686183
Department of Agriculture (2015). Federal Meat Inspection Act. Washington (DC), USA: United States Department of Agriculture, Food Safety and Inspection Service. Available from: http://www.fsis.usda.gov/wps/portal/fsis/topics/rulemaking/federal-meat-inspection-act
Dixon LB, Balder HF, Virtanen MJ, Rashidkhani B, Männistö S, Krogh V et al. (2004). Dietary patterns associated with colon and rectal cancer: results from the Dietary Patterns and Cancer (DIETSCAN) Project. Am J Clin Nutr, 80(4):1003–11. PMID:15447912
Dragsted LO (2010). Biomarkers of meat intake and the application of nutrigenomics. Meat Sci, 84(2):301–7. doi:10.1016/j.meatsci.2009.08.028 PMID:20374789
EFSA (2003). Opinion of the Scientific Panel on Biological Hazards on the request from the Commission related to the effects of nitrites/nitrates on the microbiological safety of meat products. EFSA J, 14:1–31.
EFSA (2004a). Opinion of the Scientific Panel on Contaminants in the Food Chain on a request from the Commission related to aflatoxin B1 as undesirable substance in animal feed. EFSA J., 39:1–27.
EFSA (2004b). Opinion of the Scientific Panel on Contaminants in the Food Chain on a request from the Commission related to deoxynivalenol (DON) as undesirable substance in animal feed. EFSA J., 73:1–41.
EFSA (2004c). Opinion of the Scientific Panel on Contaminants in the Food Chain on a request from the Commission related to zearalenone as undesirable substance in animal feed. EFSA J., 89:1–35.
EFSA (2004d). Opinion of the Scientific Panel on Contaminants in the Food Chain on a request from the Commission related to ochratoxin A (OTA) as undesir-able substance in animal feed. EFSA J., 101:1–36.
EFSA (2005c). Opinion of the Scientific Panel on Contaminants in the Food Chain on a request from
the Commission related to fumonisins as undesirable substances in animal feed. EFSA J., 235:1–32.
EFSA (2007). Opinion of the scientific panel on contamina-tions in the food chain on a request from the European Commission related to hormone residues in bovine meat and meat products. Palma, Italy: European Food Safety Authority. EFSA J. 510:1–62.
EFSA (2008). Polycyclic aromatic hydrocarbons in food. Scientific Opinion of the Panel on Contaminants in the Food Chain. EFSA J, 724:1–114.
EFSA (2011). The EFSA Comprehensive European Food Consumption Database [online database]. Parma, Italy: European Food Safety Authority. Available from: http://www.efsa.europa.eu/en/food-consumption/comprehensive-database, accessed September 2015
EFSA (2012). Cadmium dietary exposure in the European population. EFSA J, 10(1):2551. http://dx.doi.org/10.2903/j.efsa.2012.2551. Available from: www.efsa.europa.eu/efsajournal doi:10.2903/j.efsa.2012.2551
EFSA (2015). European Food Safety Authority [website]. Parma, Italy: European Food Safety Authority. Available from: http://www.efsa.europa.eu/
Egeberg R, Olsen A, Christensen J, Halkjær J, Jakobsen MU, Overvad K et al. (2013). Associations between red meat and risks for colon and rectal cancer depend on the type of red meat consumed. J Nutr, 143(4):464–72. doi:10.3945/jn.112.168799 PMID:23427329
Engel E, Ratel J, Bouhlel J, Planche C, Meurillon M (2015). Novel approaches to improving the chemical safety of the meat chain towards toxicants. Meat Sci, 109:75–85. doi:10.1016/j.meatsci.2015.05.016 PMID:26043665
English DR, MacInnis RJ, Hodge AM, Hopper JL, Haydon AM, Giles GG (2004). Red meat, chicken, and fish consumption and risk of colorectal cancer. Cancer Epidemiol Biomarkers Prev, 13(9):1509–14. PMID:15342453
EPA (2010). An exposure assessment of polybromi-nated diphenyl ethers. Report No. EPA/600/R-08/086F. Washington (DC), USA: National Center for Environmental Assessment, Office of Research and Development, United States Environmental Protection Agency.
European Commission (2003). Regulation (EC) No 1831/2003 of the European Parliament and of the Council of 22 September 2003 on additives for use in animal nutrition. Official Journal of the European Union L, 268:29–43.
European Commission (2004). Regulation (EC) No. 853/2004 of the European Parliament and of the Council of 29 April 2004 laying down specific hygiene rules for food of animal origin. Available from: http://eur-lex.europa.eu/LexUriServ/LexUriServ.do?uri=OJ:L:2004:226:0022:0082:EN:PDF
FAO (2015). Food Balance. FAOSTAT [online database]. Food and Agriculture Organization of the United Nations Statistics Division. Rome, Italy: Food and
IARC MONOGRAPHS – 114
94
Agriculture Organization of the United Nations. Available from: http://faostat3.fao.org/browse/FB/*/E, accessed 9 July 2015
FAO/WHO (2015). The FAO/WHO Chronic individual food consumption database – summary statistics (CIFOCOss). Food and Agriculture Organization of the United Nations/World Health Organization. Available from: http://www.who.int/foodsafety/databases/en/
FCID (2015). What we eat in America - Food commodity intake database 2005-10. Commodity consumption calculator. United States Environmental Protection Agency, Office of Pesticide Programs © University of Maryland 2012-2016. Available from: http://fcid.foodrisk.org/percentiles.php
FDA (2005). Subject: Illegal residues in meat, poultry, seafood, and other animal derived foods. Chapter: Post-approval monitoring of animal drugs, feeds and devices In: Compliance program guidance manual. United States Food and Drug Administration.
FDA (2008). Subject: Mycotoxins in domestic and imported food. Chapter 07: Molecular biology and natural toxins. In: Compliance program guidance manual. United States Food and Drug Administration.
FDA (2015). Guidance and regulation. Washington (DC), USA: United States Department of Agriculture, Food and Drug Administration. Available from: http://www.fda.gov/Food/GuidanceRegulation
Felton JS, Knize MG, Roper M, Fultz E, Shen NH, Turteltaub KW (1992). Chemical analysis, preven-tion, and low-level dosimetry of heterocyclic amines from cooked food. Cancer Res, 52(7):Suppl: 2103s–7s. PMID:1544148
Ferrucci LM, Cross AJ, Graubard BI, Brinton LA, McCarty CA, Ziegler RG et al. (2009). Intake of meat, meat mutagens, and iron and the risk of breast cancer in the Prostate, Lung, Colorectal, and Ovarian Cancer Screening Trial. Br J Cancer, 101(1):178–84. doi:10.1038/sj.bjc.6605118 PMID:19513076
Flood A, Velie EM, Sinha R, Chaterjee N, Lacey JV Jr, Schairer C et al. (2003). Meat, fat, and their subtypes as risk factors for colorectal cancer in a prospective cohort of women. Am J Epidemiol, 158(1):59–68. doi:10.1093/aje/kwg099 PMID:12835287
Fung T, Hu FB, Fuchs C, Giovannucci E, Hunter DJ, Stampfer MJ et al. (2003). Major dietary patterns and the risk of colorectal cancer in women. Arch Intern Med, 163(3):309–14. doi:10.1001/archinte.163.3.309 PMID:12578511
Gibis M, Weiss J (2010). Inhibitory effect of marinades with hibiscus extract on formation of heterocyclic aromatic amines and sensory quality of fried beef patties. Meat Sci, 85(4):735–42. doi:10.1016/j.meatsci.2010.03.034 PMID:20418021
Gibis M, Weiss J (2012). Antioxidant capacity and inhibi-tory effect of grape seed and rosemary extract in mari-nades on the formation of heterocyclic amines in fried
beef patties. Food Chem, 134(2):766–74. doi:10.1016/j.foodchem.2012.02.179 PMID:23107689
Gille D, Schmid A (2015). Vitamin B12 in meat and dairy products. Nutr Rev, 73(2):106–15. doi:10.1093/nutrit/nuu011 PMID:26024497
Giri A, Khummueng W, Mercier F, Kondjoyan N, Tournayre P, Meurillon M et al. (2015). Relevance of two-dimensional gas chromatography and high reso-lution olfactometry for the parallel determination of heat-induced toxicants and odorants in cooked food. J Chromatogr A, 1388:217–26. doi:10.1016/j.chroma.2015.01.045 PMID:25728653
Givens DI (2005). The role of animal nutrition in improving the nutritive value of animal-derived foods in rela-tion to chronic disease. Proc Nutr Soc, 64(3):395–402. doi:10.1079/PNS2005448 PMID:16048674
Goldberg T, Cai W, Peppa M, Dardaine V, Baliga BS, Uribarri J et al. (2004). Advanced glycoxidation end products in commonly consumed foods. J Am Diet Assoc, 104(8):1287–91. doi:10.1016/j.jada.2004.05.214 PMID:15281050
Guerrero Legarreta I (2010). Canned products and pâté. In: Toldra F, editor. Handbook of meat processing. Blackwell Publishing. Part 2, Chapter 19; 337–349. Available from: http://onlinelibrary.wiley.com/doi/10.1002/9780813820897.ch19/summary
Guertin KA, Moore SC, Sampson JN, Huang WY, Xiao Q, Stolzenberg-Solomon RZ et al. (2014). Metabolomics in nutritional epidemiology: identifying metabolites associated with diet and quantifying their potential to uncover diet-disease relations in populations. Am J Clin Nutr, 100(1):208–17. doi:10.3945/ajcn.113.078758 PMID:24740205
Haorah J, Zhou L, Wang X, Xu G, Mirvish SS (2001). Determination of total N-nitroso compounds and their precursors in frankfurters, fresh meat, dried salted fish, sauces, tobacco, and tobacco smoke partic-ulates. J Agric Food Chem, 49(12):6068–78. doi:10.1021/jf010602h PMID:11743810
Hedlund M, Padler-Karavani V, Varki NM, Varki A (2008). Evidence for a human-specific mechanism for diet and antibody-mediated inflammation in carcinoma progression. Proc Natl Acad Sci U S A, 105(48):18936–41. doi:10.1073/pnas.0803943105 PMID:19017806
Hedrick VE, Dietrich AM, Estabrooks PA, Savla J, Serrano E, Davy BM (2012). Dietary biomarkers: advances, limitations and future directions. Nutr J, 11(1):109 doi:10.1186/1475-2891-11-109 PMID:23237668
Heinz G, Hautzinger P (2007). Meat processing technology for small - to medium - scale producers. Rome, Italy: Food and Agriculture Organization of the United Nations. Available from: http://www.fao.org/documents/card/fr/c/fb92d00f-7ff3-593a-a77c-7b19003b2554/
Henson S, Caswell J (1999). Food safety regulation: an overview of contemporary issues. Food Policy, 24(6):589–603. doi:10.1016/S0306-9192(99)00072-X

Red meat and processed meat
95
Heshmati A. (2015). Impact of cooking procedures on antibacterial drug residues in foods: a review. Journal of Food Quality & Hazards Control, 2:33–37.
Hill RJ, Davies PS (2001). The validity of self-reported energy intake as determined using the doubly labelled water technique. Br J Nutr, 85(4):415–30. doi:10.1079/BJN2000281 PMID:11348556
Honikel KO (2008). The use and control of nitrate and nitrite for the processing of meat products. Meat Sci, 78(1–2):68–76. doi:10.1016/j.meatsci.2007.05.030 PMID:22062097
Honikel KO (2010). Curing. Chapter 6. In: Toldra F, editor. Handbook of meat processing. Blackwell Publishing; 125–41. doi:10.1002/9780813820897.ch6
Hori T, Nakagawa R, Tobiishi K, Iida T, Tsutsumi T, Sasaki K et al. (2005). Effects of cooking on concentra-tions of polychlorinated dibenzo-p-dioxins and related compounds in fish and meat. J Agric Food Chem, 53(22):8820–8. doi:10.1021/jf050978l PMID:16248590
Hu FB (2002). Dietary pattern analysis: a new direc-tion in nutritional epidemiology. Curr Opin Lipidol, 13(1):3–9. doi:10.1097/00041433-200202000-00002 PMID:11790957
Hu FB, Stampfer MJ, Rimm E, Ascherio A, Rosner BA, Spiegelman D et al. (1999). Dietary fat and coro-nary heart disease: a comparison of approaches for adjusting for total energy intake and modeling repeated dietary measurements. Am J Epidemiol, 149(6):531–40. doi:10.1093/oxfordjournals.aje.a009849 PMID:10084242
Hudson WR, Mead GC, Hinton MH (1996). Relevance of abattoir hygiene assessment to microbial contami-nation of British beef carcases. Vet Rec, 139(24):587–9. PMID:8981733
Hull GLJ, Woodside JV, Ames JM, Cuskelly GJ (2012). Nε-(Carboxymethyl)lysine content of foods commonly consumed in a Western style diet. Food Chem, 131(1):170–4. doi:10.1016/j.foodchem.2011.08.055 PMID:23017409
Hygreeva D, Pandey MC, Radhakrishna K (2014). Potential applications of plant based derivatives as fat replacers, antioxidants and antimicrobials in fresh and processed meat products. Meat Sci, 98(1):47–57. doi:10.1016/j.meatsci.2014.04.006 PMID:24845336
IARC (1993). Some naturally occurring substances: food items and constituents, heterocyclic aromatic amines and mycotoxins. IARC Monogr Eval Carcinog Risks Hum, 56:1–599. Available from: http://monographs.iarc.fr/ENG/Monographs/vol56/index.php
IARC (2010a). Some non-heterocyclic polycyclic aromatic hydrocarbons and some related exposures. IARC Monogr Eval Carcinog Risks Hum, 92:1–853. Available from: http://monographs.iarc.fr/ENG/Monographs/vol92/index.php PMID:21141735
IARC (2010b). Ingested nitrate and nitrite, and cyano-bacterial peptide toxins. IARC Monogr Eval Carcinog
Risks Hum, 94:1–448. PMID:21141240. Available from: http://monographs.iarc.fr/ENG/Monographs/vol94/index.php
IARC (2012a). Arsenic, metals, fibres, and dusts. IARC Monogr Eval Carcinog Risks Hum, 100C:1–499. PMID:23189751. Available from: http://monographs.iarc.fr/ENG/Monographs/vol100C/index.php
IARC (2012b). Chemical agents and related occupations. IARC Monogr Eval Carcinog Risks Hum, 100F:1–599. PMID:23189753. Available from: http://monographs.iarc.fr/ENG/Monographs/vol100F/index.php
IARC (2016). Polychlorinated biphenyls and polybromi-nated biphenyls. IARC Monogr Eval Carcinog Risks Hum, 107:1–502. Available from: http://monographs.iarc.fr/ENG/Monographs/vol107/index.php
Imamura F, Micha R, Khatibzadeh S, Fahimi S, Shi P, Powles J et al. ; Global Burden of Diseases Nutrition and Chronic Diseases Expert Group (NutriCoDE)(2015). Dietary quality among men and women in 187 countries in 1990 and 2010: a systematic assessment. Lancet Glob Health, 3(3):e132–42. doi:10.1016/S2214-109X(14)70381-X PMID:25701991
IPCS (2009). Principles and methods for the risk assess-ment of chemicals in food. Environmental Health Criteria 240. Geneva, Switzerland: International Programme on Chemical Safety, Food and Agriculture Organization of the United Nations/World Health Organization. Available from: http://www.who.int/foodsafety/publications/chemical-food/en/
Isam T, Kadim IT, Mahgoub O (2007). Postharvest handling of red meat. In: Rahman MS editor. Handbook of food preservation. New York, USA: Marcel Dekker; 173.
Iwasaki M, Mukai T, Takachi R, Ishihara J, Totsuka Y, Tsugane S (2014). Validity of a self-administered food frequency questionnaire in the estimation of heterocyclic aromatic amines. Cancer Causes Control, 25(8):1015–28. doi:10.1007/s10552-014-0401-7 PMID:24890804
Järvinen R, Knekt P, Hakulinen T, Rissanen H, Heliövaara M (2001). Dietary fat, cholesterol and colorectal cancer in a prospective study. Br J Cancer, 85(3):357–61. doi:10.1054/bjoc.2001.1906 PMID:11487265
JECFA (2000). Toxicological evaluation of certain veter-inary drug residues in food: Estradiol-17α, proges-terone, and testosterone. Prepared by the Fifty-second meeting of the Joint FAO/WHO Expert Committee on Food Additives. Geneva, Switzerland: World Health Organization. WHO Food Additives Series: 43. Available from: http://www.inchem.org/documents/jecfa/jecmono/v43jec05.htm
JECFA (2002). Polychlorinated dibenzodioxins (PCDDs), polychlorinated dibenzofurans (PCDFs), and coplanar polychlorinated biphenyls (PCBs). Evaluations of the Joint FAO/WHO Expert Committee on Food Additives. Geneva, Switzerland: World Health Organization. Available from: http://apps.who.

IARC MONOGRAPHS – 114
96
int/food-additives-contaminants-jecfa-database/chemical.aspx?chemID=2753
JECFA (2011). Acrylamide. In: Safety evaluation of certain contaminants in food. Prepared by the Seventy-second meeting of the Joint FAO/WHO Expert Committee on Food Additives. WHO Food Additives Series: 63, FAO JECFA Monographs 8.
JECFA (2013). Cadmium. Evaluations of the Joint FAO/WHO Committee on Food Additives. Geneva, Switzerland: World Health Organization. Available from: http://apps.who.int/food-additives-contaminants-jecfa-database/chemical.aspx?chemID=1376
Jeong S-H, Kang D, Lim M-W, Kang CS, Sung HJ (2010). Risk assessment of growth hormones and antimicrobial residues in meat. Toxicol Res, 26(4):301–13. doi:10.5487/TR.2010.26.4.301 PMID:24278538
Kabat GC, Miller AB, Jain M, Rohan TE (2007). A cohort study of dietary iron and heme iron intake and risk of colorectal cancer in women. Br J Cancer, 97(1):118–22. doi:10.1038/sj.bjc.6603837 PMID:17551493
Kan CA, Meijer GAL (2007). The risk of contamination of food with toxic substances present in animal feed. Anim Feed Sci Technol, 133(1–2):84–108. doi:10.1016/j.anifeedsci.2006.08.005
Kato I, Akhmedkhanov A, Koenig K, Toniolo PG, Shore RE, Riboli E (1997). Prospective study of diet and female colorectal cancer: the New York University Women’s Health Study. Nutr Cancer, 28(3):276–81. doi:10.1080/01635589709514588 PMID:9343837
Kazerouni N, Sinha R, Hsu C-H, Greenberg A, Rothman N (2001). Analysis of 200 food items for benzo[a]pyrene and estimation of its intake in an epidemiologic study. Food Chem Toxicol, 39(5):423–36. doi:10.1016/S0278-6915(00)00158-7 PMID:11313108
Keating GA, Bogen KT (2004). Estimates of heterocy-clic amine intake in the US population. J Chromatogr B Analyt Technol Biomed Life Sci, 802(1):127–33. doi:10.1016/j.jchromb.2003.10.047 PMID:15036004
Kesse E, Clavel-Chapelon F, Boutron-Ruault MC (2006). Dietary patterns and risk of colorectal tumors: a cohort of French women of the National Education System (E3N). Am J Epidemiol, 164(11):1085–93. doi:10.1093/aje/kwj324 PMID:16990408
Khan MR, Busquets R, Santos FJ, Puignou L (2008). New method for the analysis of heterocyclic amines in meat extracts using pressurised liquid extraction and liquid chromatography–tandem mass spectrom-etry. J Chromatogr A, 1194(2):155–60. doi:10.1016/j.chroma.2008.04.058 PMID:18490022
Kilfoy BA, Zhang Y, Park Y, Holford TR, Schatzkin A, Hollenbeck A et al. (2011). Dietary nitrate and nitrite and the risk of thyroid cancer in the NIH-AARP Diet and Health Study. Int J Cancer, 129(1):160–72. doi:10.1002/ijc.25650 PMID:20824705
Kipnis V, Freedman LS, Brown CC, Hartman AM, Schatzkin A, Wacholder S (1997). Effect of measurement error on energy-adjustment models in nutritional epide-miology. Am J Epidemiol, 146(10):842–55. doi:10.1093/oxfordjournals.aje.a009202 PMID:9384205
Knize MG, Brown ED, Salmon CP, Levander OA, Felton JS, Rothman N (1998). Heterocyclic amine content in restaurant-cooked hamburgers, steaks, ribs and chicken. J. Food Ag. Chem., 46(11):4648–51. doi:10.1021/jf980639a
Kobayashi M, Hanaoka T, Hashimoto H, Tsugane S (2005). 2-Amino-1-methyl-6-phenylimidazo[4,5-b]pyridine (PhIP) level in human hair as biomarkers for dietary grilled/stir-fried meat and fish intake. Mutat Res, 588(2):136–42. doi:10.1016/j.mrgentox.2005.09.008 PMID:16289877
Kobayashi M, Hanaoka T, Tsugane S (2007). Validity of a self-administered food frequency questionnaire in the assessment of heterocyclic amine intake using 2-amino-1-methyl-6-phenylimidazo[4,5-b]pyri-dine (PhIP) levels in hair. Mutat Res, 630(1–2):14–9. doi:10.1016/j.mrgentox.2007.02.003 PMID:17392018
Krause R, Knoll K, Henle T (2003). Studies on the forma-tion of furosine and pyridosine during acid hydrolysis of different Amadori products of lysine. Eur Food Res Technol, 216(4):277–83. doi:10.1007/s00217-002-0649-0
Kushi LH (1994). Gaps in epidemiologic research methods: design considerations for studies that use food-fre-quency questionnaires. Am J Clin Nutr, 59(1):Suppl: 180S–4S. PMID:8279420
Larsen JC (2006). Risk assessments of polychlorinated dibenzo-p-dioxins, polychlorinated dibenzofu-rans, and dioFxin-like polychlorinated biphenyls in food. Mol Nutr Food Res, 50(10):885–96. doi:10.1002/mnfr.200500247 PMID:17009211
Lawrie RA (1998). Lawrie’s meat science. Cambridge, England: Woodhead Publishing Ltd.
Lawrie RA, Ledward DA (2006). Chapter 5: The conversion of muscle to meat. In: Lawrie RA, editor. Lawrie’s meat science. Cambridge, England: Woodhead Publishing Ltd.
Ledesma E, Rendueles M, Díaz M (2014). Benzo(a)pyrene penetration on a smoked meat product during smoking time. Food Addit Contam Part A Chem Anal Control Expo Risk Assess, 31(10):1688–98. doi:10.1080/19440049.2014.949875 PMID:25078362
Lee DH, Anderson KE, Folsom AR, Jacobs DR Jr (2005). Heme iron, zinc and upper digestive tract cancer: the Iowa Women’s Health Study. Int J Cancer, 117(4):643–7. doi:10.1002/ijc.21215 PMID:15929082
Lee SA, Shu XO, Yang G, Li H, Gao YT, Zheng W (2009). Animal origin foods and colorectal cancer risk: a report from the Shanghai Women’s Health Study. Nutr Cancer, 61(2):194–205. doi:10.1080/01635580802419780 PMID:19235035
Red meat and processed meat
97
Linseisen J, Kesse E, Slimani N, Bueno-De-Mesquita HB, Ocké MC, Skeie G et al. (2002). Meat consumption in the European Prospective Investigation into Cancer and Nutrition (EPIC) cohorts: results from 24-hour dietary recalls. Public Health Nutr, 5(6B):6B: 1243–58. doi:10.1079/PHN2002402 PMID:12639230
Linseisen J, Rohrmann S, Norat T, Gonzalez CA, Dorronsoro Iraeta M, Morote Gómez P et al. (2006). Dietary intake of different types and characteristics of processed meat which might be associated with cancer risk - results from the 24-hour diet recalls in the European Prospective Investigation into Cancer and Nutrition (EPIC). Public Health Nutr, 9(4):449–64. doi:10.1079/PHN2005861 PMID:16870017
Lloyd AJ, Favé G, Beckmann M, Lin W, Tailliart K, Xie L et al. (2011). Use of mass spectrometry fingerprinting to identify urinary metabolites after consumption of specific foods. Am J Clin Nutr, 94(4):981–91. doi:10.3945/ajcn.111.017921 PMID:21865330
Lombardi-Boccia G, Martinez-Dominguez B, Aguzzi A (2002). Total heme and non-heme iron in raw and cooked meats. J Food Sci, 67(5):1738–41. doi:10.1111/j.1365-2621.2002.tb08715.x
Lorenzo JM, Crecente S, Franco D, Sarriés MV, Gómez M (2014). The effect of livestock production system and concentrate level on carcass traits and meat quality of foals slaughtered at 18 months of age. Animal, 8(3):494–503. doi:10.1017/S175173111300236X PMID:24398030
Lorenzo JM, Fuciños C, Purriños L, Franco D (2010). Intramuscular fatty acid composition of “Galician Mountain” foals breed: effect of sex, slaughtered age and livestock production system. Meat Sci, 86(3):825–31. doi:10.1016/j.meatsci.2010.07.004 PMID:20675062
Lyche JL, Rosseland C, Berge G, Polder A (2015). Human health risk associated with brominated flame-retard-ants (BFRs). Environ Int, 74:170–80. doi:10.1016/j.envint.2014.09.006 PMID:25454234
Manabe S, Izumikawa S, Asakuno K, Wada O, Kanai Y (1991). Detection of carcinogenic amino-al-pha-carbolines and amino-gamma-carbolines in diesel-exhaust particles. Environ Pollut, 70(3):255–65. doi:10.1016/0269-7491(91)90013-M PMID:15092136
Marroquín-Cardona AG, Johnson NM, Phillips TD, Hayes AW (2014). Mycotoxins in a changing global environment – a review. Food Chem Toxicol, 69:220–30. doi:10.1016/j.fct.2014.04.025 PMID:24769018
McCann SE, Marshall JR, Trevisan M, Russell M, Muti P, Markovic N et al. (1999). Recent alcohol intake as esti-mated by the health habits and history questionnaire, the Harvard semiquantitative food frequency ques-tionnaire, and a more detailed alcohol intake ques-tionnaire. Am J Epidemiol, 150(4):334–40. doi:10.1093/oxfordjournals.aje.a010012 PMID:10453809
Mottier P, Parisod V, Turesky RJ (2000). Quantitative determination of polycyclic aromatic hydrocarbons in barbecued meat sausages by gas chromatography
coupled to mass spectrometry. J Agric Food Chem, 48(4):1160–6. doi:10.1021/jf991205y PMID:10775366
Murkovic M (2004). Formation of heterocyclic aromatic amines in model systems. J Chromatogr B Analyt Technol Biomed Life Sci, 802(1):3–10. doi:10.1016/j.jchromb.2003.09.026 PMID:15035991
Nachman KE, Smith TJ (2015). Hormone use in food animal production: assessing potential dietary expo-sures and breast cancer risk. Curr Environ Health Rep, 2(1):1–14. doi:10.1007/s40572-014-0042-8 PMID:26231238
NCI (2017). CHARRED: Computerized Heterocyclic Amines Resource for Research in Epidemiology of Disease. Bethesda (MD), USA: Division of Cancer Epidemiology and Genetics, National Cancer Institute. Available from: http://dceg.cancer.gov/tools/design/charred
Ni W, McNaughton L, LeMaster DM, Sinha R, Turesky RJ (2008). Quantitation of 13 heterocyclic aromatic amines in cooked beef, pork, and chicken by liquid chromatography–electrospray ionization/tandem mass spectrometry. J Agric Food Chem, 56(1):68–78. doi:10.1021/jf072461a PMID:18069786
Norat T, Bingham S, Ferrari P, Slimani N, Jenab M, Mazuir M et al. (2005). Meat, fish, and colorectal cancer risk: the European Prospective Investigation into Cancer and Nutrition. J Natl Cancer Inst, 97(12):906–16. doi:10.1093/jnci/dji164 PMID:15956652
Ockermann HW, Basu L (2010). Chapters 9 and 10: Fermented meat products: production and consump-tion. In: Toldrá F, editor. Handbook of meat processing. Columbus (OH), USA: The Ohio State University.
Office of the Federal Register (2015). Part 319–definitions and standards of identity or composition. Title 9 - Animals and animal products (9 CFR Part 319). United States Code of Federal Regulations. Washington (DC), USA: United States Government Publishing Office. Available from: http://www.gpo.gov/fdsys/pkg/CFR-2015-title9-vol2/xml/CFR-2015-title9-vol2-part319.xml
Olatunji OS, Fatoki OS, Opeolu BO, Ximba BJ (2014). Determination of polycyclic aromatic hydrocarbons [PAHs] in processed meat products using gas chro-matography – flame ionization detector. Food Chem, 156:296–300. doi:10.1016/j.foodchem.2014.01.120 PMID:24629971
Ollberding NJ, Wilkens LR, Henderson BE, Kolonel LN, Le Marchand L (2012). Meat consumption, heterocy-clic amines and colorectal cancer risk: the Multiethnic Cohort Study. Int J Cancer, 131(7):E1125–33. doi:10.1002/ijc.27546 PMID:22438055
Pala V, Krogh V, Berrino F, Sieri S, Grioni S, Tjønneland A et al. (2009). Meat, eggs, dairy products, and risk of breast cancer in the European Prospective Investigation into Cancer and Nutrition (EPIC) cohort. Am J Clin

IARC MONOGRAPHS – 114
98
Nutr, 90(3):602–12. doi:10.3945/ajcn.2008.27173 PMID:19491385
Paris A, Andre F, Antignac JP, Le Bizec B, Bonneau M, Briant C et al. (2006). Hormones et promoteurs de croissance en productions animales: de la physiologie à l’évaluation du risque. INRA Prod Anim, 19(3):151–240. [French]
Parnell WR, Blakey CW, Smith C (2012). Secondary anal-ysis of Adult Nutrition Survey 2008/09 for intake of Beef and Lamb for the New Zealand population and for consumers. Dunedin, New Zealand: LINZ® Nutrition and Activity Research Unit, University of Otago, Report No.: 2012.138.
Pearson AM, Gillett TA (1996). Curing. Chapter 3. In: Pearson AM, Gillett TA, editors. Processed meats, 3rd Edition. Maryland, USA: Aspen Publishers, Inc; 53–78.
Perelló G, Martí-Cid R, Castell V, Llobet JM, Domingo JL (2010). Influence of various cooking processes on the concentrations of PCDD/PCDFs, PCBs and PCDEs in foods. Food Contr, 21(2):178–85. doi:10.1016/j.foodcont.2009.05.003
Perelló G, Martí-Cid R, Llobet JM, Domingo JL (2008). Effects of various cooking processes on the concen-trations of arsenic, cadmium, mercury, and lead in foods. J Agric Food Chem, 56(23):11262–9. doi:10.1021/jf802411q PMID:18986150
Pietinen P, Malila N, Virtanen M, Hartman TJ, Tangrea JA, Albanes D et al. (1999). Diet and risk of colorectal cancer in a cohort of Finnish men. Cancer Causes Control, 10(5):387–96. doi:10.1023/A:1008962219408 PMID:10530608
Preussmann R, Stewart BW (1984). N-Nitroso carcin-ogens. In: Searle CE, editor. Chemical carcinogens. Washington (DC), USA: American Chemical Society; 643–828.
Pryer JA, Nichols R, Elliott P, Thakrar B, Brunner E, Marmot M (2001). Dietary patterns among a national random sample of British adults. J Epidemiol Community Health, 55(1):29–37. doi:10.1136/jech.55.1.29 PMID:11112948
Puiggròs F, Solà R, Bladé C, Salvadó MJ, Arola L (2011). Nutritional biomarkers and foodomic methodol-ogies for qualitative and quantitative analysis of bioactive ingredients in dietary intervention studies. J Chromatogr A, 1218(42):7399–414. doi:10.1016/j.chroma.2011.08.051 PMID:21917262
Purchas RW, Busboom JR (2005). The effect of produc-tion system and age on levels+ of iron, taurine, carnosine, coenzyme Q(10), and creatine in beef muscles and liver. Meat Sci, 70(4):589–96. doi:10.1016/j.meatsci.2005.02.008 PMID:22063884
Purchas RW, Busboom JR, Wilkinson BH (2006). Changes in the forms of iron and in concentrations of taurine, carnosine, coenzyme Q(10), and creatine in beef longis-simus muscle with cooking and simulated stomach and
duodenal digestion. Meat Sci, 74(3):443–9. doi:10.1016/j.meatsci.2006.03.015 PMID:22063048
Rahman MS (2007). Food preservation overview. In: Rahman MS, editor. Handbook of food preservation. New York, USA: Marcel Dekker; 635–66.
Rimm EB, Giovannucci EL, Stampfer MJ, Colditz GA, Litin LB, Willett WC (1992). Reproducibility and validity of an expanded self-administered semiquan-titative food frequency questionnaire among male health professionals. Am J Epidemiol, 135(10):1114–26, discussion 1127–36. PMID:1632423
Rohrmann S, Linseisen J, Becker N, Norat T, Sinha R, Skeie G et al. ; European Prospective Investigation into Cancer and Nutrition (2002). Cooking of meat and fish in Europe – results from the European Prospective Investigation into Cancer and Nutrition (EPIC). Eur J Clin Nutr, 56(12):1216–30. doi:10.1038/sj.ejcn.1601494 PMID:12494307
Rohrmann S, Zoller D, Hermann S, Linseisen J (2007). Intake of heterocyclic aromatic amines from meat in the European Prospective Investigation into Cancer and Nutrition (EPIC)-Heidelberg cohort. Br J Nutr, 98(6):1112–5. doi:10.1017/S000711450778145X PMID:18309547
Roseiro LC, Gomes A, Santos C (2011). Influence of processing in the prevalence of polycyclic aromatic hydrocarbons in a Portuguese traditional meat product. Food Chem Toxicol, 49(6):1340–5. doi:10.1016/j.fct.2011.03.017 PMID:21419819
Rywotycki R (2007). The effect of baking of various kinds of raw meat from different animal species and meat with functional additives on nitrosamine contami-nation level. Food Chem, 101(2):540–8. doi:10.1016/j.foodchem.2006.02.012
Samraj AN, Pearce OMT, Läubli H, Crittenden AN, Bergfeld AK, Banda K et al. (2015). A red meat-derived glycan promotes inflammation and cancer progression. Proc Natl Acad Sci U S A, 112(2):542–7. doi:10.1073/pnas.1417508112 PMID:25548184
Santarelli RL, Pierre F, Corpet DE (2008). Processed meat and colorectal cancer: a review of epidemiologic and experimental evidence. Nutr Cancer, 60(2):131–44. doi:10.1080/01635580701684872 PMID:18444144
Santé-Lhoutellier V, Astruc T, Marinova P, Greve E, Gatellier P (2008). Effect of meat cooking on physic-ochemical state and in vitro digestibility of myofi-brillar proteins. J Agric Food Chem, 56(4):1488–94. doi:10.1021/jf072999g PMID:18237130
Sato Y, Nakaya N, Kuriyama S, Nishino Y, Tsubono Y, Tsuji I (2006). Meat consumption and risk of colorectal cancer in Japan: the Miyagi Cohort Study. Eur J Cancer Prev, 15(3):211–8. doi:10.1097/01.cej.0000197455.87356.05 PMID:16679863
Scalbert A, Brennan L, Manach C, Andres-Lacueva C, Dragsted LO, Draper J et al. (2014). The food metab-olome: a window over dietary exposure. Am J Clin

Red meat and processed meat
99
Nutr, 99(6):1286–308. doi:10.3945/ajcn.113.076133 PMID:24760973
Schecter A, Harris TR, Shah N, Musumba A, Päpke O (2008). Brominated flame retardants in US food. Mol Nutr Food Res, 52(2):266–72. doi:10.1002/mnfr.200700166 PMID:18040989
Schonfeldt HC, Hall NG (2011). Determining iron bio-availability with a constant heme iron value. J Food Compos Anal, 24(4–5):738–40. doi:10.1016/j.jfca.2011.01.002
Schroeder H (2010). Les hydrocarbures aromatiques polycycliques présentent-ils un risque de neurotoxicité développementale? ANSES Bulletin veille scientifique santé environnement travail; 11:83–8. Available from: https://www.anses.fr/fr/system/files/BVS-mg-011-SCHROEDER.pdf [French]
Schummer C, Appenzeller BM, Millet M, Wennig R (2009). Determination of hydroxylated metabolites of polycyclic aromatic hydrocarbons in human hair by gas chromatography–negative chemical ionization mass spectrometry. J Chromatogr A, 1216(32):6012–9. doi:10.1016/j.chroma.2009.05.068 PMID:19577242
Sempos CT, Liu K, Ernst ND (1999). Food and nutrient exposures: what to consider when evaluating epide-miologic evidence. Am J Clin Nutr, 69(6):1330S–8S. PMID:10357757
Shin H-S, Strasburg GM, Gray JI (2002). A model system study of the inhibition of heterocyclic aromatic amine formation by organosulfur compounds. J Agric Food Chem, 50(26):7684–90. doi:10.1021/jf025707e PMID:12475289
Sikorski ZE, Kalakowski E (2010). Smoking. In: Toldra F, editor. Handbook of meat processing. Oxford, UK: Wiley-Blackwell. doi:10.1002/9780813820897.ch12
Sindelar JJ, Milkowski AL (2012). Human safety contro-versies surrounding nitrate and nitrite in the diet. Nitric Oxide, 26(4):259–66. doi:10.1016/j.niox.2012.03.011 PMID:22487433
Sindelar JJ, Sebranek JG, Bacus JN (2010). Uncured, natural, and organic processed meat products. Meat processing technology series. Champaign (IL), USA: American Meat Science Association; 1–42. Available from http://www.lulu.com/shop/jeffrey-sindelar/uncured-natural-and-organic-processed-meat-products/paperback/product-12200306.html
Singh PN, Fraser GE (1998). Dietary risk factors for colon cancer in a low-risk population. Am J Epidemiol, 148(8):761–74. doi:10.1093/oxfordjournals.aje.a009697 PMID:9786231
Sinha R, Knize MG, Salmon CP, Brown ED, Rhodes D, Felton JS et al. (1998a). Heterocyclic amine content of pork products cooked by different methods and to varying degrees of doneness. Food Chem Toxicol, 36(4):289–97. doi:10.1016/S0278-6915(97)00159-2 PMID:9651045
Sinha R, Rothman N, Brown ED, Salmon CP, Knize MG, Swanson CA et al. (1995). High concentrations of the carcinogen 2-amino-1-methyl-6-phenylim-idazo-[4,5-b]pyridine (PhIP) occur in chicken but are dependent on the cooking method. Cancer Res, 55(20):4516–9. PMID:7553619
Sinha R, Rothman N, Salmon CP, Knize MG, Brown ED, Swanson CA et al. (1998b). Heterocyclic amine content in beef cooked by different methods to varying degrees of doneness and gravy made from meat drippings. Food Chem Toxicol, 36(4):279–87.[b] doi:10.1016/S0278-6915(97)00162-2 PMID:9651044
Skog K, Solyakov A, Jagerstad MI (2000). Effects of heating conditions and additives on the formation of heterocyclic amines with reference to amino-carbo-lines in a meat juice model system. Food Chem Toxicol, 68(3):299–308. doi:10.1016/S0308-8146(99)00195-8
Skog KI, Johansson MA, Jägerstad MI (1998). Carcinogenic heterocyclic amines in model systems and cooked foods: a review on formation, occurrence and intake. Food Chem Toxicol, 36(9–10):879–96. doi:10.1016/S0278-6915(98)00061-1 PMID:9737435
Sobell J, Block G, Koslowe P, Tobin J, Andres R (1989). Validation of a retrospective questionnaire assessing diet 10–15 years ago. Am J Epidemiol, 130(1):173–87. PMID:2741904
Sofos JN (2008). Challenges to meat safety in the 21st century. Meat Sci, 78(1–2):3–13. doi:10.1016/j.meatsci.2007.07.027 PMID:22062090
Stadler RH, Lineback DR (2009). Process-induced food toxicants, occurrence, formation, mitigation and health risks. Hoboken (NJ), USA: John Wiley & Sons.
Stella C, Beckwith-Hall B, Cloarec O, Holmes E, Lindon JC, Powell J et al. (2006). Susceptibility of human meta-bolic phenotypes to dietary modulation. J Proteome Res, 5(10):2780–8. doi:10.1021/pr060265y PMID:17022649
Subar AF, Midthune D, Kulldorff M, Brown CC, Thompson FE, Kipnis V et al. (2000). Evaluation of alternative approaches to assign nutrient values to food groups in food frequency questionnaires. Am J Epidemiol, 152(3):279–86. doi:10.1093/aje/152.3.279 PMID:10933275
Subar AF, Thompson FE, Smith AF, Jobe JB, Ziegler RG, Potischman N et al. (1995). Improving food frequency questionnaires: a qualitative approach using cognitive interviewing. J Am Diet Assoc, 95(7):781–8, quiz 789–90. doi:10.1016/S0002-8223(95)00217-0 PMID:7797809
Subar AF, Ziegler RG, Thompson FE, Johnson CC, Weissfeld JL, Reding D et al.; Prostate, Lung, Colorectal, and Ovarian Cancer Screening Trial Investigators (2001). Is shorter always better? Relative importance of questionnaire length and cognitive ease on response rates and data quality for two dietary questionnaires. Am J Epidemiol, 153(4):404–9. doi:10.1093/aje/153.4.404 PMID:11207159

IARC MONOGRAPHS – 114
100
Sugimura T, Wakabayashi K, Nakagama H, Nagao M (2004). Heterocyclic amines: mutagens/carcinogens produced during cooking of meat and fish. Cancer Sci, 95(4):290–9. doi:10.1111/j.1349-7006.2004.tb03205.x PMID:15072585
Sun XD, Holley RA (2011). Factors influencing gel formation by myofibrillar proteins in muscle foods. Comp Rev Food Sci Food Safe, 10(1):33–51. doi:10.1111/j.1541-4337.2010.00137.x
Sy MM, Feinberg M, Verger P, Barré T, Clémençon S, Crépet A (2013). New approach for the assessment of cluster diets. Food Chem Toxicol, 52:180–7. doi:10.1016/j.fct.2012.11.005 PMID:23182740
Takachi R, Tsubono Y, Baba K, Inoue M, Sasazuki S, Iwasaki M et al.; Japan Public Health Center-Based Prospective Study Group (2011). Red meat intake may increase the risk of colon cancer in Japanese, a popu-lation with relatively low red meat consumption. Asia Pac J Clin Nutr, 20(4):603–12. PMID:22094846
Tangvoranuntakul P, Gagneux P, Diaz S, Bardor M, Varki N, Varki A et al. (2003). Human uptake and incorpo-ration of an immunogenic nonhuman dietary sialic acid. Proc Natl Acad Sci U S A, 100(21):12045–50. doi:10.1073/pnas.2131556100 PMID:14523234
Tareke E, Rydberg P, Karlsson P, Eriksson S, Törnqvist M (2002). Analysis of acrylamide, a carcinogen formed in heated foodstuffs. J Agric Food Chem, 50(17):4998–5006. doi:10.1021/jf020302f PMID:12166997
Tavani A, La Vecchia C, Gallus S, Lagiou P, Trichopoulos D, Levi F et al. (2000). Red meat intake and cancer risk: a study in Italy. Int J Cancer, 86(3):425–8. doi:10.1002/(S IC I )10 9 7- 0 215 (2 0 0 0 0 5 01) 8 6 : 3 <4 2 5 : : A I D -IJC19>3.0.CO;2-S PMID:10760833
Thompson FE, Kipnis V, Midthune D, Freedman LS, Carroll RJ, Subar AF et al. (2008). Performance of a food-frequency questionnaire in the US NIH-AARP (National Institutes of Health-American Association of Retired Persons) Diet and Health Study. Public Health Nutr, 11(2):183–95. doi:10.1017/S1368980007000419 PMID:17610761
Thompson FE, Subar AF (2013). Dietary assess-ment methodology. In: Coulston AM, Boushey CJ, Ferruzzi MG, editors. Nutrition in the prevention and treatment of disease. 3rd ed. Elsevier. doi:10.1016/B978-0-12-391884-0.00001-9
Tiemersma EW, Kampman E, Bueno de Mesquita HB, Bunschoten A, van Schothorst EM, Kok FJ et al. (2002). Meat consumption, cigarette smoking, and genetic susceptibility in the etiology of colorectal cancer: results from a Dutch prospective study. Cancer Causes Control, 13(4):383–93. doi:10.1023/A:1015236701054 PMID:12074508
Toldrá F (2010). Handbook of meat processing. Oxford, UK: Wiley-Blackwell. doi:10.1002/9780813820897
Tran NL, Barraj L, Smith K, Javier A, Burke TA (2004). Combining food frequency and survey data to quantify
long-term dietary exposure: a methyl mercury case study. Risk Anal, 24(1):19–30. doi:10.1111/j.0272-4332.2004.00408.x PMID:15027997
Tricker AR (1997). N-Nitroso compounds and man: sources of exposure, endogenous formation and occurrence in body fluids. Eur J Cancer Prev, 6(3):226–68. doi:10.1097/00008469-199706000-00003 PMID:9306073
Turesky RJ, Liu L, Gu D, Yonemori KM, White KK, Wilkens LR et al. (2013). Biomonitoring the cooked meat carcinogen 2-amino-1-methyl-6-phenylimida-zo[4,5-b]pyridine in hair: impact of exposure, hair pigmentation, and cytochrome P450 1A2 phenotype. Cancer Epidemiol Biomarkers Prev, 22(3):356–64. doi:10.1158/1055-9965.EPI-12-1206 PMID:23329727
University of Otago and Ministry of Health (2011). Methodology report for the 2008/09 New Zealand Adult Nutrition Survey. Wellington, New Zealand: Ministry of Health. Available from: http://www.health.govt.nz/system/files/documents/publications/methodology-report.pdf, accessed August 2015
Uribarri J, Woodruff S, Goodman S, Cai W, Chen X, Pyzik R et al. (2010). Advanced glycation end products in foods and a practical guide to their reduction in the diet. J Am Diet Assoc, 110(6):911–16.e12. doi:10.1016/j.jada.2010.03.018 PMID:20497781
Vitaglione P, Fogliano V (2004). Use of antioxidants to minimize the human health risk associated to muta-genic/carcinogenic heterocyclic amines in food. J Chromatogr B Analyt Technol Biomed Life Sci, 802(1):189–99. doi:10.1016/j.jchromb.2003.09.029 PMID:15036011
Walker R (1990). Nitrates, nitrites and N-nitrosocompounds: a review of the occurrence in food and diet and the toxicological implications. Food Addit Contam, 7(6):717–68. doi:10.1080/02652039009373938 PMID:2079111
Ward MH, Cantor KP, Riley D, Merkle S, Lynch CF (2003). Nitrate in public water supplies and risk of bladder cancer. Epidemiology, 14(2):183–90. doi:10.1097/01.EDE.0000050664.28048.DF PMID:12606884
Ward MH, Cerhan JR, Colt JS, Hartge P (2006). Risk of non-Hodgkin lymphoma and nitrate and nitrite from drinking water and diet. Epidemiology, 17(4):375–82. doi:10.1097/01.ede.0000219675.79395.9f PMID:16699473
Wei EK, Giovannucci E, Wu K, Rosner B, Fuchs CS, Willett WC et al. (2004). Comparison of risk factors for colon and rectal cancer. Int J Cancer, 108(3):433–42. doi:10.1002/ijc.11540 PMID:14648711
Weiss J, Gibis M, Schuh V, Salminen H (2010). Advances in ingredient and processing systems for meat and meat products. Meat Sci, 86(1):196–213. doi:10.1016/j.meatsci.2010.05.008 PMID:20619800
WHO (2006). Evaluation of certain food contaminants. Sixty-fourth report of the Joint FAO/WHO Expert
Red meat and processed meat
101
Committee on Food Additives. WHO Technical Report Series No. 930. Geneva, Switzerland: World Health Organization.
WHO (2013). GEMS/Food cluster diets - 2012. A part of the FOSCOLLAB platform for food safety data and information. Geneva, Switzerland: World Health Organization. Available from: https://extranet.who.int/sree/Reports?op=vs&path=/WHO_HQ_Reports/G7/PROD/EXT/GEMS_cluster_diets_2012&userid=G7_ro&password=inetsoft123
WHO (2015a). WHO databases on food safety [online databases]. Geneva, Switzerland: World Health Organization. Available from: http://www.who.int/foodsafety/databases/en/, accessed 9 July 2015
WHO (2015b). GEMS/Food contaminants [online data-base]. Geneva, Switzerland: Global Environment Monitoring System - Food Contamination Monitoring and Assessment Programme, World Health Organization. Available from: https://extranet.who.int/gemsfood/Search.aspx
Williams P (2007). Nutritional composi-tion of red meat. Nutr Diet, 64(s4): S11311–9. doi:10.1111/j.1747-0080.2007.00197.x
Wood JD, Enser M (1997). Factors influencing fatty acids in meat and the role of antioxidants in improving meat quality. Br J Nutr, 78(01):Suppl 1: S49–60. doi:10.1079/BJN19970134 PMID:9292774
Wood JD, Enser M, Fisher AV, Nute GR, Richardson RI, Sheard PR (1999). Manipulating meat quality and composition. Proc Nutr Soc, 58(2):363–70. doi:10.1017/S0029665199000488 PMID:10466178
Wu K, Sinha R, Holmes MD, Giovannucci E, Willett W, Cho E (2010). Meat mutagens and breast cancer in postmen-opausal women – a cohort analysis. Cancer Epidemiol Biomarkers Prev, 19(5):1301–10. doi:10.1158/1055-9965.EPI-10-0002 PMID:20447922
Yaylayan VA, Locas CP, Wnorowski A, O’Brien J (2004). The role of creatine in the generation of N-methylacrylamide: a new toxicant in cooked meat. J Agric Food Chem, 52(17):5559–65. doi:10.1021/jf049421g PMID:15315400
Zeitoun MM, Ahmed SM (2011). Effect of cooking method on the residues of natural sex steroid hormones in local and imported meats and meat products in Al-Qassim region. J Agril Vet Sci, 4(2):83–92.
Zetlaoui M, Feinberg M, Verger P, Clémençon S (2011). Extraction of food consumption systems by nonneg-ative matrix factorization (NMF) for the assessment of food choices. Biometrics, 67(4):1647–58. doi:10.1111/j.1541-0420.2011.01588.x PMID:21418050
Zhai F, Wang H, Du S, He Y, Wang Z, Ge K et al. (2009). Prospective study on nutrition transition in China. Nutr Rev, 67:Suppl 1: S56–61. doi:10.1111/j.1753-4887.2009.00160.x PMID:19453679
Zimmerli B, Rhyn P, Zoller O, Schlatter J (2001). Occurrence of heterocyclic aromatic amines in the
Swiss diet: analytical method, exposure estimation and risk assessment. Food Addit Contam, 18(6):533–51. doi:10.1080/02652030119545 PMID:11407752
Zukál E, Incze K (2010). Drying. Part 1, Chapter 11. In: Toldrá F, editor. Handbook of meat processing. Oxford, UK: Wiley-Blackwell; 219–229. Available from: http://onlinelibrary.wiley.com/doi/10.1002/9780813820897.ch11/summary