
1 | Energy Efficiency and Renewable Energyeere.energy.gov Energy Data Collection and Tracking for...
35
1 | Energy Efficiency and Renewable Energy eere.energy.gov Energy Data Collection and Tracking for Internal Benchmarking and Energy Management: Best Practices from State and Local Governments and School Districts December 18, 2014 Mona Khalil Department of Energy EERE Weatherization and Intergovernmenta l Program
-
Upload
jeffery-winterburn -
Category
Documents
-
view
213 -
download
0
Transcript of 1 | Energy Efficiency and Renewable Energyeere.energy.gov Energy Data Collection and Tracking for...

1 | Energy Efficiency and Renewable Energy eere.energy.gov
Energy Data Collection and Tracking for Internal Benchmarking and Energy Management:Best Practices from State and Local Governments and School Districts
December 18, 2014
Mona KhalilDepartment of EnergyEEREWeatherization and Intergovernmental Program

2
DOE’s State & Local Technical Assistance
• Strategic Energy Planning• Program & Policy Design and
Implementation• Financing Strategies• Data Management and EM&V• Technology Deployment
Priority Areas
• General Education (e.g., fact sheets, 101s)• Implementation Models (i.e., case studies)• Research & Tools for Decision-Making• Protocols (e.g., how-to guides, model
documents)
Resources
• Webinars• Conferences & in-person trainings• Better Buildings Project Teams• Accelerators
Peer Exchange &
Trainings
• On a limited basis• Level of effort will vary• In-depth efforts will be focused on:
• High impact efforts• Opportunities for replicability• Filling gaps in the technical assistance marketplace
Direct Technical
Assistance

3
• Visit the Solution Center www.eere.energy.gov/wip/solutioncenter/
• Sign up for TAP Alerts, the TAP mailing list, for updates on our latest and greatest [email protected]
How to Tap into These and Other TAP Offerings

4
WIP – Who we are and what we do
Mission: Accelerate deployment of energy efficiency and renewable energy technologies over a wide range of stakeholders in partnership with states and local governments.
Strategic objective: “Deploy the clean energy technologies we have” through near-term activities that result in greater energy efficiency, expanded renewable energy capacity, and economic development.
Pathways:• Financial assistance: Formula and competitive awards > $200 M per year to
weatherize low-income homes, and assist states to deploy EE and RE projects and programs
• Voluntary programs: Better Buildings Challenge (BBC) & Accelerators• Technical assistance: Resources to assist the public sector with planning,
financing, evaluating and deploying EE and RE programs and projects

5

6
Coming in 2015
Best Practices in Energy Data Collection and Tracking in the Public SectorA new step-by-step guide on data tracking for internal benchmarking and energy management purposes featuring effective and replicable solutions that states, locals and K-12 are using to enhance their energy data management practices• Step-by-step framework with five key elements for establishing a robust and
sustainable energy data management system
• Detailed best practice profiles and tactics featuring state, municipal and K-12 practitioners
• Checklists, tools, and templates

7
Outline for Today’s Presentation
Best Practices in Energy Data Collection and Tracking
• Study methodology
• Benefits of tracking energy use
• Five key elements for effective energy data tracking
• Examples of cities and a State
• Case Study: Portland Public Schools
• Key takeaways
8
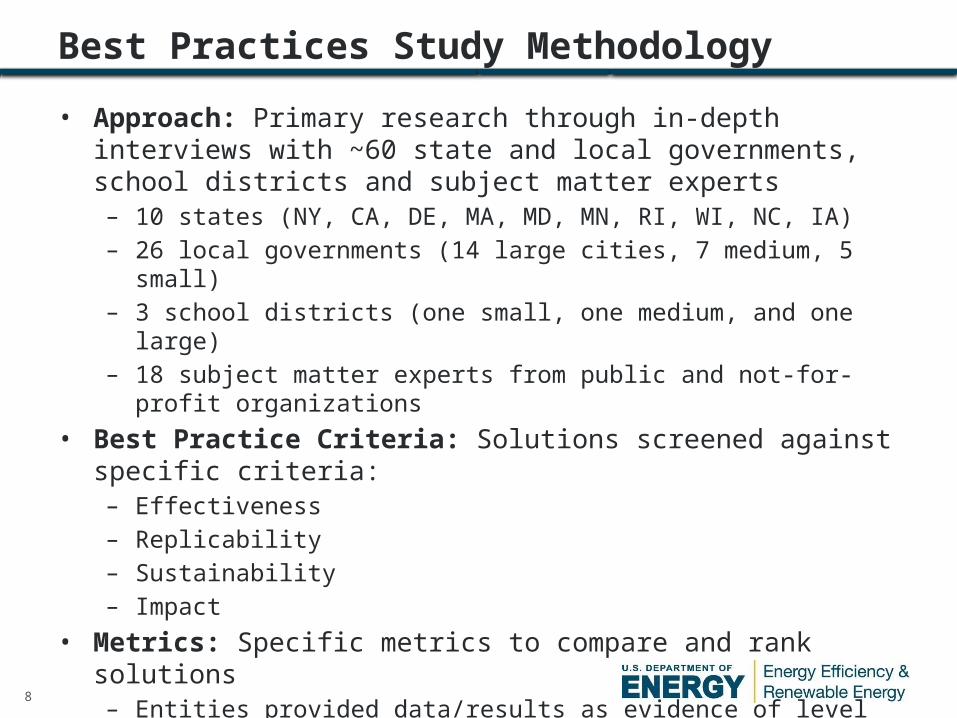
Best Practices Study Methodology
• Approach: Primary research through in-depth interviews with ~60 state and local governments, school districts and subject matter experts– 10 states (NY, CA, DE, MA, MD, MN, RI, WI, NC, IA)– 26 local governments (14 large cities, 7 medium, 5 small) – 3 school districts (one small, one medium, and one large) – 18 subject matter experts from public and not-for-profit organizations
• Best Practice Criteria: Solutions screened against specific criteria:– Effectiveness– Replicability – Sustainability– Impact
• Metrics: Specific metrics to compare and rank solutions– Entities provided data/results as evidence of level of efficacy – Principal metric: Energy and cost savings; – Secondary metrics: time savings; change in resource requirements (cost, time,
human capital); etc.

9
Interviewees report the ability to: • Improve strategic energy management
capabilities• Build the case to leadership on the value
of energy management and gain additional support
• Improve control and transparency of energy costs and budgets
• Improve operational efficiency• Facilitate demand response and energy
purchasing
Why track energy data?
“Measuring your energy usage and cost is the first step to properly managing energy”
- City of Virginia Beach Mayor William Sessoms, Jr.

10
How did they get there?
AssetInventory
DataAccess
Tools and Analytics
Engagement Communication
OrganizationalStructure
Best Practices in Energy Data ManagementFive Elements for Success
ComprehensiveCentralized
VerifiedUp to Date
ComprehensiveStreamlinedAutomatic
Prompt
FlexibleSecure
AccessibleQA/QC
IntegratedCentralized
Dedicated StaffStreamlined
TargetedClear
TransparentMission-focused
11
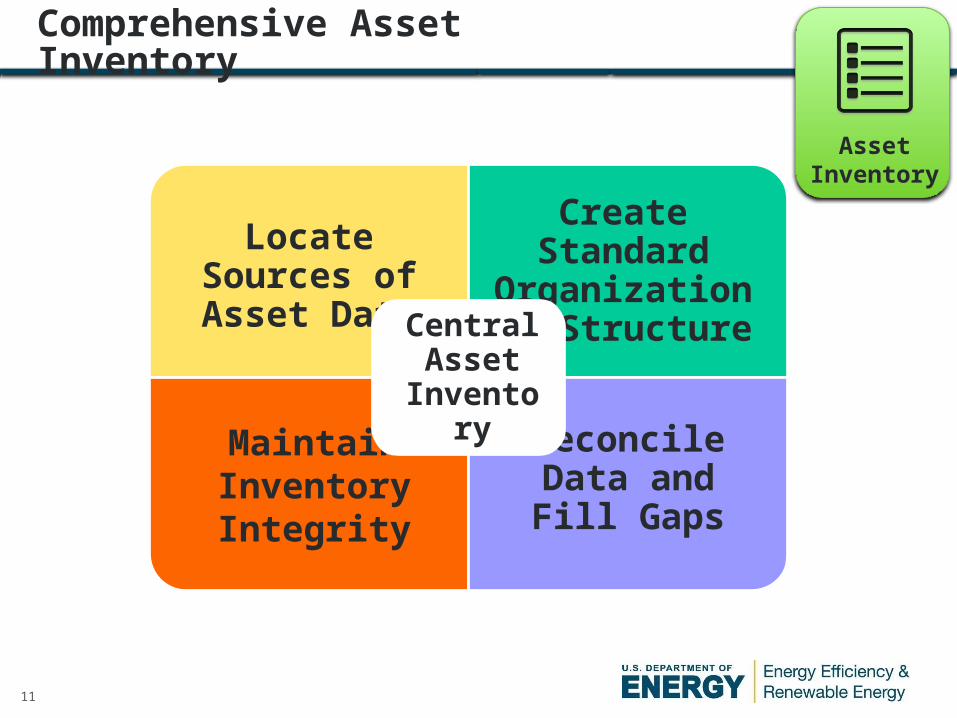
Comprehensive Asset Inventory
AssetInventory
Locate Sources of Asset Data
Create Standard Organizational
Structure
Maintain Inventory Integrity
Reconcile Data and Fill Gaps
Central Asset
Inventory

12
Streamlining Data Access
Benefits• Speed to data receipt: lower time
gap between usage period and when data can be viewed
• Cost savings: use consumption, cost, demand charges, rate schedules, etc. to maximize savings
• Data quality: reduce errors introduced during data transfer, perform audits
• Operational efficiency: save staff time, reduce redundancy in operations, add value
What do we mean by “streamlined data access”?
• Electronic data transfer from utility to customer
• Efficient and timely access to comprehensive utility billing data
• Monthly or more frequent energy use intervals
• Minimal manual data entry• Data for all commodities and all
energy- and water-using assets
DataAccess
Utility 3
Utility 2
Your Organization
Utility 1
Database

13
• Most common approach for entities with municipal utilities with no other data access options
• Feasible to develop custom solutions
• Good option for entities with >100 accounts with EDI-capable utility
• Generally limited to electric and some natural gas IOUs
• Streamlines data transfer to Portfolio Manager facilitating benchmarking; additional sectors and functionalities added
• A growing number of utilities offer this solution
• Best option for medium to large entities with many vendors and data formats
• Least common but effective
• Emerging best practice solution for sharing near real-time and comprehensive bill data
• A growing number of utilities are adopting Green Button
Consolidated Billing
Electronic Data Interchange (EDI)
Portfolio ManagerData Exchange Web Services
Green Button Connect My Data
Third Party Services
Solutions for Streamlining Data Access
14
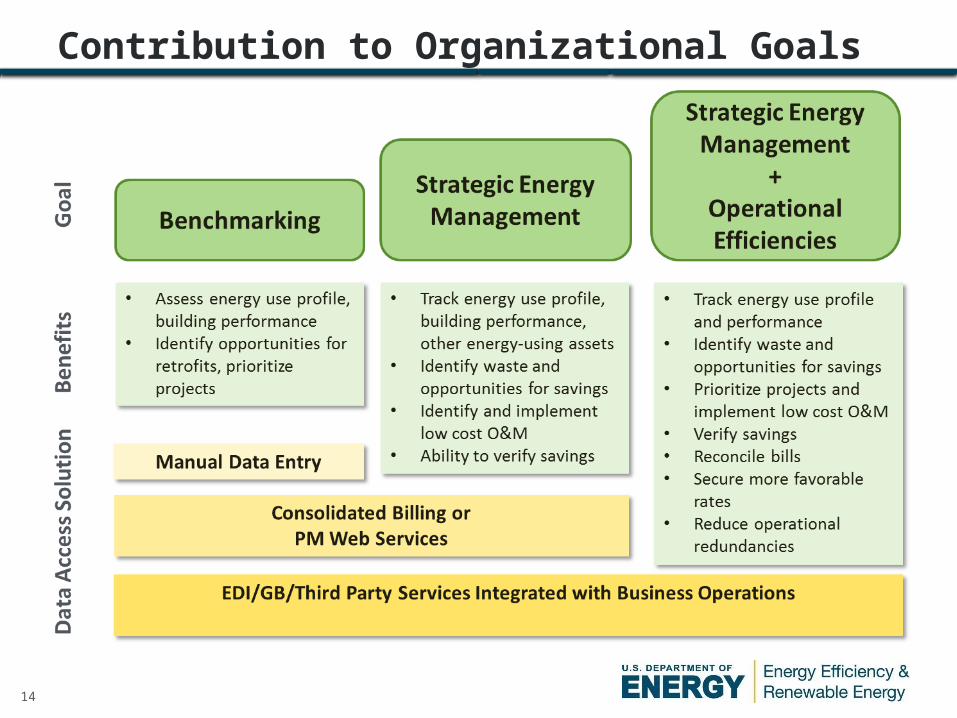
Contribution to Organizational Goals

15
Data Tools and Analytics
Tools and AnalyticsStructure
• Data management, organization
• Data entry and interoperability
• Flexibility• Data back-up
and security
Analytics• Data processing• Data analysis• Search and sort functions• Data auditing
Users• Dashboards
and reporting• Stakeholder
access to data• Customer
support and training
16
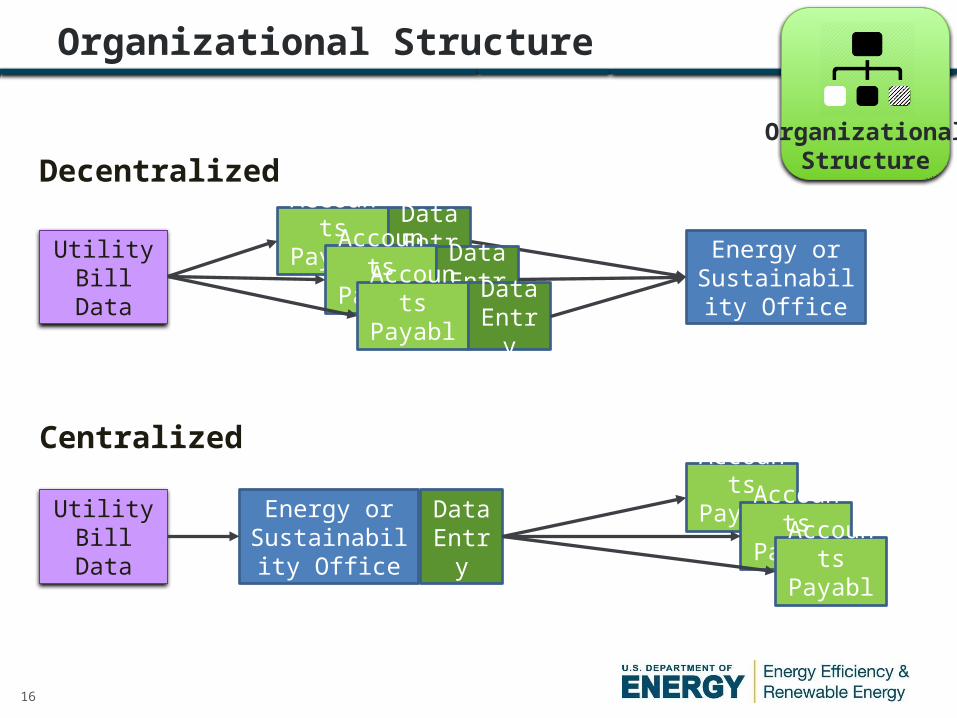
Organizational Structure
OrganizationalStructure
Accounts Payable Energy or
Sustainability Office
Data EntryUtility Bill
Data
Decentralized
Accounts Payable
Data EntryAccounts
PayableData Entry
Energy or Sustainability
Office
Utility Bill Data
Accounts PayableData
EntryAccounts Payable
Centralized
Accounts Payable

17
Organizational Structure
Third Party
Energy Database
Energy Manager/ Engineer
Energy Coordinator
Accounts Payable
Agencies/ Departments
Department of General Services
Utility
OrganizationalStructure
Example of a Partially-Centralized Organizational Structure

18
Engagement and Communications
Engagement Communication
Energy Data
Manager
Leaders
Agency/Depart-
ment
Asset Managers
Finance
Staff/ Public
Utilities
Tailor Reports to Individual Audiences
Create Transparency
Drive participation through a uniform collection platform
Establish Effective Working Groups
Incentivize and Recognize Key StakeholdersDevelop
Partnerships
19
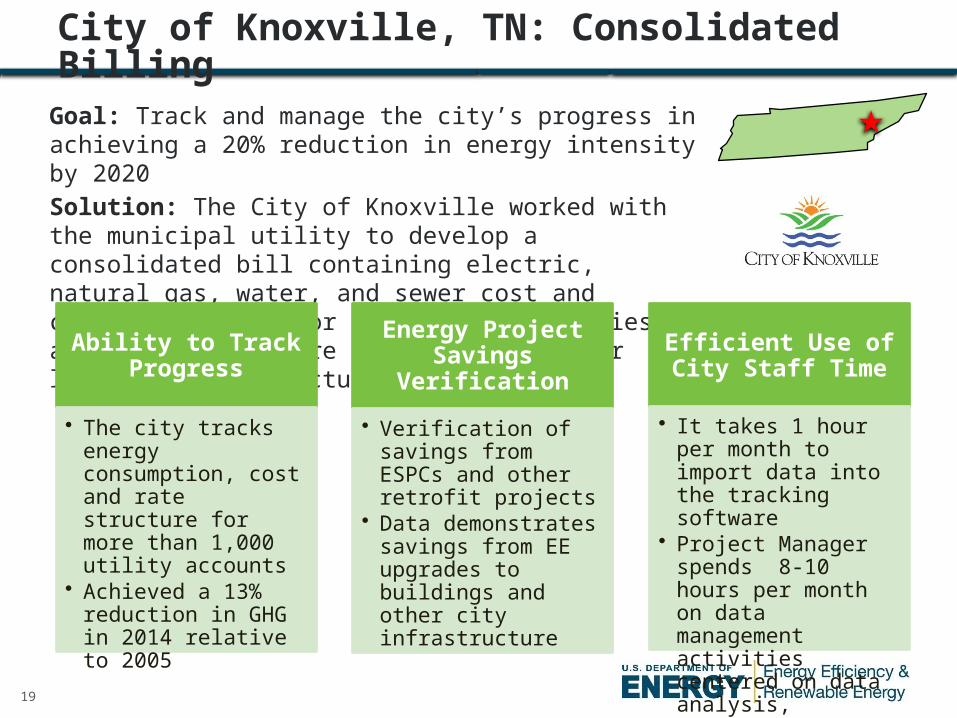
City of Knoxville, TN: Consolidated Billing
Goal: Track and manage the city’s progress in achieving a 20% reduction in energy intensity by 2020Solution: The City of Knoxville worked with the municipal utility to develop a consolidated bill containing electric, natural gas, water, and sewer cost and consumption data for the city’s facilities and non-metered fire hydrant and outdoor lighting infrastructure
Ability to Track Progress
• The city tracks energy consumption, cost and rate structure for more than 1,000 utility accounts
• Achieved a 13% reduction in GHG in 2014 relative to 2005
Energy Project Savings Verification
• Verification of savings from ESPCs and other retrofit projects
• Data demonstrates savings from EE upgrades to buildings and other city infrastructure
Efficient Use of City Staff Time
• It takes 1 hour per month to import data into the tracking software
• Project Manager spends 8-10 hours per month on data management activities centered on data analysis, reporting, and entry updating.

20
City of Virginia Beach: Integrated Tracking & Payment
• Goal: Improve efficiency of operations and control of energy budget
• Solution: The City of Virginia Beach has eliminated nearly 1,000 paper bills monthly, reducing staff time needed for data entry by 85% . VB metropolitan area is now ranked fourth among mid-sized cities for ENERGY STAR certified buildings. CVB received the Government Finance Officers Association’s Award for Innovation in Government for the utility bill management process
Before EDI With EDI
158
24
Bill Processing Time (Hours per Month)
85% %
Energy Management and Conservation
• Track energy usage• perform energy savings
verification on completed retrofits
• Energy reports to motivate occupants to take action
City Planning, Budgeting and Operations
• Make wise energy purchasing decisions
• Eliminate billing errors and late payment
• Improve budgeting, accruals, accounting

21
State of Maryland: Centralized Energy Database
Goal: Track consumption across all facilities (124 vendors, >16,000 utility accounts, 120 accounts payable departments, 58 agencies) Solution: A centralized energy data collection and tracking process using a third party to assist in the compilation of a central energy database, development of streamlined utility data access solutions, and maintenance of a transparent web-based portal. Annual energy budget >$200MM, Cost of contract: $0.8-1MM
Electricity Natural Gas
9.6
7.1
FY2013 Block & Index Commodity Purchasing
Savings (Millions $)

22
Case Study: Portland Public Schools
Leveraging a Third Party Service Provider to Streamline Data Entry
Jeff Hamman, CEMEnergy Specialist
Buildings Operations and Energy Program Manager Portland Public Schools

23
• Portland Public Schools: Portland, OR
• Largest School District North of San Francisco
• Over 9 Million Square Feet Managed– 104 Facilities Managed– 65 years Ave Building Age– 800+ Utility Accounts– 47,000+ Students– 6,000+ Staff– $10.4M FY 13-14 Utility Budget
Portland Public Schools: Building Portfolio

24
Portland Public Schools: Goals
Achieve a 20% reduction in energy intensity by
2020 as per the Better Buildings Challenge goal
Quicker access to data for analysis and reporting
Reallocate staff time to more productive matters
Simplify invoice payment and processing
Comply with a statewide mandate to report
annual energy consumption

25
Portland Public Schools: Barrier Implementation costCost effectivenessProcurement, project management and
implementation Accounts payable process integration
Process Timeline from Bill Date
Invoiced Received 1-2 weeks
Payment Processed 2-3 weeks
Manual Data Entry 4-12 weeks
Usage and Cost Review
4-12 weeks
Address Issues 6-12 weeks
Reporting 12-14 weeks
Manual Data Entry

26
Portland Public Schools: Barrier
School District Personnel
Average Monthly
Hours Saved
Equivalent Internal Personnel and Other
Savings
Energy Specialist 20 $10,468
Resource Conservation Manager
8 $4,395
Finance Clerk I 18 $6,359
Annual Service Fee for Utility Database
- $1,975
Total Savings 46 $23,897

27
Portland Public Schools: Solution
Portland Public Schools (PPS) contracted with a third party energy and utility management company to develop a comprehensive solution for its utility data access, tracking, and processing needs.
• Continuous utility bill data entry• Invoice processing and auditing• Late fee avoidance • Missing invoice/late arriving notification• Correspondence and bill insert• Invoice archiving
• Improved reporting capabilities including custom reports
• Budget tracking, analysis and modeling• Annual review of utility rate schedules• Automatic Energy Star upload• Web-based platform, enabling access to
data to a greater number of staff• Training and technical assistance
Utility Bill Management
Energy Management Tool
28
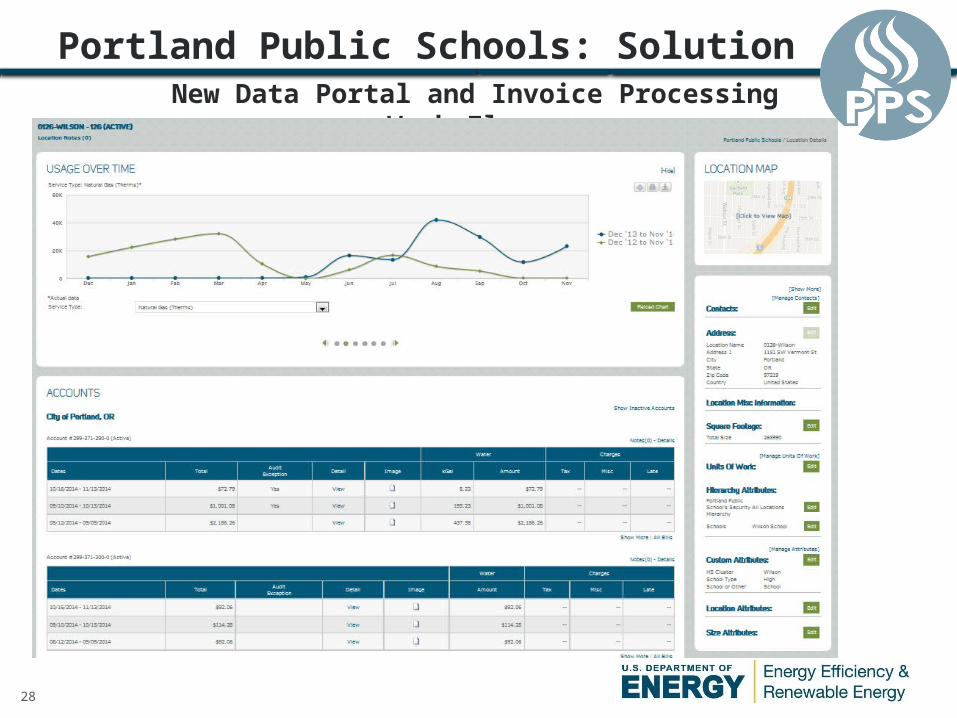
Portland Public Schools: Solution New Data Portal and Invoice Processing Work Flow

29
Portland Public Schools: Outcomes
Manual data entry of utility bills is virtually eliminated through the third party vendor contract
Staff time reallocated to address usage anomalies and improve the energy performance of school facilities
Decreased invoice processing times
Automated usage and cost notifications
Process flow efficiencies Access to data In-House Data
EntryThird Party
Contract
12
6
Maximum Delay in Availability of Energy Data for Review
(Weeks)

30
Portland Public Schools: Outcomes
January
Febru
ary
March April
May
JuneJuly
August
September
October
November
December
January0
200
400
600
800
1000
1200
$0
$500
$1,000
$1,500
$2,000
$2,500
$3,000
$3,500
$4,000
$4,500
Water Consumption and Cost History for PPS High School
Water Consumption (CCF) Cost
Cons
umpti
on (C
CF)
Mon
thly
Cos
t ($)
Corrective action was taken in November, return-ing usage to normal levels by December, avoid-
ing approx. $10,000 in charges

31
Portland Public Schools: Outcomes
0270-Mee
k/Allia
nce
0220-Mars
hall
0115-Benso
n (incl.
KBPS)
0120-Linco
ln
0199-Tubman
0124-Roosevelt
0215-Fran
klin
0213-Clevela
nd
0217-Gran
t
0218-Mad
ison
0126-Wilso
n
0118-Jeffers
on
0154-MLC
0
10
20
30
40
50
60
70
80
90
100HS EUI Comparision Weather Adj.
FY11-12 FY12-13 FY13-14
EUI k
Btu/
Ft2 Target Range
Current Issues

32
Portland Public Schools: Outcomes
jul
aug
sep
oct
nov
dec
jan
feb
mar ap
r
may jun0
10,000
20,000
30,000
40,000
50,000
60,000
70,000
80,000
90,000
0
100
200
300
400
500
600
700
800
900
HDD and MBtu Comparison (FY 13 vs. FY14)
Mbtu FY13 Mbtu FY14 HDD FY13 HDD FY14
Mbt
u
HD
D

33
Portland Public Schools: Outcomes

34
Key Takeaways
• A robust data tracking strategy is a foundation for strategic energy management and pays additional dividends
• Development of a robust tracking system takes time • Dialogue and collaboration with utilities is critical to develop
and implement a streamlined data access solutions• Medium to large entities use a combination of approaches to
gain access to data • A robust analysis tool is critical for “making good use of the data
collected”• An integrated and centralized structure can create a win-win
situation for all stakeholders• It’s important to implement available solutions, while remaining
flexible to adopt new and more efficacious solutions as they become available

35
Contacts
Mona KhalilPolicy and Technical Assistance
Weatherization and Intergovernmental Program
DOE EERE
[email protected]: 202-586-7983
Jeff Hamman, CEMEnergy Specialist
Buildings Operations and Energy Program Manager
Portland Public Schools
WIPState & Local Solution Center