CAS Ratemaking Seminar March 2004 INT-7 Introduction to Profit Provision Calculations
Upload
lauren-lambertCategory
view
214download
0
11
Elliot BurnWyndham Franklin Plaza HotelPhiladelphia, PA
Experience Rating for Excess Of Loss Experience Rating for Excess Of Loss ContractsContracts
2004 CAS Ratemaking Seminar2004 CAS Ratemaking Seminar
March 11-12, 2004March 11-12, 2004

22
OverviewOverview
IntroductionIntroduction Basic Steps of Burning Cost MethodBasic Steps of Burning Cost Method
Loss and Premium AdjustmentsLoss and Premium Adjustments Calculating the Loss Cost & RateCalculating the Loss Cost & Rate Potential Problems with Burning Cost MethodPotential Problems with Burning Cost Method
Alternate Method – Curve FittingAlternate Method – Curve Fitting Potential Problems with Curve FittingPotential Problems with Curve Fitting
Advanced Contract FeaturesAdvanced Contract Features Annual Aggregate DeductiblesAnnual Aggregate Deductibles Reinstatement ProvisionsReinstatement Provisions

33
IntroductionIntroduction

44
IntroductionIntroduction How does experience rating work?How does experience rating work?
Trended losses to a layer are aggregated and Trended losses to a layer are aggregated and developed to “ultimate.”developed to “ultimate.”
Ultimate losses are compared to on-level premium to Ultimate losses are compared to on-level premium to create loss costs.create loss costs.
Loss costs are loaded for profit and expense to Loss costs are loaded for profit and expense to determine final rate.determine final rate.
What is the assumption of experience rating?What is the assumption of experience rating? Historical experience, adjusted properly, is a predictor Historical experience, adjusted properly, is a predictor
of future experience.of future experience.

55
Basic Steps of Burning Basic Steps of Burning Cost MethodCost Method

66
Basic Steps of Burning Cost MethodBasic Steps of Burning Cost Method
1.1. Trend individual loss amounts.Trend individual loss amounts.2.2. Cap at policy limits(?)Cap at policy limits(?)3.3. Distribute individual loss amounts to the layer(s).Distribute individual loss amounts to the layer(s).4.4. Aggregate layer experience by historical treaty period.Aggregate layer experience by historical treaty period.5.5. Apply excess loss development factors.Apply excess loss development factors.6.6. Apply rate changes and exposure trend to on-level the subject Apply rate changes and exposure trend to on-level the subject
premium.premium.7.7. Divide losses by on-level premium to derive historical loss cost.Divide losses by on-level premium to derive historical loss cost.8.8. Load loss cost for expenses and profit to calculate the final rate.Load loss cost for expenses and profit to calculate the final rate.

77
Summary Exhibit– Our GoalSummary Exhibit– Our Goal

88
Loss AdjustmentsLoss Adjustments

99
Loss AdjustmentsLoss Adjustments
ExampleExample: Assume you are trying to obtain a loss cost for : Assume you are trying to obtain a loss cost for the layer $100,000 xs $100,000.the layer $100,000 xs $100,000.

1010
Loss AdjustmentsLoss Adjustments
Step 1: Trend losses.Step 1: Trend losses. What are some sources of trend?What are some sources of trend?
1.1. Actual company data, when sufficient experience is Actual company data, when sufficient experience is available.available.
2.2. External data, such as statistical bureaus or the US External data, such as statistical bureaus or the US Government.Government.

1111
Loss AdjustmentsLoss AdjustmentsSources of Trend Using External Data
Bureau of Labor Statistics – US Department of Labor (BLS)Bureau of Labor Statistics – US Department of Labor (BLS) Consumer Price Indices (CPI)Consumer Price Indices (CPI) Wholesale Price Indices (WPI)Wholesale Price Indices (WPI) Average Weekly Gross Earnings by IndustryAverage Weekly Gross Earnings by Industry
Office of Business Economics – US Department of Commerce (OBE)Office of Business Economics – US Department of Commerce (OBE) National Income and Products Accounts (NIP)National Income and Products Accounts (NIP) Average Per Capita Earnings by IndustryAverage Per Capita Earnings by Industry Average Per Capita Income and ProductAverage Per Capita Income and Product
National Council on Compensation InsuranceNational Council on Compensation Insurance Workers Compensation law amendment rate level changesWorkers Compensation law amendment rate level changes
American Appraisal Company Construction Cost IndexAmerican Appraisal Company Construction Cost Index Boeckh Construction Cost IndexBoeckh Construction Cost Index A.M. Best Aggregates and AveragesA.M. Best Aggregates and Averages

1212
Loss AdjustmentsLoss Adjustments
Step 1: Trend losses.Step 1: Trend losses.
Is this Is this correct?correct?
171,046171,046
““Correct” Correct” Method: Method:
Trend only Trend only portion of portion of loss above loss above
policy policy limit…limit…

1313
Loss AdjustmentsLoss Adjustments
Step 2: Cap Losses at Policy Limits.Step 2: Cap Losses at Policy Limits.
Note that Note that this loss this loss
isn’t isn’t capped…capped…

1414
Loss AdjustmentsLoss Adjustments
Steps 3 & 4: Distribute individual loss amounts to each Steps 3 & 4: Distribute individual loss amounts to each layer and aggregate layer experience by historical layer and aggregate layer experience by historical treaty period.treaty period.

1515
Loss AdjustmentsLoss Adjustments
Loss Development AnalysisLoss Development Analysis Adjust historical losses to an expected Adjust historical losses to an expected ULTIMATEULTIMATE value value Reflects revisions to claim values as claims are settledReflects revisions to claim values as claims are settled Reflects IBNR reportingReflects IBNR reporting Reflects development on reported claimsReflects development on reported claims
Key Factors for ConsiderationKey Factors for Consideration Observation of historical patternsObservation of historical patterns Incurred and paid developmentsIncurred and paid developments Development periodDevelopment period

1616
Loss AdjustmentsLoss Adjustments
Loss Development Analysis
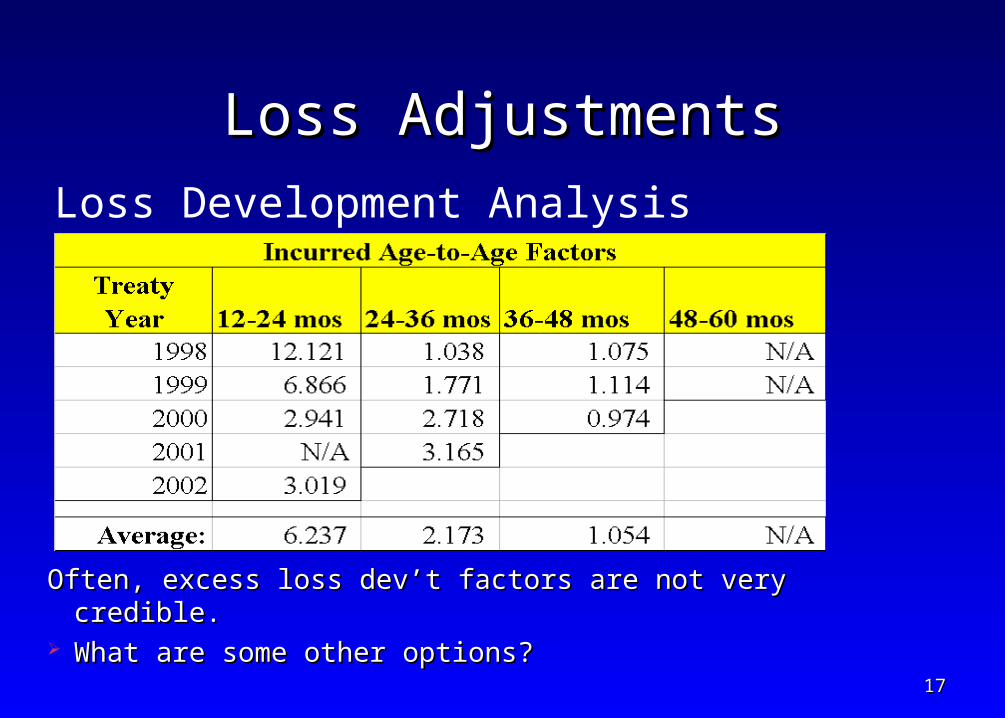
1717
Loss AdjustmentsLoss Adjustments
Loss Development Analysis
Often, excess loss dev’t factors are not very credible.Often, excess loss dev’t factors are not very credible. What are some other options?What are some other options?

1818
Loss AdjustmentsLoss Adjustments
Sources of Excess LDF’s Insurance Services Organization (ISO)
Lines of Business: General Liability, Auto Liability, Medical Professional Liability
Advantages: Homogenous data, numerous layers Disadvantages: Lack of credible high hazard/high layer data (for GL & AL),
Medical Professional Liability data represents small portion of market share Reinsurance Association of America (RAA)
Lines of Business: General Liability, Auto Liability, Medical Professional Liability, and Workers Compensation
Advantages: Represents all data being reinsured, more credible high layer data Disadvantages: Net of retrocessions, may include some mass torts (e.g. breast
implants), losses excess of company retentions
Are Are these these
the only the only sources?sources?
??

1919
Loss AdjustmentsLoss Adjustments
Step 5: Apply excess loss development factors.Step 5: Apply excess loss development factors. Here we Here we are using are using
ISO GL ISO GL factors…factors…

2020
Premium AdjustmentsPremium Adjustments
2121
Premium AdjustmentsPremium Adjustments
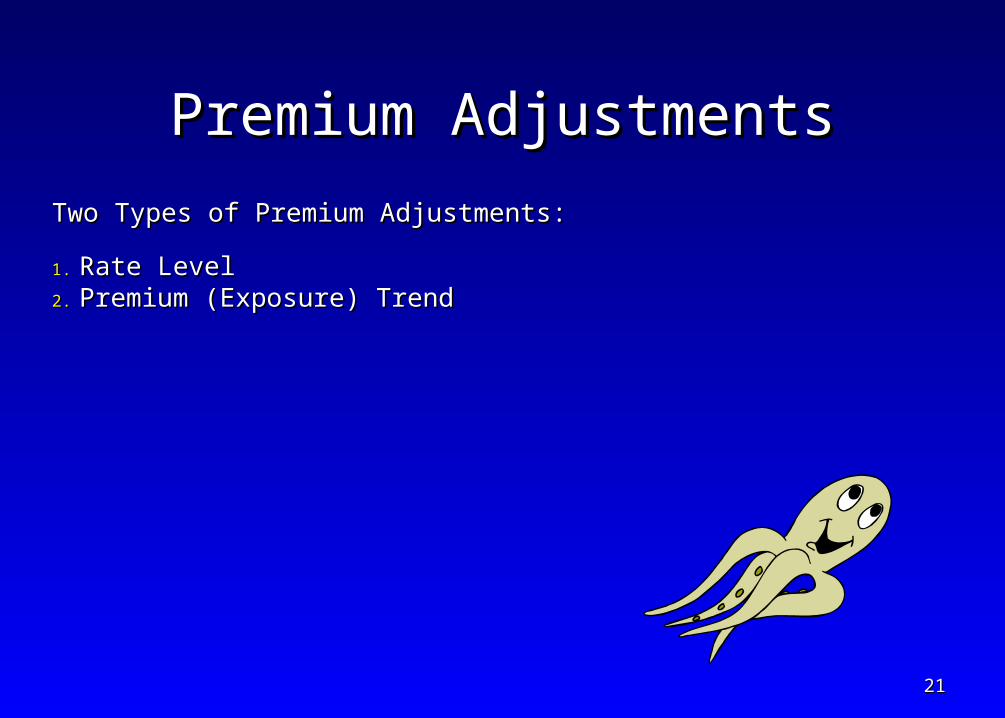
Two Types of Premium Adjustments:Two Types of Premium Adjustments:
1.1. Rate LevelRate Level2.2. Premium (Exposure) TrendPremium (Exposure) Trend
2222
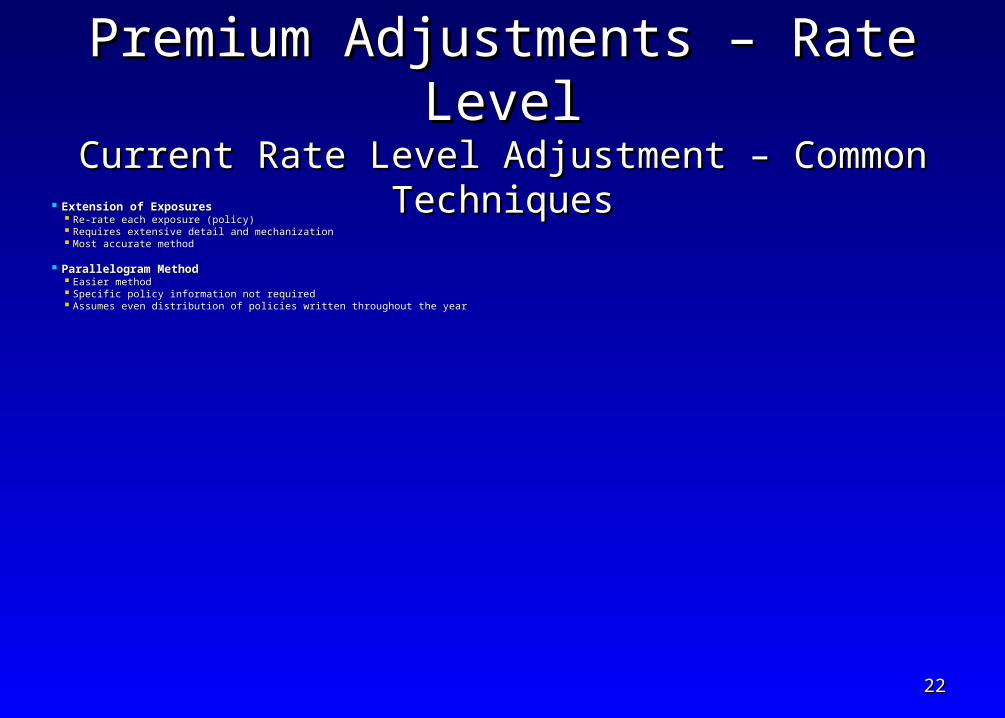
Premium Adjustments – Rate LevelPremium Adjustments – Rate LevelCurrent Rate Level Adjustment – Common TechniquesCurrent Rate Level Adjustment – Common Techniques
Extension of ExposuresExtension of Exposures Re-rate each exposure (policy)Re-rate each exposure (policy) Requires extensive detail and mechanizationRequires extensive detail and mechanization Most accurate methodMost accurate method
Parallelogram MethodParallelogram Method Easier methodEasier method Specific policy information not requiredSpecific policy information not required Assumes even distribution of policies written throughout the yearAssumes even distribution of policies written throughout the year

2323
Premium Adjustments – Rate LevelPremium Adjustments – Rate LevelExtension of Exposures MethodExtension of Exposures Method
Quick ExampleQuick Example::2003 Earned Exposures2003 Earned Exposures
Premium at Current RatesPremium at Current Rates
Current RatesCurrent Rates

2424
Premium Adjustments – Rate LevelPremium Adjustments – Rate LevelParallelogram MethodParallelogram Method
Quick ExampleQuick Example::

2525
Premium Adjustments – Rate Level Premium Adjustments – Rate Level Calculation of On-Level Factor - Parallelogram MethodCalculation of On-Level Factor - Parallelogram Method

2626
Premium Adjustments – Exposure TrendPremium Adjustments – Exposure Trend
What is the purpose of Exposure Trend?What is the purpose of Exposure Trend? To To projectproject the premium level which will exist during the period being priced. The exposure trend will not account for shifts of business. the premium level which will exist during the period being priced. The exposure trend will not account for shifts of business.
Must adjust for items such as: Must adjust for items such as: Average car model year or price groupAverage car model year or price group Average home valueAverage home value SalesSales PayrollPayroll
Don’t we Don’t we already already
account for account for this in the this in the rate level rate level
adjustment?!adjustment?!??

2727
Premium AdjustmentsPremium Adjustments
Step 6: Apply rate changes and exposure trend to on-Step 6: Apply rate changes and exposure trend to on-level the subject premium.level the subject premium.
Back to Back to our our
exampleexample……
2828
Calculating the Loss Calculating the Loss Cost & RateCost & Rate
2929
Calculating the Loss Cost & RateCalculating the Loss Cost & Rate
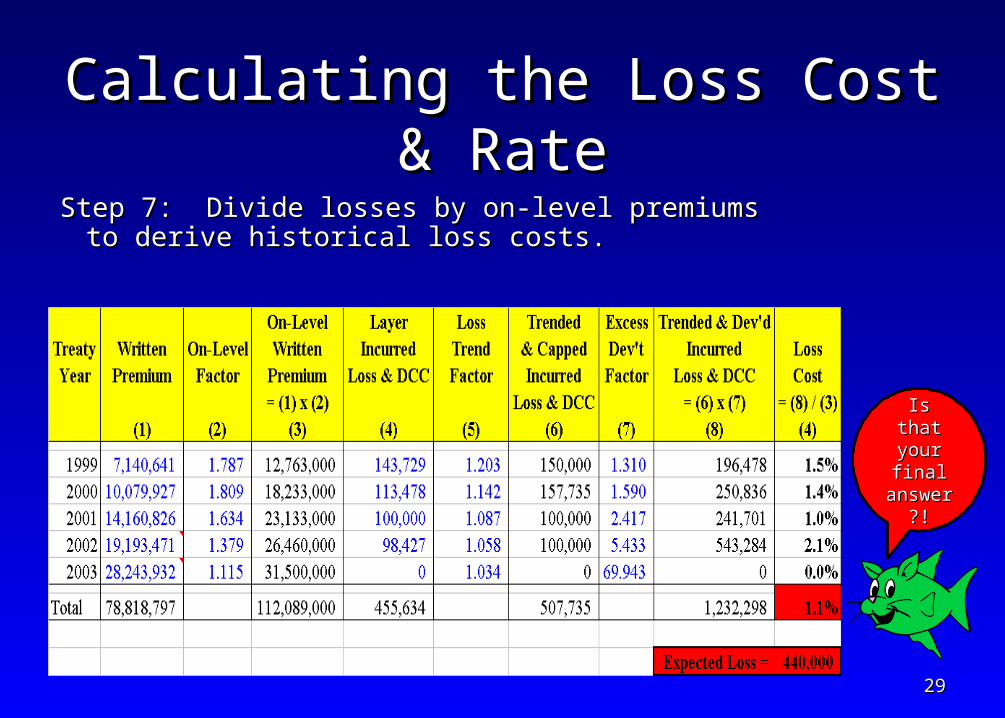
Step 7: Divide losses by on-level premiums to derive Step 7: Divide losses by on-level premiums to derive historical loss costs.historical loss costs.
Is that Is that your your final final
answeranswer?!?!
3030
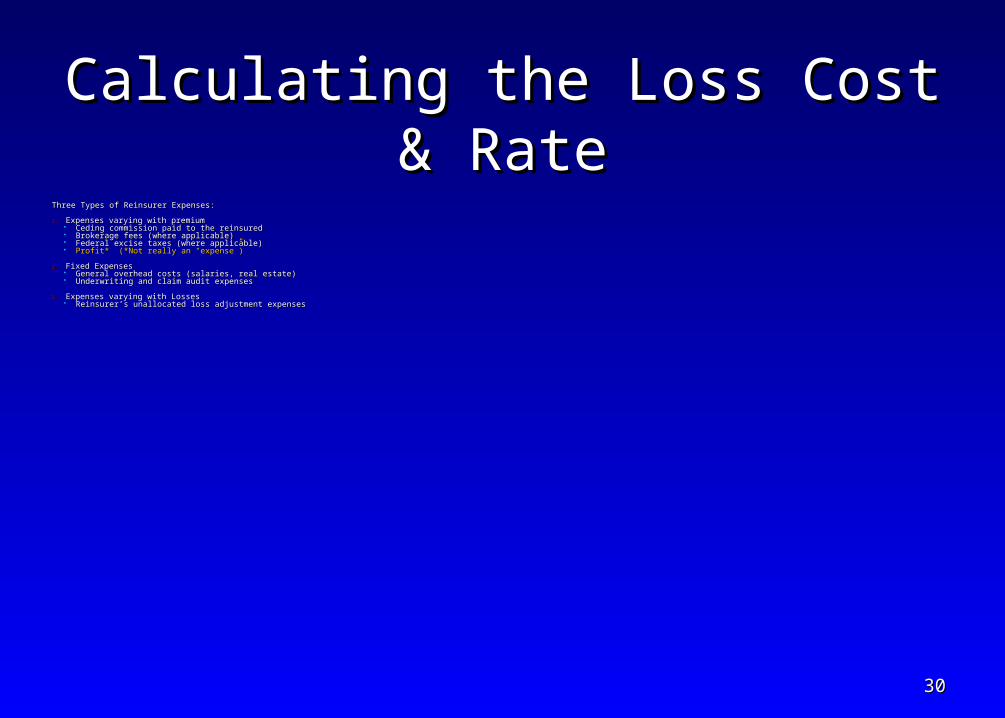
Calculating the Loss Cost & RateCalculating the Loss Cost & RateThree Types of Reinsurer Expenses:Three Types of Reinsurer Expenses:
1.1. Expenses varying with premiumExpenses varying with premium Ceding commission paid to the reinsuredCeding commission paid to the reinsured Brokerage fees (where applicable)Brokerage fees (where applicable) Federal excise taxes (where applicable)Federal excise taxes (where applicable) Profit* (*Not really an “expense”)Profit* (*Not really an “expense”)
2.2. Fixed ExpensesFixed Expenses General overhead costs (salaries, real estate)General overhead costs (salaries, real estate) Underwriting and claim audit expensesUnderwriting and claim audit expenses
3.3. Expenses varying with LossesExpenses varying with Losses Reinsurer’s unallocated loss adjustment expensesReinsurer’s unallocated loss adjustment expenses

3131
Calculating the Loss Cost & RateCalculating the Loss Cost & RateStep 8: Load selected loss cost for expenses to calculate the final premium. Divide by subject premium to determine rate.Step 8: Load selected loss cost for expenses to calculate the final premium. Divide by subject premium to determine rate.
Premium = Premium = [[Expected Loss x (1+ULAE) + Fixed Expenses] Expected Loss x (1+ULAE) + Fixed Expenses] (1 – Variable Expense %)(1-Profit Load)(1 – Variable Expense %)(1-Profit Load)
Back to our Example…Back to our Example… ULAE = 5%ULAE = 5% Fixed Expenses = 10,000Fixed Expenses = 10,000 Variable Expense % = 12%Variable Expense % = 12% Expected Loss = 1.1% x40,000,000 = 440,000Expected Loss = 1.1% x40,000,000 = 440,000 Profit Load = 5%Profit Load = 5% Premium = Premium = [440,000 x(1+0.05)+10,000][440,000 x(1+0.05)+10,000] = 564,593 = 564,593
(1– 0.12)(1-0.05)(1– 0.12)(1-0.05) Rate=Premium/Subject Premium=564,593/40,000,000=Rate=Premium/Subject Premium=564,593/40,000,000=1.4%1.4%

3232
Potential ProblemsPotential Problemswith with
Experience RatingExperience Rating

3333
Potential Problems with Experience Potential Problems with Experience RatingRating
Presence or absence of a few large claims drives the Presence or absence of a few large claims drives the indicated rates.indicated rates.
Order of application of development, trend, and Order of application of development, trend, and capping makes a difference.capping makes a difference.
Trending individual claims past policy limits.Trending individual claims past policy limits. Impact of current policy limit profile vs. historicals.Impact of current policy limit profile vs. historicals. History not reflective of current situation: reserving History not reflective of current situation: reserving
practices, type of business, coverage, etc.practices, type of business, coverage, etc. ““Free cover”Free cover”

3434
Alternate Method – Alternate Method – Curve FittingCurve Fitting

3535
Curve FittingCurve Fitting
What is curve fitting?What is curve fitting? Estimating a parametric frequency distribution and a parametric severity Estimating a parametric frequency distribution and a parametric severity
distribution from given claim data.distribution from given claim data. AssumptionsAssumptions
That a curve fit to the loss data after appropriate adjustments is an That a curve fit to the loss data after appropriate adjustments is an appropriate estimator of future loss.appropriate estimator of future loss.
Frequency and severity are independent.Frequency and severity are independent. What data is required?What data is required?
Large Loss Listing with Policy Limits, Excess of a Truncation PointLarge Loss Listing with Policy Limits, Excess of a Truncation Point Historical & Prospective Exposure BaseHistorical & Prospective Exposure Base On-Leveling FactorsOn-Leveling Factors

3636
Curve FittingCurve Fitting
Common Frequency DistributionsCommon Frequency Distributions PoissonPoisson Negative BinomialNegative Binomial
Common Severity DistributionsCommon Severity Distributions GammaGamma Mixed ExponentialMixed Exponential ParetoPareto
IssueIssue: One curve doesn’t necessarily fit all the data.: One curve doesn’t necessarily fit all the data.

3737
Potential Problems with Curve Potential Problems with Curve FittingFitting
Individual claims either need to be developed to Individual claims either need to be developed to ultimate (which is difficult to do) or are assumed ultimate (which is difficult to do) or are assumed to be at ultimate (not always a good assumption).to be at ultimate (not always a good assumption). Don’t use aggregate LDF’s to develop individual Don’t use aggregate LDF’s to develop individual
losses.losses. How do you determine the # of IBNR claims?How do you determine the # of IBNR claims? One loss distribution often doesn’t fit all of the One loss distribution often doesn’t fit all of the
data.data.

3838
Advanced Advanced Contract FeaturesContract Features

3939
Advanced Contract FeaturesAdvanced Contract Features
Annual Aggregate DeductiblesAnnual Aggregate Deductibles Reinstatement ProvisionsReinstatement Provisions

4040
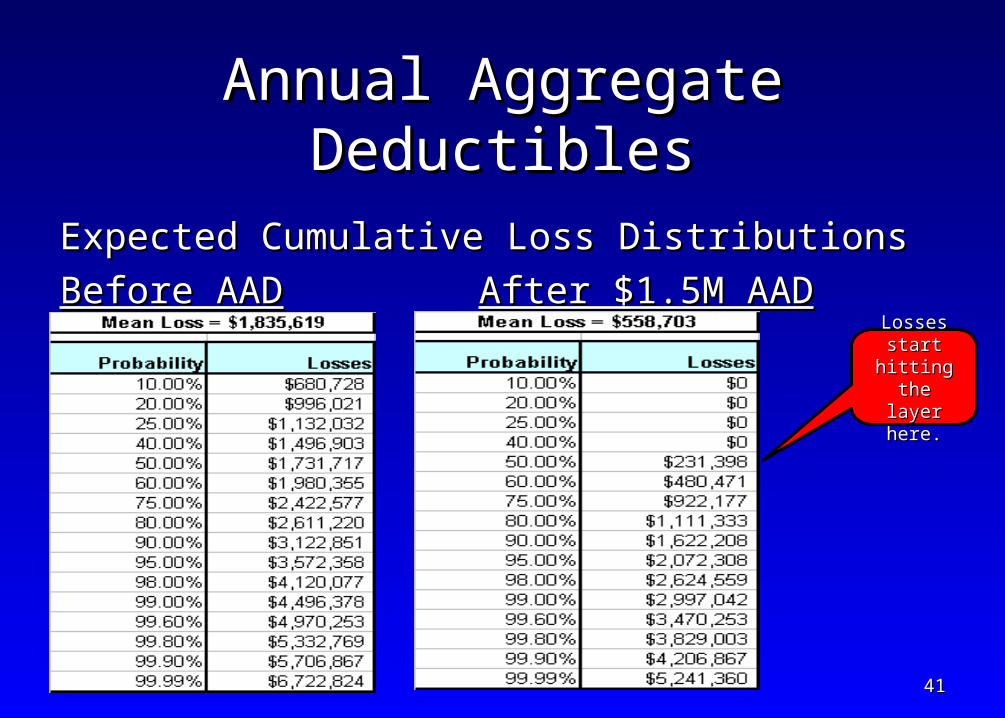
Annual Aggregate DeductiblesAnnual Aggregate Deductibles
What is an Annual Aggregate Deductible (AAD)?What is an Annual Aggregate Deductible (AAD)? When ceding company retains the 1When ceding company retains the 1stst X dollar amount of X dollar amount of
losses per year.losses per year.
Two ways to estimate savings from AAD:Two ways to estimate savings from AAD:1.1. Estimate directly from experience rating if set at Estimate directly from experience rating if set at
sufficiently low level.sufficiently low level.2.2. Better approach: use an aggregate distribution model.Better approach: use an aggregate distribution model.
Important PointImportant Point: Adding an AAD to a contract : Adding an AAD to a contract doesn’t proportionately decrease the expected doesn’t proportionately decrease the expected losses.losses.
4141
Annual Aggregate DeductiblesAnnual Aggregate Deductibles
Expected Cumulative Loss Distributions Expected Cumulative Loss Distributions
Before AADBefore AAD After $1.5M AADAfter $1.5M AADLosses Losses start start
hitting hitting the layer the layer
here.here.

4242
Reinstatement ProvisionsReinstatement Provisions
What is a Reinstatement Provision? What is a Reinstatement Provision? It puts a limit on either the number of occurrences or the It puts a limit on either the number of occurrences or the
aggregate losses that will be paid under a contract.aggregate losses that will be paid under a contract. Free or paidFree or paid ““Pro-rata as to amount” or “pro-rata as to time”Pro-rata as to amount” or “pro-rata as to time”
Reinstatement provisions are typically found on high Reinstatement provisions are typically found on high excess layers, where loss tends to be either 0 or a full excess layers, where loss tends to be either 0 or a full limit loss.limit loss.
Want to use an aggregate distribution model to Want to use an aggregate distribution model to determine the expected # of reinstatements and the determine the expected # of reinstatements and the total expected reinstatement premium.total expected reinstatement premium.

4343
Reinstatement ProvisionsReinstatement Provisions
Example of “Pro-Rata as to Amount” ReinstatementExample of “Pro-Rata as to Amount” Reinstatement Occurrence Limit: $10,000,000Occurrence Limit: $10,000,000 Annual Premium: $3,000,000Annual Premium: $3,000,000 Reinstatement Provision: 110%, pro-rata as to Reinstatement Provision: 110%, pro-rata as to
amountamount Actual Loss Amount: $5,000,000Actual Loss Amount: $5,000,000
Reinstatement Premium = $3,000,000 x 1.10 x 5/10 Reinstatement Premium = $3,000,000 x 1.10 x 5/10 ==$1,650,000$1,650,000

4444
Advanced Contract FeaturesAdvanced Contract Features
Other Aggregate Contract FeaturesOther Aggregate Contract Features Stop-LossStop-Loss Multi-YearMulti-Year
Adjustable FeaturesAdjustable Features Swing-Rated PremiumsSwing-Rated Premiums Sliding Scale CommissionsSliding Scale Commissions Profit CommissionsProfit Commissions Loss CorridorsLoss Corridors Loss CapsLoss Caps
OtherOther

4545
Questions?Questions?

4646
ReferencesReferences
1.1. Clark, David R. “Basics of Reinsurance Pricing,” CAS Clark, David R. “Basics of Reinsurance Pricing,” CAS Study Note,1996.Study Note,1996.
2.2. McClenahan, Charles L. “Ratemaking,” McClenahan, Charles L. “Ratemaking,” Foundations Foundations of Casualty Actuarial Scienceof Casualty Actuarial Science, 1996., 1996.
3.3. Masterson, N.E. “Economic Factors in Liability and Masterson, N.E. “Economic Factors in Liability and Property Insurance Claim Costs, 1935-1967,” Property Insurance Claim Costs, 1935-1967,” Proceedings of the Casualty Actuary Society, 1968.Proceedings of the Casualty Actuary Society, 1968.