1. ECOWAS’s Infrastructure: A Regional Perspective.
81
1
-
Upload
pamela-harper -
Category
Documents
-
view
217 -
download
0
Transcript of 1. ECOWAS’s Infrastructure: A Regional Perspective.

1

ECOWAS’s Infrastructure: A Regional Perspective
Africa Infrastructure Country Diagnostic:a multi-stakeholder effort

Methodology and approach
Methodology Data collection by local/international consultants and Bank staff
based on standardized methodology Baseline year for data is 2006, does not reflect subsequent
evolution
Approach Focus on benchmarking ECOWAS’s infrastructure against other
African RECs and benchmarking ECOWAS member countries with each other

Key Message #1
Infrastructure could be contributing much more to
West Africa’s growth

Infrastructure contributed one percentage point to West Africa’s recent growth spurt

Catching-up on infrastructure could boost growth by five percentage points
0
1
2
3
4
5
6
No
rth
Afric
a
We
st
Afric
a
Ea
st
Afric
a
So
uth
ern
A
frica
Ce
ntra
l A
frica
Afric
a
Pote
ntial
gro
wth
pc b
enefi
ts d
ue to
infr
astr
uctu
re
deve
lopm
ent
Telecom Power Roads

Key Message #2
West Africa’s economic geography makes regional
integration particularly critical
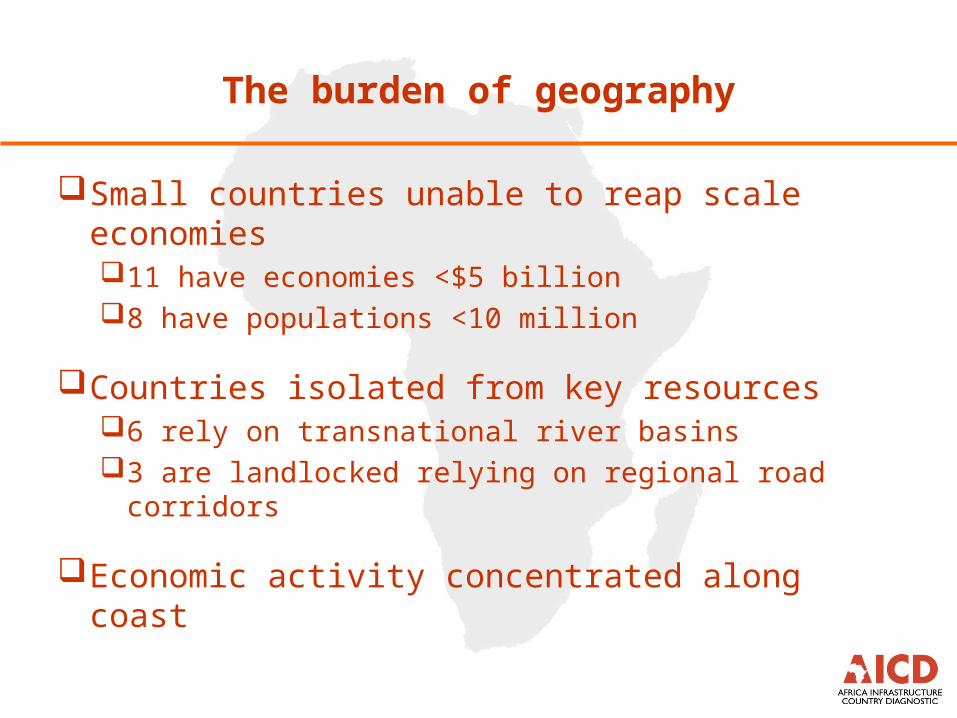
The burden of geography
Small countries unable to reap scale economies11 have economies <$5 billion8 have populations <10 million
Countries isolated from key resources6 rely on transnational river basins3 are landlocked relying on regional road corridors
Economic activity concentrated along coast

Topographical profile of ECOWAS countries

Spatial distribution of economic activity

Key Message #3
Soft issues are the main culprits for West Africa’s slow and
expensive road freight

Road freight transport is particularly slow and expensive in West Africa
CorridorLength (kms)
Road in good condition (%)
Trade density
(US$m per km)
Implicit velocity(km
/hr)
Freight tariff ($US/tonne-km)
Western 2050 72 8.2 6.0 0.08
Central 3280 49 4.2 6.1 0.13
Eastern 2845 82 5.7 8.1 0.07
Southern 5000 100 27.9 11.6 0.05

Corridors are almost entirely paved and mainly in reasonable condition
Corridors Good (%) Fair (%) Poor (%) Paved (%)
Abidjan-Lagos 51 28 21 99Tema-Ouagadougou-
Bamako 67 31 2 100
Dakar-Bamako 48 20 32 100
Abidjan-Ouagadougou 33 23 44 100
Lome-Niamey 50 30 20 100
Cotonou-Niamey 50 8 42 99
Nouakchott-NDjamena 63 21 16 97

Condition of 7 main regional corridors

Only two of the corridors register reasonably high volumes of traffic
Percentage in traffic bands (AADT)
Corridors <300 300-1000 >1000
Abidjan-Lagos 55 1 44
Tema-Ouagadougou-Bamako 49 26 25
Dakar-Bamako 24 56 20
Abidjan-Ouagadougou 4 23 73
Lome-Niamey 0 83 17
Cotonou-Niamey 4 26 70
Nouakchott-N'Djamena 11 46 43

Traffic flows along 7 main regional corridors
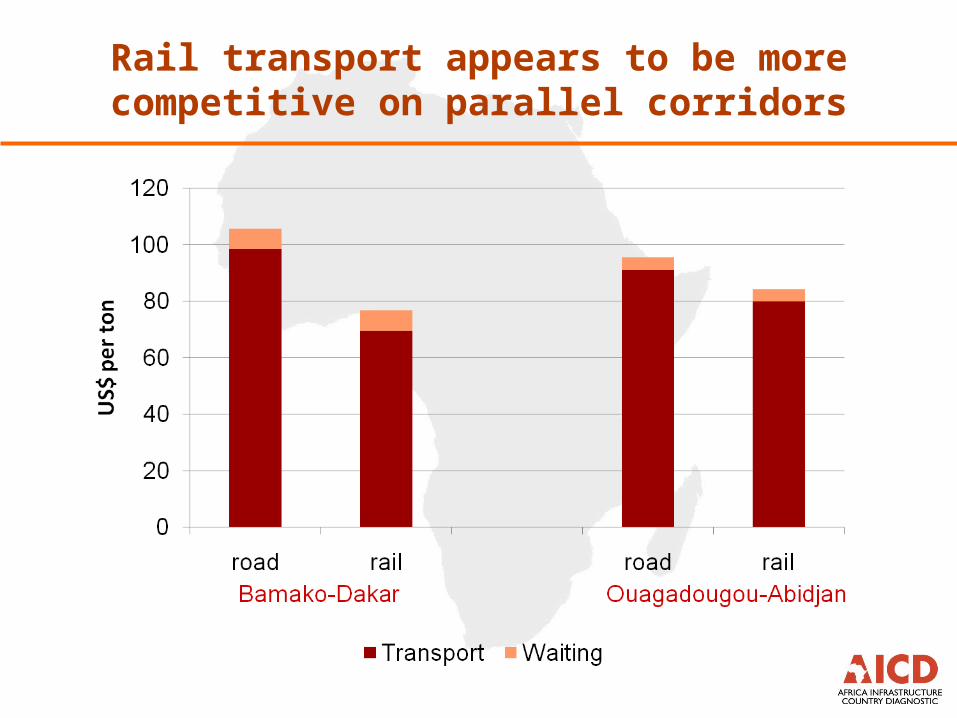
Rail transport appears to be more competitive on parallel corridors

Administrative and waiting costs add at least $20 per ton to costs of exporting via sea ports

Administrative and waiting costs weigh even more heavily on imports

Key Message #4
Coastal countries appear to be neglecting roads on sea
corridors
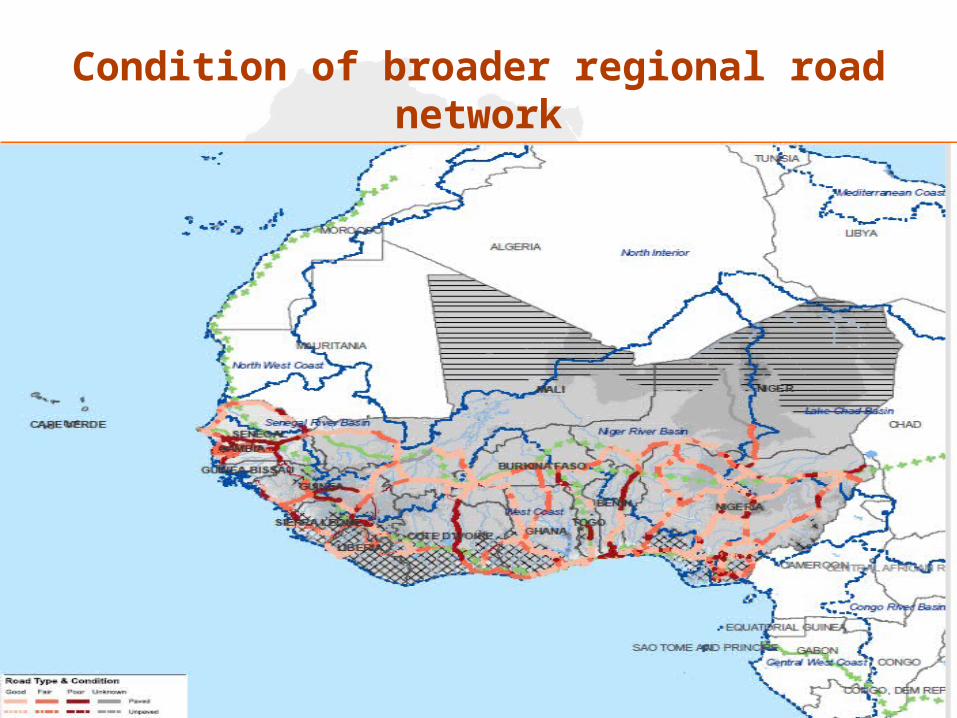
Condition of broader regional road network
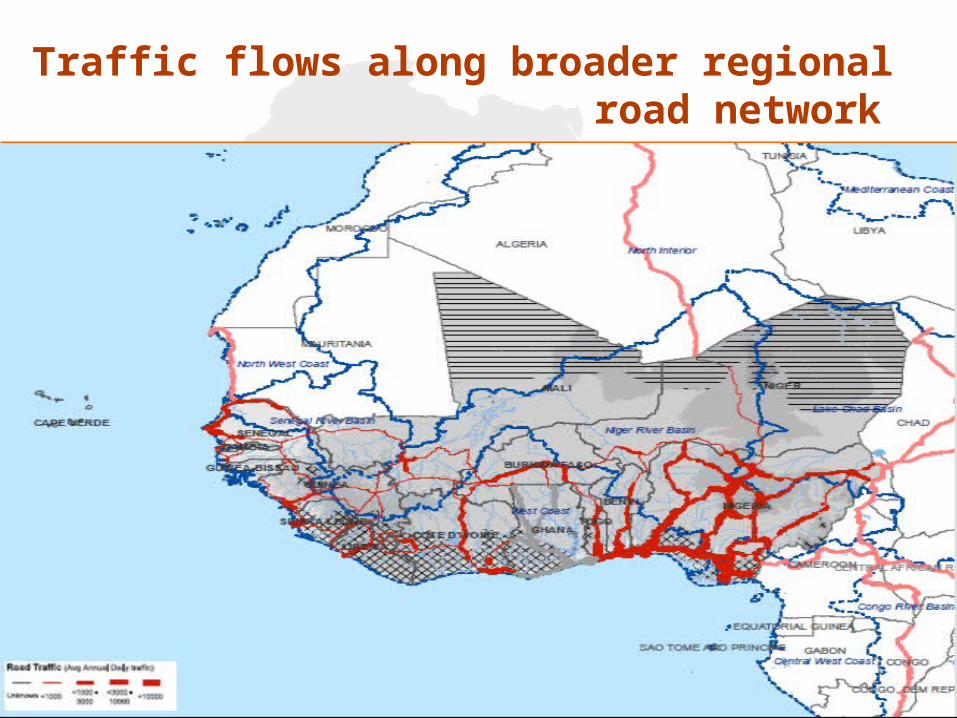
Traffic flows along broader regional road network

Some 80 percent of broader regional roads in reasonable condition
Condition Type Good (%) Fair (%) Paved (%)
Benin 35.8 1.8 96.8Burkina Faso 58.2 33.6 100Cape Verde 0 0 0Côte d'Ivoire 16.1 47.1 90.3Gambia 0 89.4 47.4Ghana 70.3 23.6 100Guinea 22.2 20.7 89.1Liberia 39.4 55.9 47.5Mali 66.6 21.7 99.6Niger 31.2 31 88Nigeria 55.6 29.7 100Senegal 39.8 15.1 99.8Sierra Leone 19.5 58.4 33.6Togo 49.7 0 100ECOWAS 45.1 28.4 92.5

Key Message #5
West Africa’s railways do not readily form a regional network

West Africa’s disparate rail networks make use of multiple incompatible gauges

Operational performance of West African rail operators is relatively poor
Labor productivity
Locomotive productivity
Carriage productivity
Wagon productivity
Average passenger
yield
Average freight yield
Benin, OCBN 40 3 900 742 5.8
Burkina Faso – Côte d’Ivoire, SITARAIL 481 35 1,020 3.3 5.5
Ghana, GRC 84 7 416 458 2.4 4.4
Mali – Senegal, Transrail 339 40 804
2.2 6.4
Nigeria, NRC 37 13 737 59 ─ ─
SSA average for railways under concession 387 24 2,945 510
2.2 6.3

Railways are only lightly used

Key Message #6
West Africa lacks a functional transshipment hub

West African ports perform well behind global best practice
East Africa Southern Africa
West /Central Africa
Global best practice
Performance
Container Dwell Time (days) 5–28 4–8 11–30 <7
Truck Processing Time (hours) 4–24 2–12 6–24 1
Crane Productivity (containers per hour) 8–20 8–22 7–20 20–30
Crane Productivity (tonnes per hour) 8–25 10–25 7–15 >30
Charges
Container handling (US$ per TEU) 135–275 110–243 100–320 80–150
General cargo handling charge (US$ per tonne) 6–15 11–15 8–15 7–9
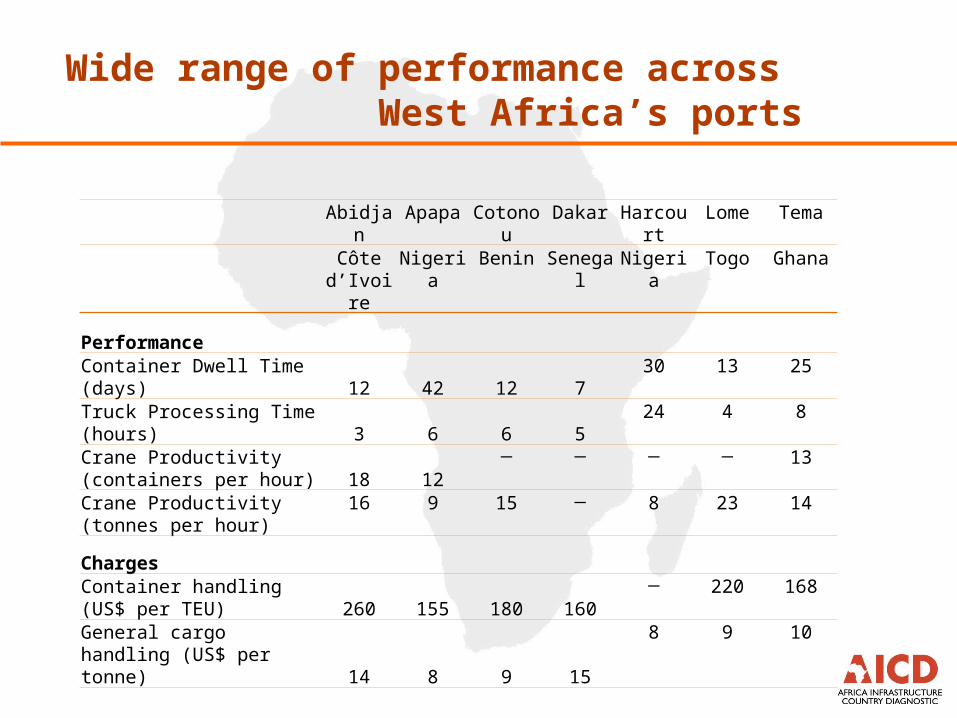
Wide range of performance across West Africa’s ports
Abidjan Apapa Cotonou Dakar Harcourt Lome Tema
Côte
d’IvoireNigeria Benin Senegal Nigeria Togo Ghana
Performance
Container Dwell Time (days) 12 42 12 730 13 25
Truck Processing Time (hours) 3 6 6 5
24 4 8
Crane Productivity (containers per hour) 18 12
─ ─ ─ ─ 13
Crane Productivity (tonnes per hour)
16 9 15 ─ 8 23 14
Charges
Container handling (US$ per TEU) 260 155 180 160
─ 220 168
General cargo handling (US$ per tonne) 14 8 9 15
8 9 10
Key Message #7
Major progress with liberalization but safety remains a concern

ECOWAS performs below African comparators on several air transport benchmarks

Uneven development of air connectivity across Western and Eastern sides of continent

Regional air traffic heavily concentrated on Accra to Lagos route

Most countries have daily flight to one of region’s significant airports
Ben
in
Bur
kina
Fas
o
Cap
e V
erde
Cot
e D
'Ivoi
re
Gam
bia
Gha
na
Gui
nea
Gui
nea-
Bis
sau
Libe
ria
Mal
i
Nig
er
Nig
eria
Sen
egal
Sie
rra
Leon
e
Togo
Benin 5 10 5 1 1 4 3 4
Burkina Faso 4 8 3 9 1 6 4
Cape Verde 1 1
Cote D'Ivoire 10 11 22 9 3 8 4 8 14 1 14
Gambia 4 4 2 12 4
Ghana 1 3 1 23 13 41 9 8
Guinea 8 4 2 1 2 7
Guinea-Bissau 1 9
Liberia 3 5 9 2 3 3
Mali 1 7 4 3 18
Niger 1 1 4 4 2
Nigeria 3 8 2 46 2 2 5 4
Senegal 3 6 7 14 11 7 9 1 16 2 5 4 2
Sierra Leone 1 5 7 6 3 4
Togo 5 4 15 4 1 2
Destination
Orig
in

Major shift in fleet size towards Citi jets and commuter propeller planes

Differential responses to collapse of major regional carriers

West Africa has made most progress with air transport liberalization
CommunityGeneral status of YD implementation
Status of air services liberalizationOverall implementation score
AMU No implementation. No liberalization within the AMU initiated, but need is recognized. 1
BAGPrinciples of the YD agreed upon in a multilateral air services agreement.
Up to fifth freedom granted, tariffs are free, and capacity/frequency is open.
4
CEMACPrinciples of the YD agreed upon in an air transport program. Some minor restrictions remain.
Up to fifth freedom granted, tariffs are free, and capacity/frequency is open. Maximum two carriers per state may take part.
5
COMESA
Full liberalization agreed upon (“legal Notice No. 2”), but application and implementation remain pending until a joint competition authority is established.
Pending. Operators will be able to serve any destination (all freedoms), and tariffs and capacity/frequency will be free.
3
EACEAC council issued a directive to amend bilaterals among the EAC states to conform with the YD.
Air services are not liberalized, as the amendments of bilaterals remain pending. 3
SADC
No steps taken toward implementation, although the civil aviation policy includes gradual liberalization of air services within the SADC.
No liberalization has been initiated. 2
WAEMU The YD is fully implemented.All freedoms, including cabotage, granted. Tariffs have been liberalized.
5
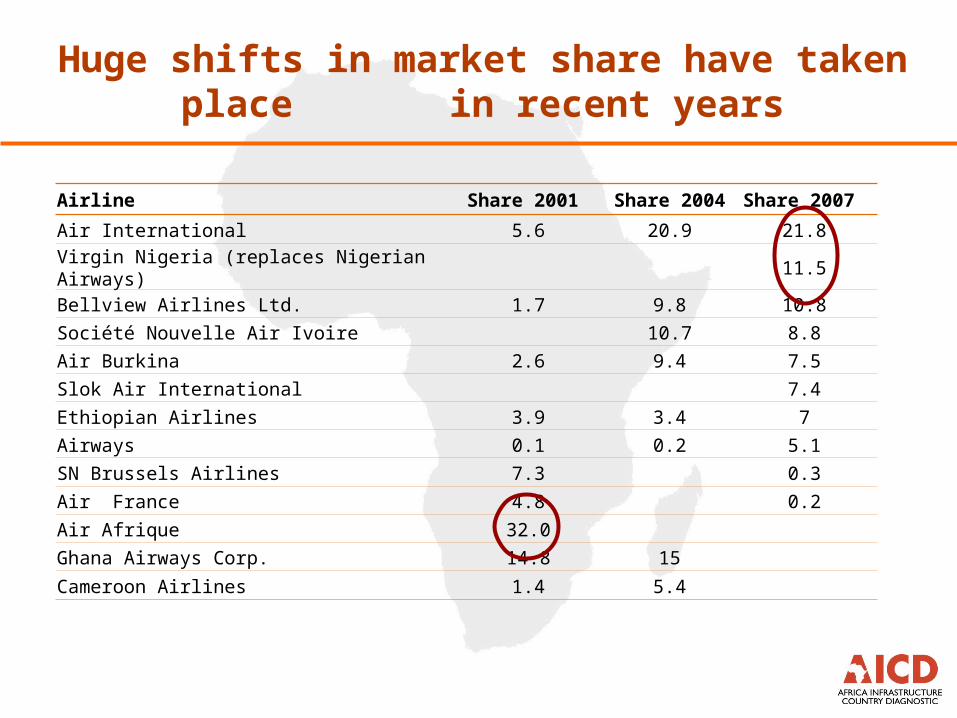
Huge shifts in market share have taken place in recent years
Airline Share 2001 Share 2004 Share 2007
Air International 5.6 20.9 21.8
Virgin Nigeria (replaces Nigerian Airways) 11.5
Bellview Airlines Ltd. 1.7 9.8 10.8
Société Nouvelle Air Ivoire 10.7 8.8
Air Burkina 2.6 9.4 7.5
Slok Air International 7.4
Ethiopian Airlines 3.9 3.4 7
Airways 0.1 0.2 5.1
SN Brussels Airlines 7.3 0.3
Air France 4.8 0.2
Air Afrique 32.0
Ghana Airways Corp. 14.8 15
Cameroon Airlines 1.4 5.4

Air safety standards in West Africa are low

West Africa’s aircraft fleet has renewed significantly

Airport charges in West Africa are significantly higher than international standards

Key Message #8
Regional power trade could save US$0.5 billion annually as well as 5 million tons of CO2
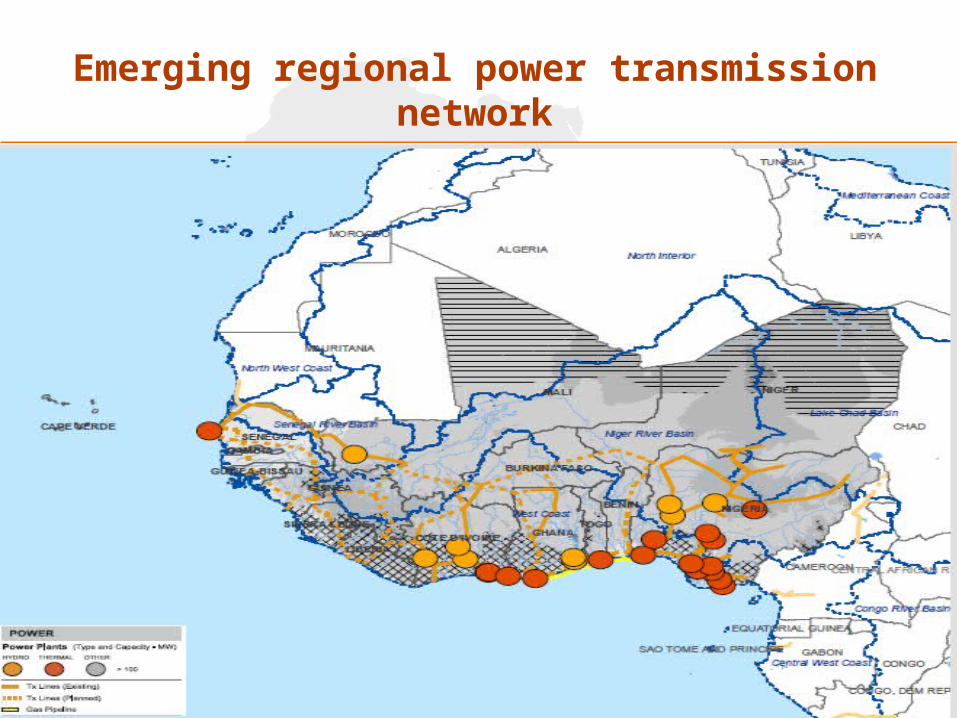
Emerging regional power transmission network

Power is widely accessible but highly expensive and unreliable

Only 70 percent of the effective demand for power is being met
Country Total net demand in 2005
% of suppressed demand as a total of net demand
Market demand 2015*
Social demand with national targets 2015
Total net demand 2015
Benin 0.6 94 0.9 0.8 1.7Burkina Faso 0.5 98 0.6 0.9 1.5Cote d’Ivoire 2.9 88 4.0 1.4 5.4Gambia 0.1 78 0.2 0.2 0.4Ghana 5.9 85 10.8 2 12.8
Guinea 0.7 76 1.3 0.8 2.2Guinea-Bissau 0.1 88 0.1 0.1 0.2Liberia 0.3 71 0.6 0.7 1.3Mali 0.4 95 0.6 1.2 1.8Mauritania 0.2 98 0.5 0.3 0.8Niger 0.4 98 0.6 0.7 1.2Nigeria 16.9 61 45.6 13.6 59.2Senegal 1.5 85 2.5 1 3.5Sierra Leone 0.2 51 0.5 0.5 1Togo 0.6 89 0.8 0.7 1.5WAPP 31.3 70 69.6 24.8 94.3SAPP 258.8 99 383 14 396.9EAPP/NB* 100.6 99 144.8 24.2 169CAPP 10.7 92 17.1 3.1 20.2

Today there are two major power traders: Cote d’Ivoire and Ghana
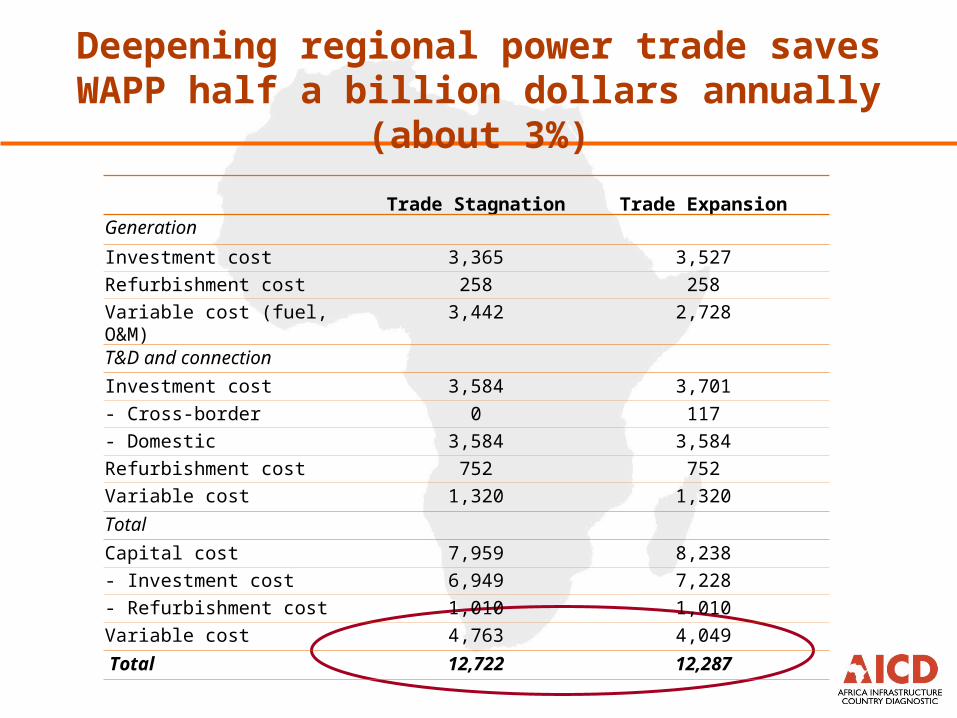
Deepening regional power trade saves WAPP half a billion dollars annually (about 3%)
Trade Stagnation Trade ExpansionGeneration
Investment cost 3,365 3,527
Refurbishment cost 258 258
Variable cost (fuel, O&M) 3,442 2,728
T&D and connection
Investment cost 3,584 3,701
- Cross-border 0 117
- Domestic 3,584 3,584
Refurbishment cost 752 752
Variable cost 1,320 1,320
Total
Capital cost 7,959 8,238
- Investment cost 6,949 7,228
- Refurbishment cost 1,010 1,010
Variable cost 4,763 4,049
Total 12,722 12,287

Trade expansion would boost volume of power traded from 5 TWh to over 15 TWh
Trade Expansion Trade Stagnation

Many countries need to invest in cross-border interconnectors and mainly Guinea in hydro
WAPPNew Cross Border
Transmission Additional hydroBenin 160 0Burkina Faso 0 0Cote d’Ivoire 2,226 0Gambia 19 0Ghana 979 0
Guinea 2,283 3,711Guinea Bissau 818 0Liberia 258 0Mali 2,703 0Mauritania 79 0Niger 206 0Nigeria 366 0Senegal 487 29Sierra Leone 661 0Togo 5 18
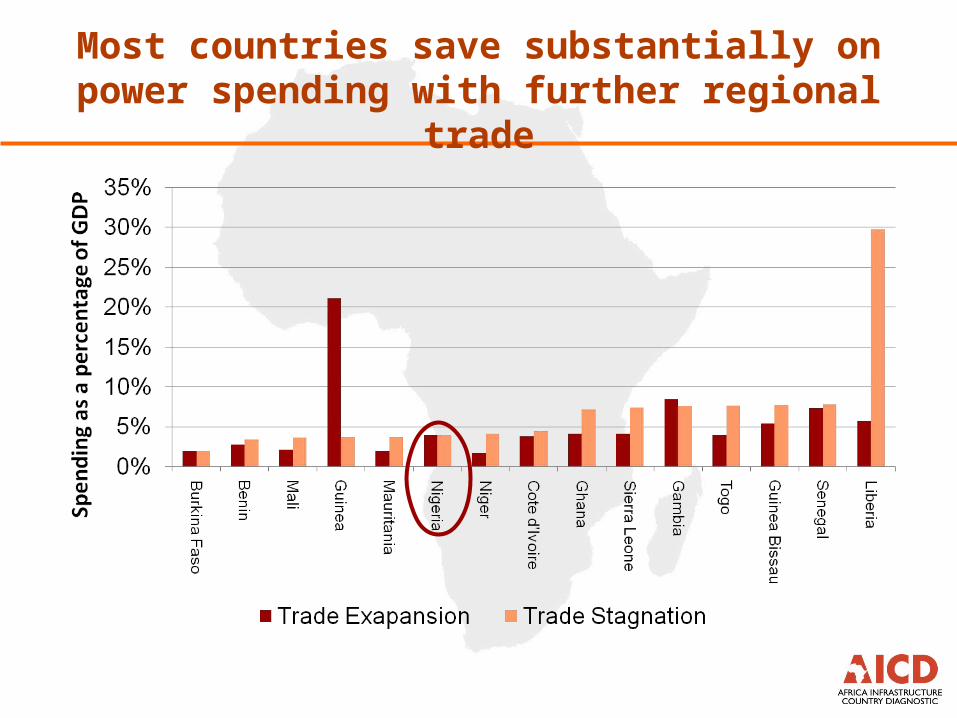
Most countries save substantially on power spending with further regional trade
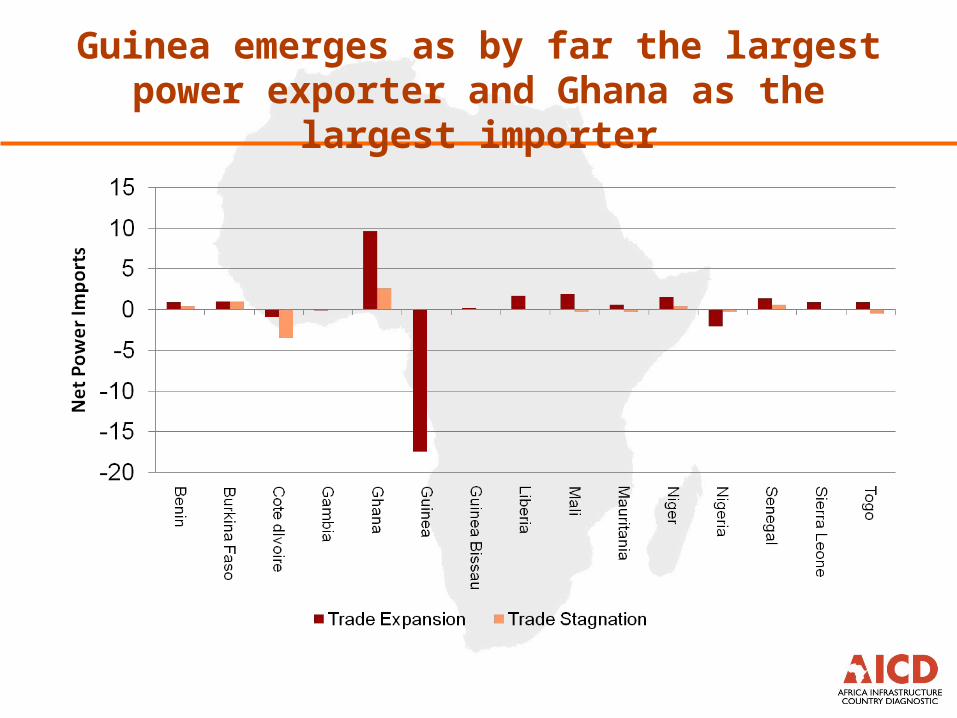
Guinea emerges as by far the largest power exporter and Ghana as the largest importer

Many WAPP countries would import more than half their power needs
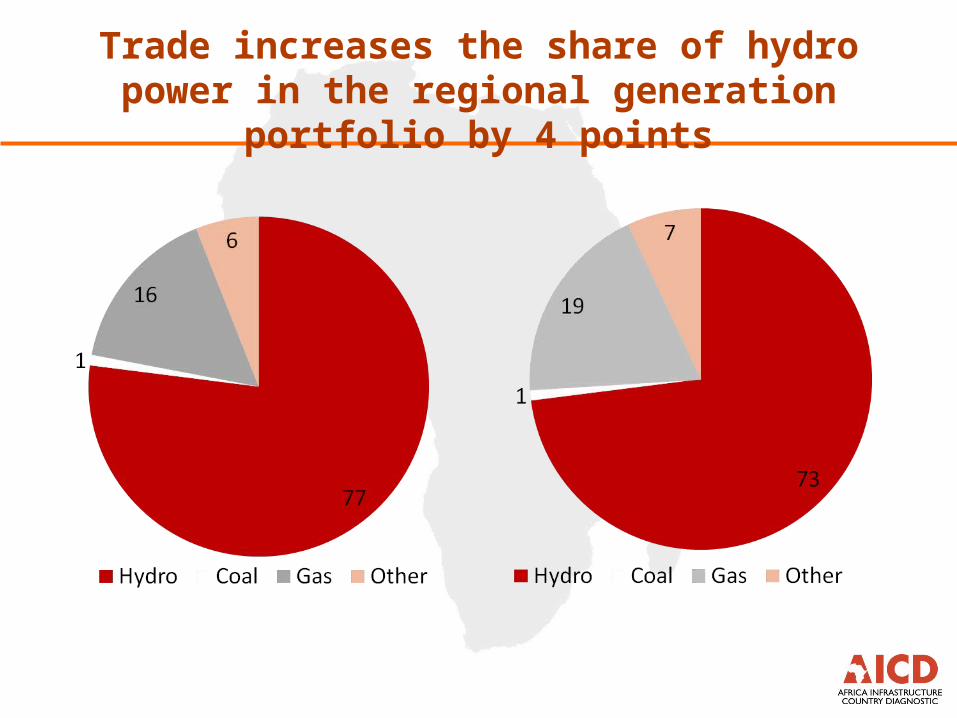
Trade increases the share of hydro power in the regional generation portfolio by 4 points

Increasing hydro brings annual savings of 5 million tons of CO2
WAPP SAPP EAPP CAPP Total WAPP SAPP EAPP CAPP Total
Production difference (TWh) Emissions savings (M ton)
Coal -41.5 0.7 -40.8 -37.8 0.6 -37.2
Diesel -0.8 -0.3 0.3 -0.8 -0.6 -0.2 0.2 -0.6
Gas -9.2 -5.3 -42.4 -56.8 -4.7 -2.7 -21.5 -28.9
HFO 0.2 0.4 -4.9 -4.3 0.1 0.3 -3.6 -3.2
Hydro 11.5 47.5 43.4 5.1 107 0
Total 1.6 0.5 2.4 0.3 4.7 -5.2 -40.7 -20.4 -3.6 -69.9

Trade leads to substantial savings in LRMC of power particularly for some smaller countries
(US cents/kWh)
Trade expansion
Trade stagnation
Absolute differential
Percentage differential
CAPP 7 9 -2 -22EAPP 12 12 0 0SAPP 6 7 -1 -14WAPP 18 19 -1 -5Benin 19 19 0 0
Burkina Faso 25 26 -1 -4
Cote d’Ivoire 15 15 0 0Gambia 8 7 1 14Ghana 10 10 0 0Guinea 7 6 1 17
Guinea-Bissau 9 16 -7 -44Liberia 8 14 -6 -43Mali 25 28 -3 -11Mauritania 14 15 -1 -7Niger 25 30 -5 -17Nigeria 13 13 0 0Senegal 43 47 -4 -9
Sierra Leone 9 10 -1 -10Togo 10 11 -1 -9

Rate of return on interconnectors can be very high
CountryUnit gain
(US $ KWh)Net power trade
(TWh) Annual benefits
(US$m pa)
One time investment
(US$m)
Rate of return
(%)
EXPORTERS
Guinea 0.07 17.4 1462 7,860 19
IMPORTERS
Mauritania 0.01 0.8 8 100 8
Sierra Leone 0.01 1 10 70 14
Mali 0.03 1.8 54 260 21
Guinea Bissau 0.07 0.2 14 50 28
Liberia 0.06 1.3 78 20 390
Senegal 0.04 3.5 140 30 467
Key Message #9
Relatively good access to signal and cables, yet prices remain
high, more competition needed

West Africa’s regional fiber optic backbone is taking shape

Access to ICT is relatively good but the region faces high prices for critical services
ECOWAS CEMAC COMESA EAC SADC
Broadband subscribers (per 100 inhabitants) 0.03 0.01 0.04 0.02 0.36
International Internet bandwidth (per capita) 16 11 9 11 19
Internet subscribers (per 100 inhabitants) 0.24 0.06 0.09 0.05 0.53
Main telephone lines outside largest city (per 100 inhabitants) 0.39 0.2 0.53 0.24 1.89
Mobile telephone subscribers (per 100 inhabitants) 25 22 12 21 31
Prices (US$)
Prepaid mobile monthly price basket 14.04 15.11 9.09 12.18 11.32
Price of a 3 minute call to USA 0.83 5.68 2.2 1.37 1.5
Price of the 20 hour Internet basket 79.98 67.97 50.91 95.7 75.6
Price of the fixed telephone monthly price basket 9.35 12.59 6.85 13.33 13.27
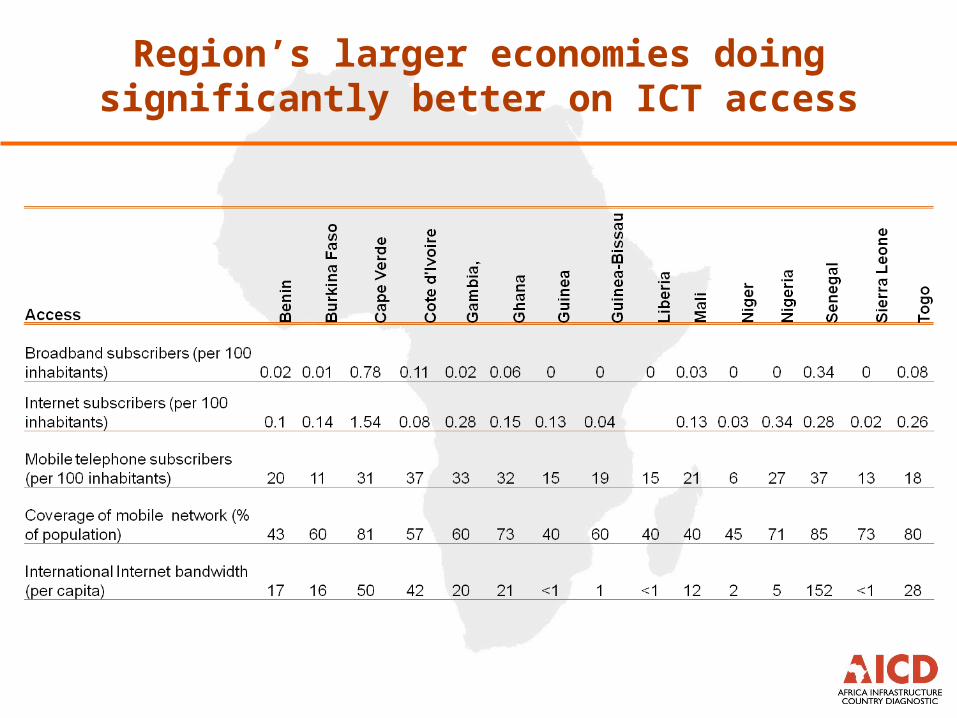
Region’s larger economies doing significantly better on ICT access

Wide range of price levels across West Africa

In some countries, it is cheaper to call the US than to call within ECOWAS

West Africa relatively well-advanced on regional roaming agreements
To
From
Benin * n * n n n n * * n * * *
Burkina Faso * * * * * * * * *
Cape Verde PO PO PO PO PO PO PO PO PO PO
Côte d'Ivoire n l l l l n n n l l l l l l
Gambia PO PO PO PO PO PO PO PO PO PO PO PO
Ghana n n PP n n n PP PP PP
Guinea n * n * n n n l l n l *
Guinea-Bissau n * n * n n n l l n l
Liberia n n * n n n n
Mali PP PP l PP PP l l l PO l PO PP
Niger * l * l l l l
Nigeria n n PO n n n PO PO PO
Senegal PP PP PO l PP PO l l PO l l PP PO PP
Sierra Leone * * * * * * * * * *
Togo PO PO PO PO PO PO PO
ONE (Zain)
Orange Zone l l l l l l l
One World (MTN) n n n n n n n n
Sen
eg
al
Sie
rra
Leo
ne
To
go
Gu
inea
Gu
inea
-Bis
sa
u
Lib
eria
Ma
li
Nig
er
Nig
eria
Ben
in
Bu
rk
ina
Fa
so
Ca
pe V
erd
e
Cô
te d
'Iv
oir
e
Ga
mb
ia
Gh
an
a

Large mobile groups dominate the regional telecom market
Country
Eti
sala
t
(U
AE
)
Fra
nce
Tel
eco
m
Ma
roc
Tel
eco
m
Mil
lico
m
(Lu
xem
bo
urg
)
MT
C (
Za
in,)
( K
uw
ait
)
MT
N
(S
ou
th A
fric
a)
Co
miu
m
(Leb
an
on
)
Oth
er
TO
TA
L
Other note Benin 51% 75% 1 3 Globacom (Nigeria) Burkina Faso 51% 51% 100% 3 Cape Verde 2 2 Portugal Telecom (40%)
Teylium (Cote d'Ivoire) (70%) Cote d'Ivoire * 85% 65% * 1 5 Warid (UAE) Gambia * 3 Other=Lintel (Lebanon,
100%) Ghana 100% 75% 98% 2 5 Globacom (Nigeria)
Vodafone (UK) (70%) Guinea 38% 75% 2 4 Teylium (Cote d'Ivoire)
Cellcom (US) Guinea Bissau
42% 100% 2
Liberia 60% * 1 3 Cellcom (US) Mali 30% 51% 2 Niger 57% 80% 90% * 4 Other=ZTE (China) and LAP
(Libya) Nigeria 40% 66% 76% 3 Senegal 42% 100% 3 Sudatel (Sudan) (100%) Sierra Leone 100% * * 2 Other=Lintel (Lebanon,
100%) Togo * 1 TOTAL 6 6 2 2 5 7 4
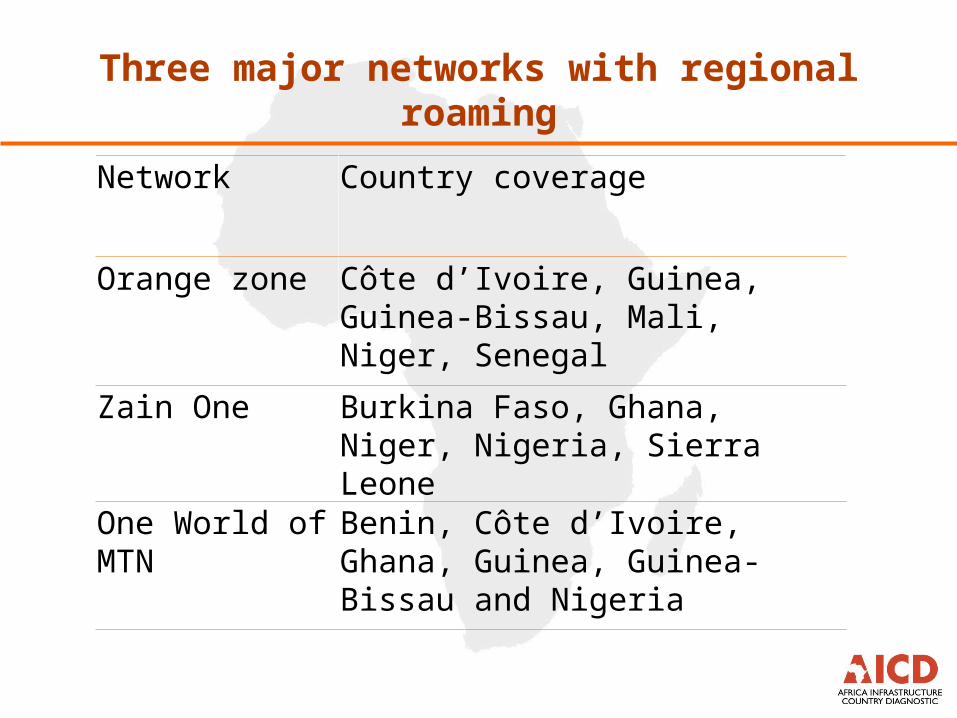
Three major networks with regional roaming
Network Country coverage
Orange zone Côte d’Ivoire, Guinea, Guinea-Bissau, Mali, Niger, Senegal
Zain One Burkina Faso, Ghana, Niger, Nigeria, Sierra Leone
One World of MTN
Benin, Côte d’Ivoire, Ghana, Guinea, Guinea-Bissau and Nigeria
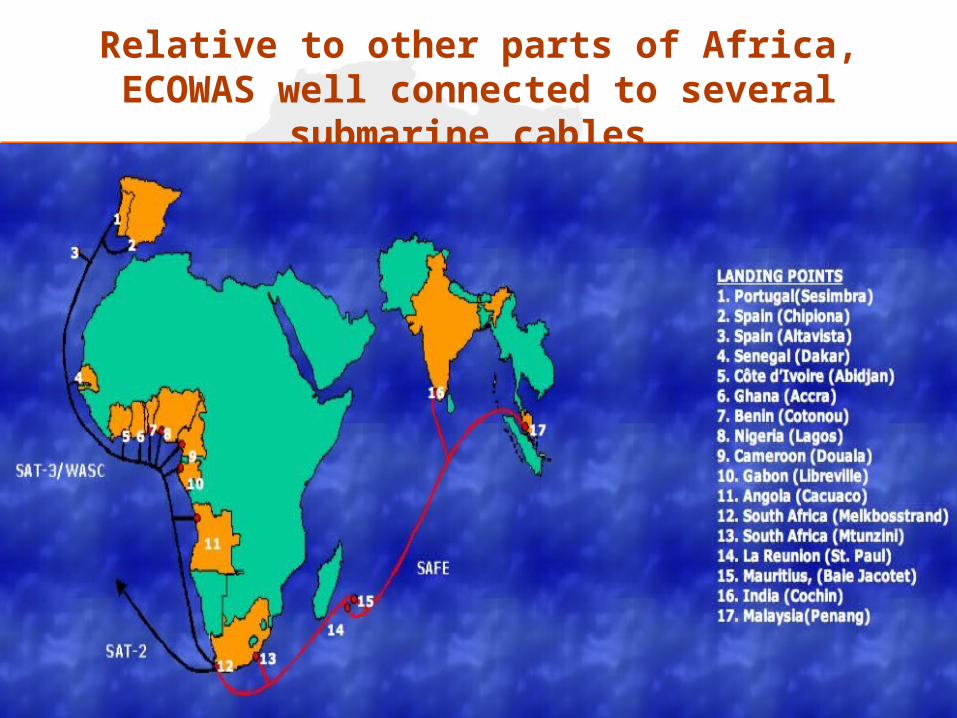
Relative to other parts of Africa, ECOWAS well connected to several submarine cables

However, many countries remain unconnected to submarine infrastructure
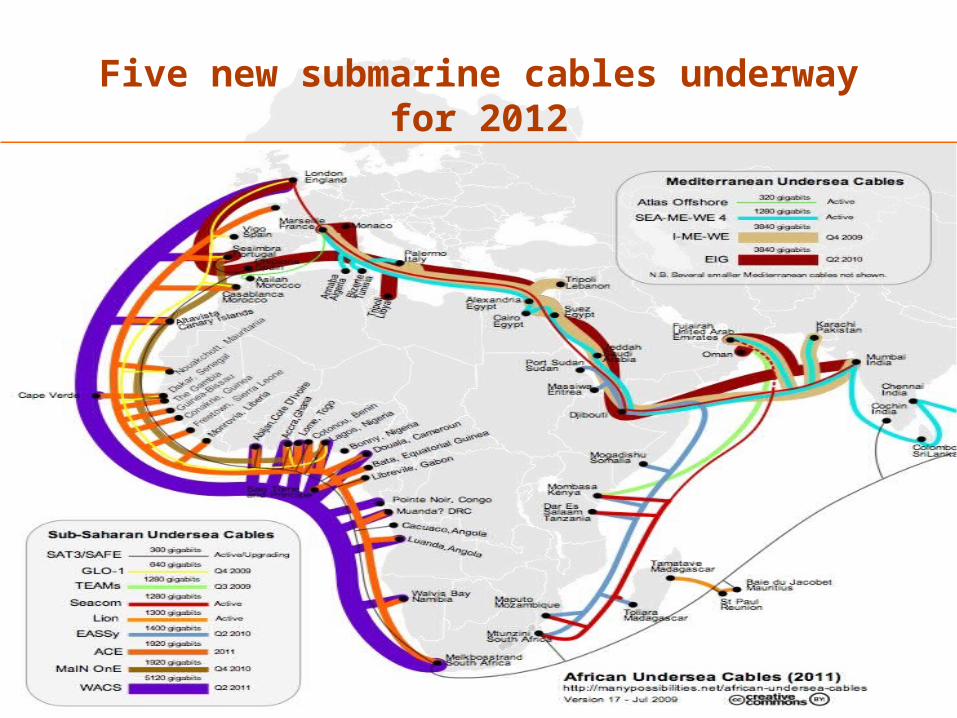
Five new submarine cables underway for 2012

Despite submarine connections, costs of ICT services are high due to lack of competition in international gateways
Price per minute for a call
within Sub-Saharan ($)Price per minute for
a call to US ($)
Price for 20 hours per month of dial-up Internet access ($)
No access to submarine cable (SSA) 1.34 0.86 68Access to submarine cable (SSA) 0.57 0.48 47Monopoly international gateway(SSA) 0.70 0.72 37Competitive international gateway (SSA) 0.48 0.23 37No access to submarine cable (ECOWAS) 0.26 0.49 63
Access to submarine cable (ECOWAS) 0.47 0.44 52
Ghana 0.21 0.15 35Benin 0.26 0.4 41Nigeria 0.32 0.3 119Senegal 0.31 0.37 26Cote d'Ivoire 0.48 0.22 48Cape Verde 1.24 1.2 47Monopoly international gateway(ECOWAS) 0.57 0.77 47Burkina Faso 0.48 0.38 75Benin 0.26 0.35 41Senegal 0.31 0.31 26Cape Verde 1.24 2.05 47Competitive international gateway (ECOWAS) 0.53 0.34 63Ghana 0.21 0.15 35Nigeria 0.32 0.3 119Niger 1.09 0.61 51Cote d'Ivoire 0.48 0.29 48

West Africa can complete a basic regional fiber optic network with modest investments
Country Gaps(km) Cost
Burkina Faso 218 6
Cote d'Ivoire 93 3
Ghana 210 6
Guinea 288 8
Guinea Bissau 113 3
Liberia 382 10
Niger 75 2
Nigeria 200 5
Sierra Leone 326 9
Total 1905 51

Completing regional fiber optic backbone looks to be a high return investment
Induced Price
(US$/mo.)Induced Subscriptions
(‘000s)Benefits
(US$mnyr) Costs (US$m) Rate of Return (%)
After Before AfterGreenfield Investment
Spending Needs Greenfield Last mile
Benin 73.5 2.7 7.4 2.7 2 134
Burkina Faso 57.0 4.5 11.5 3.3 20 6 17 56
Côte d'Ivoire 27.7 10 74.8 8.5 27 3 31 337
Gambia 41.0 0.3 1.4 0.3 5 5
Ghana 27.8 23 55.9 7.9 8 6 97 139
Mali 34.6 5.3 20.4 3.2 26 12
Niger 166.2 0.6 2.3 1.7 12 2 15 86
Nigeria 65.6 67.8 258 77.0 59 5 130 1,425
Senegal 24.9 47.4 49.2 8.7 26 34
Togo 116.3 1.9 1.8 1.6 4 36

Key Message #10
Regional spending needs of $1.5 billion a year affordable for region
but insurmountable for some countries

Achieving regional integration would take $1.5 billion a year for a decade
Power Transport ICT Total
Country Inv O&M Inv O&M Inv O&M Total Inv Total O&MTotal
(Inv+O&M)
Benin 2 8 2 8 10Burkina Faso 3 15 0.59 0.03 4 15 19
Cote d'Ivoire 27 3 18 0.25 0.01 31 18 48
Gambia, The 7 1 1 1 8 9
Ghana 5 9 20 0.31 0.02 14 20 34
Guinea 786 80 28 24 0.78 0.04 815 104 919Guinea-Bissau 5 2 5 0.55 0.03 7 5 12
Liberia 2 10 6 1.03 0.05 13 6 19
Mali 26 24 16 50 16 66
Mauritania 1 14 5 15 5 20
Niger 1 9 18 2.36 0.12 12 18 30
Nigeria 2 137 21 72 0.24 0.01 23 209 232
Senegal 3 8 19 11 19 30
Sierra Leone 7 5 0.88 0.04 8 5 13
Togo 0 2 0 2 2
ECOWAS 858 224 141 234 7 0.35 1,006 458 1,464
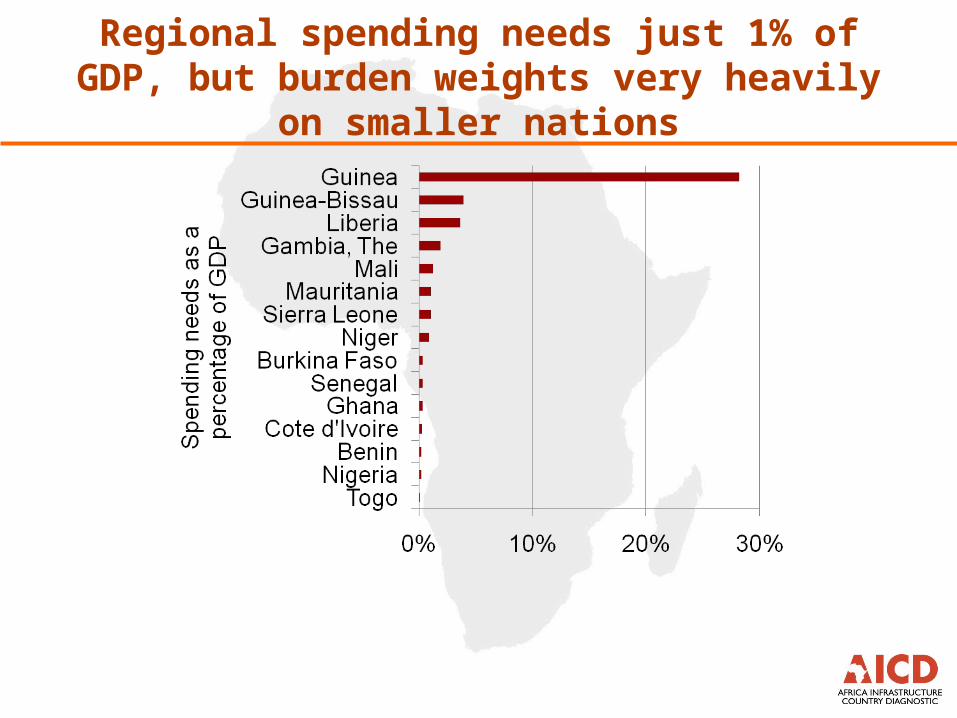
Regional spending needs just 1% of GDP, but burden weights very heavily on smaller nations

Regional spending needs would absorb 2-15% of existing infrastructure budgets

Regional integration in surface transport: achievements, challenges and promise
Sector Achievements Challenges Promise of regional integration
Roads Road are paved and in good quality along several major intra-regional corridors
Traffic quality is the worst in the world. Very high transport prices due to the level of truck utilization and the oversupply level, due to the existence of cartels
Ports Increase in cargo and container traffic West African ports charge high prices and operational performance needs to be improved
Rails Two relatively successful concessions (SITARAIL and TRANSRAIL). Intraregional railways offer competitive prices
Low levels of passenger and freight traffic, poor operational performance of railways. Railways facing stiff competition from other modes of transport

Regional integration in air transport: achievements, challenges and promise
Sector Achievements Challenges Promise of regional integration
Air Transport
Reasonable levels of inter-regional connectivity.
WAEMU and BAG are most liberalized markets in Africa
Low levels of connectivity within ECOWAS. Lack of a strong regional hub.
Aging fleet and limited progress in achieving international safety standards.
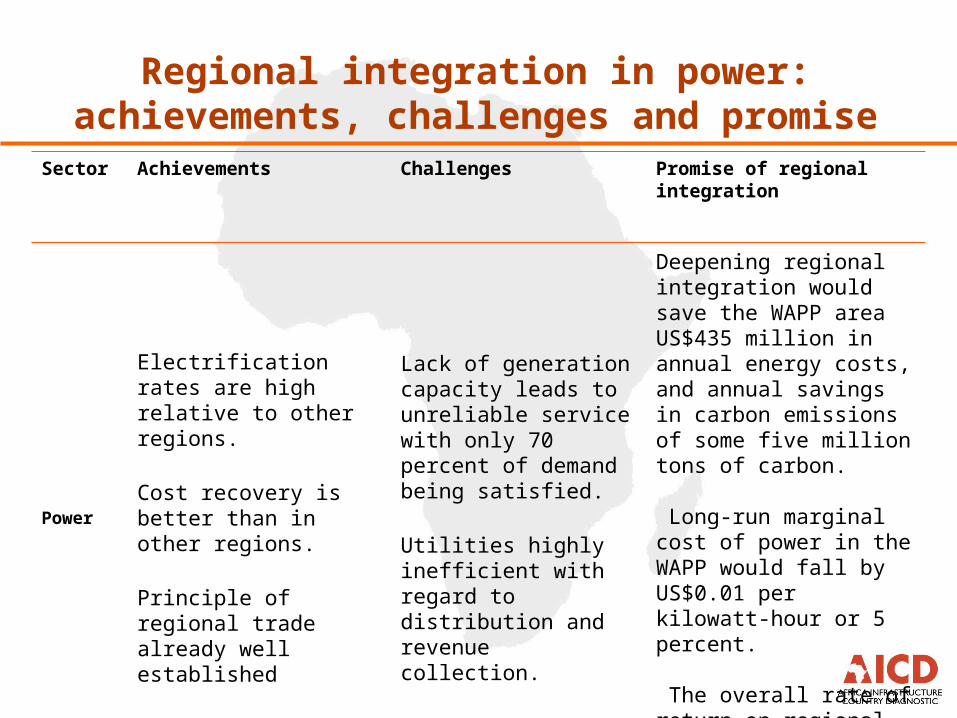
Regional integration in power: achievements, challenges and promise
Sector Achievements Challenges Promise of regional integration
Power
Electrification rates are high relative to other regions.
Cost recovery is better than in other regions.
Principle of regional trade already well established
Lack of generation capacity leads to unreliable service with only 70 percent of demand being satisfied.
Utilities highly inefficient with regard to distribution and revenue collection.
Deepening regional integration would save the WAPP area US$435 million in annual energy costs, and annual savings in carbon emissions of some five million tons of carbon.
Long-run marginal cost of power in the WAPP would fall by US$0.01 per kilowatt-hour or 5 percent.
The overall rate of return on regional integration investments is 33%.

Regional integration in ICT : achievements, challenges and promise
Sector Achievements Challenges Promise of regional integration
ICT
Access to ICT services amongst highest in Africa. Significantly cheaper to call on landline within ECOWAS than outside the region. Roaming arrangements relatively advanced.
Associated regional telecom regulators have been active in promoting harmonization. Relative to the rest of Africa has several submarine fiber optic cables.
West Africa faces relatively high prices for access to ICT.
Many counties not connected to the submarine cable.
Even where submarine connections exist costs remain relatively high due to lack of competition on the international gateways.
Achieving regional integration of ICT will cost only US$5.1 million annually, and bring benefits of US$ 115 million annually, a return of over 400 percent.
Benefits derive primarily from lower prices inducing higher rates of subscription to broadband services. The overall rate of return on regional integration investments (existing Greenfield and filling in gaps is 52 percent.