1 Doulaye Koné EAWAG / SANDEC Tel.+41 44 823 55 53 Environmental sanitation planning and...
29
1 Doulaye Koné EAWAG / SANDEC www.sandec.eawag.ch Tel.+41 44 823 55 53 Environmental sanitation planning and infrastructure in developing countries Low-cost Options for Treating Faecal Sludges (FS) and Wastewater in Developing Countries (Part A to C)
-
Upload
kristin-dawson -
Category
Documents
-
view
216 -
download
0
Transcript of 1 Doulaye Koné EAWAG / SANDEC Tel.+41 44 823 55 53 Environmental sanitation planning and...
1
Doulaye Koné
EAWAG / SANDECwww.sandec.eawag.chTel.+41 44 823 55 53
Environmental sanitation planning and infrastructure in developing countries
Low-cost Options for Treating
Faecal Sludges (FS) and
Wastewater in Developing Countries
(Part A to C)
2
Contents
Part A: Faecal sludge characteristics
Part B: Faecal sludge treatment standards
Part C: Low-cost wastewater treatment options
3
Part A: Faecal sludge (FS) characteristics
4
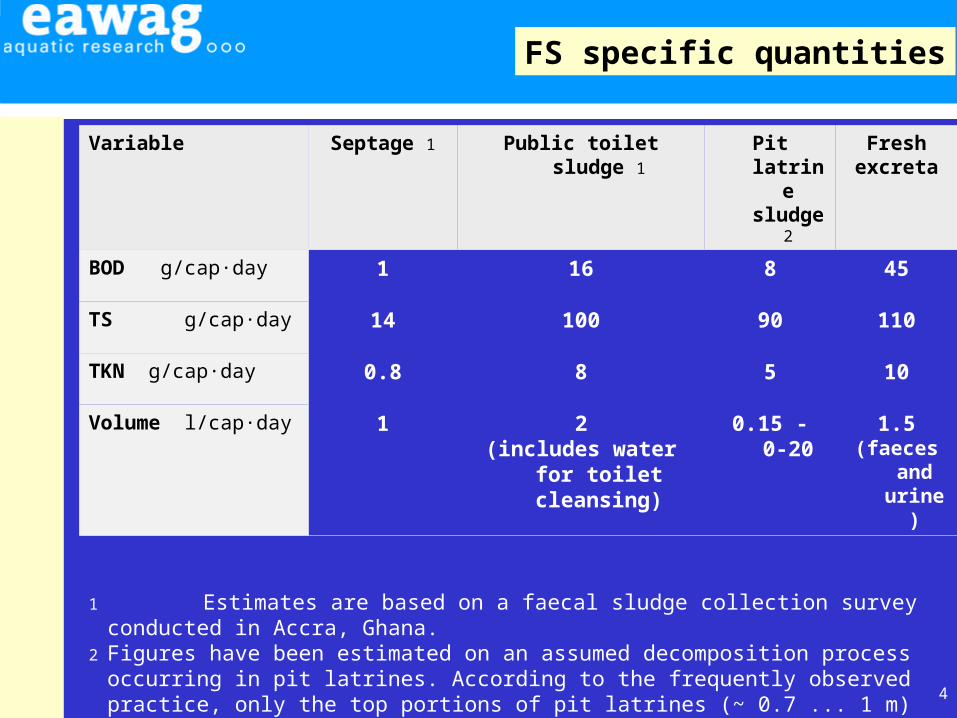
FS specific quantities
Variable Septage 1 Public toilet sludge 1 Pit latrine sludge
2
Freshexcreta
BOD g/cap·day 1 16 8 45
TS g/cap·day 14 100 90 110
TKN g/cap·day 0.8 8 5 10
Volume l/cap·day 1 2(includes water for
toilet cleansing)
0.15 - 0-20 1.5(faeces
and urine)
1 Estimates are based on a faecal sludge collection survey conducted in Accra, Ghana.2 Figures have been estimated on an assumed decomposition process occurring in pit
latrines. According to the frequently observed practice, only the top portions of pit latrines (~ 0.7 ... 1 m) are presumed to be removed by the suction tankers since the lower portions have often solidified to an extent which does not allow vacuum emptying. Hence, both per capita volumes and characteristics will range higher than in the material which has undergone more extensive decomposition.

5
Factors influencing faecal sludge quality
Quality of Faecal Sludge
S t o r a g e d u r a t i o n ( m o n t h s t o y e a r s ) P e r fo rm a n c e o f s e p t ic ta n k
A d m ix tu re s to F S(e .g g re a se , k it c h e n / so l id w a s te ) In t ru s io n o f g ro u n d w a te rT e m p e ra tu r e
T a n k e m p ty in g te c h n o lo g y + p a t te rn
6
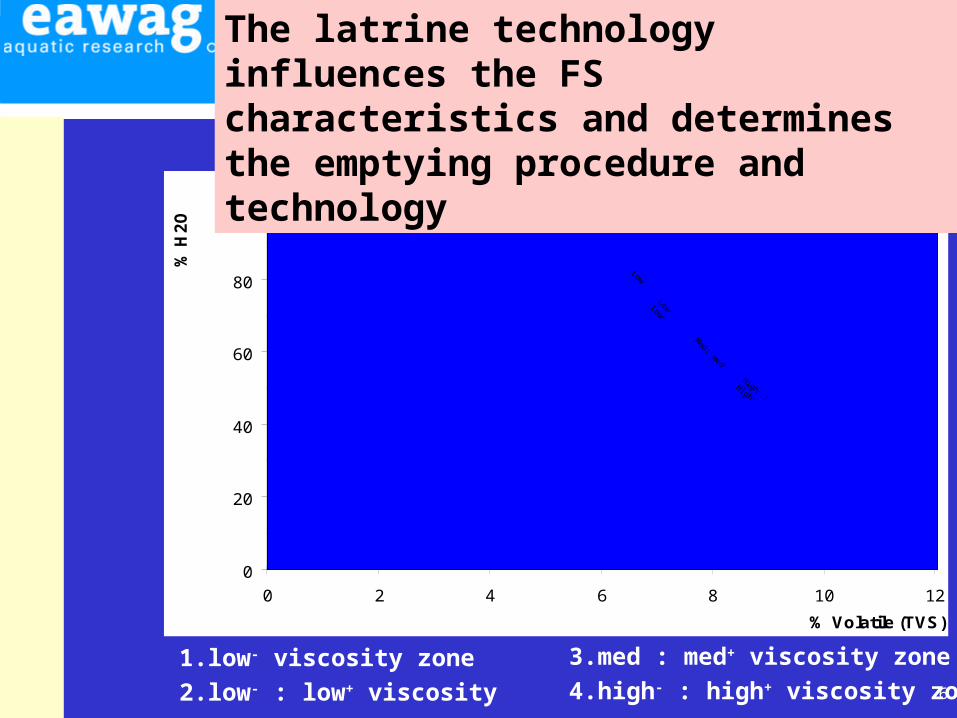
Sludge composition - Flow Behaviour (Bösch & Schertenleib, 1985)
0
20
40
60
80
100
0 2 4 6 8 10 12
% Volatile (TVS)
% H
2O
1
2
3
4
Low -
Low- : Low
+
Med: m
ed +
High - : High +
1.low- viscosity zone
2.low- : low+ viscosity zone
3.med : med+ viscosity zone
4.high- : high+ viscosity zone
The latrine technology influences the FS characteristics and determines the emptying procedure and technology
7
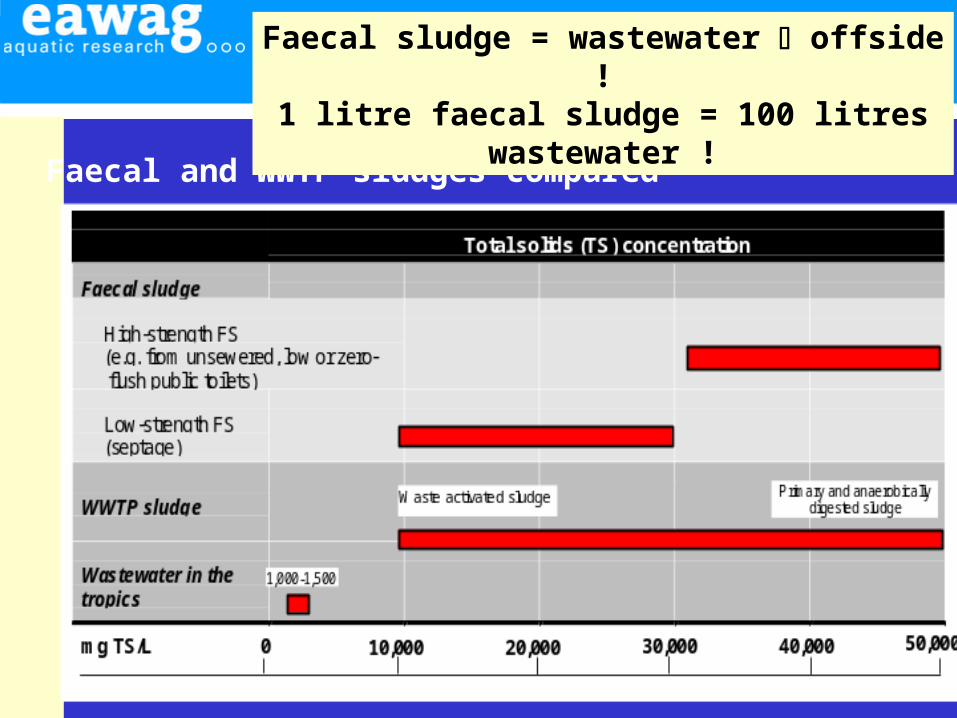
Faecal and WWTP sludges compared
Faecal sludge = wastewater offside !1 litre faecal sludge = 100 litres wastewater !
8
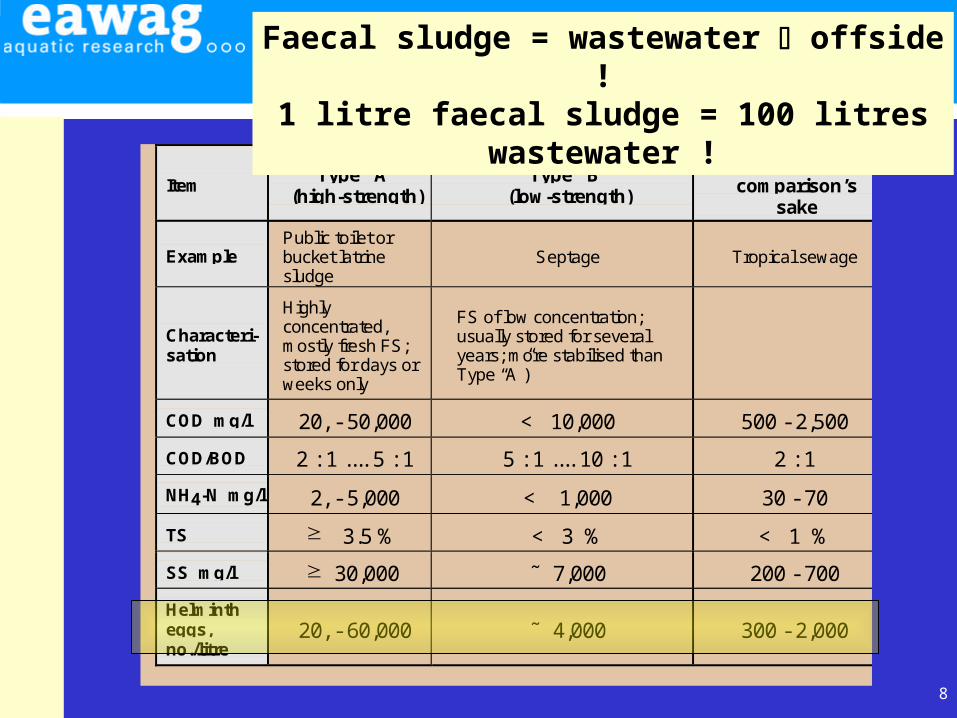
ItemType “A”
(high-strength)Type “B”
(low-strength)
Sewage - forcomparison’s
sake
ExamplePublic toilet orbucket latrinesludge
Septage Tropical sewage
Characteri-sation
Highlyconcentrated,mostly fresh FS;stored for days orweeks only
FS of low concentration;usually stored for severalyears; more stabilised thanType “A”)
COD mg/l 20, - 50,000 < 10,000 500 - 2,500
COD/BOD 2 : 1 .... 5 : 1 5 : 1 .... 10 : 1 2 : 1
NH4-N mg/l 2, - 5,000 < 1,000 30 - 70
TS = 3.5 % < 3 % < 1 %
SS mg/l = 30,000 ˜ 7,000 200 - 700
Helmintheggs,no./litre
20, - 60,000 ˜ 4,000 300 - 2,000
Faecal sludge = wastewater offside !1 litre faecal sludge = 100 litres wastewater !
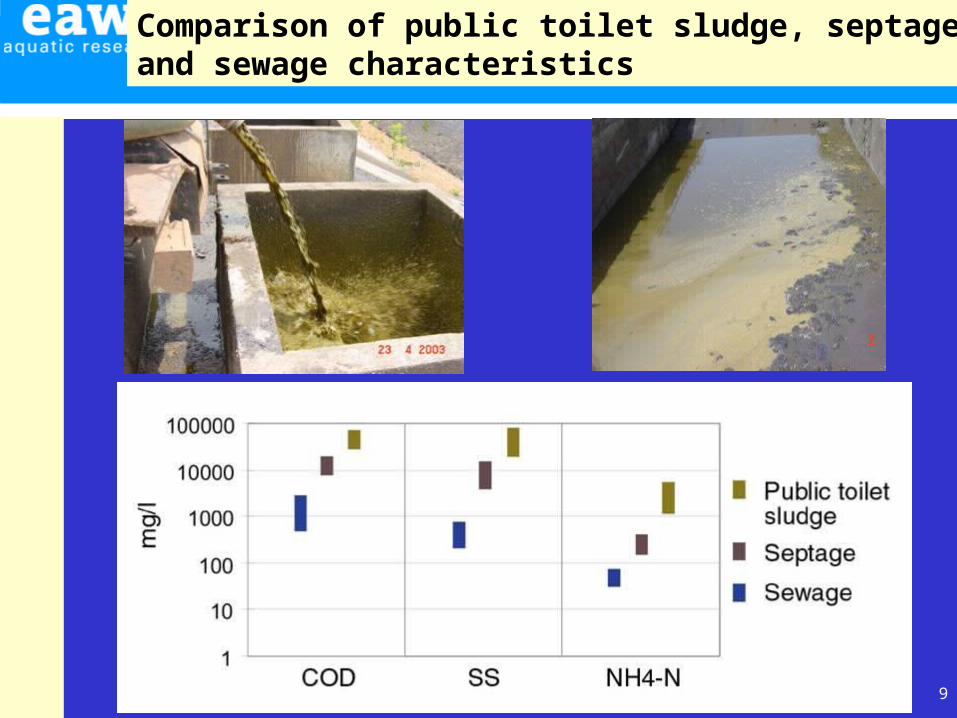
9
Comparison of public toilet sludge, septageand sewage characteristics
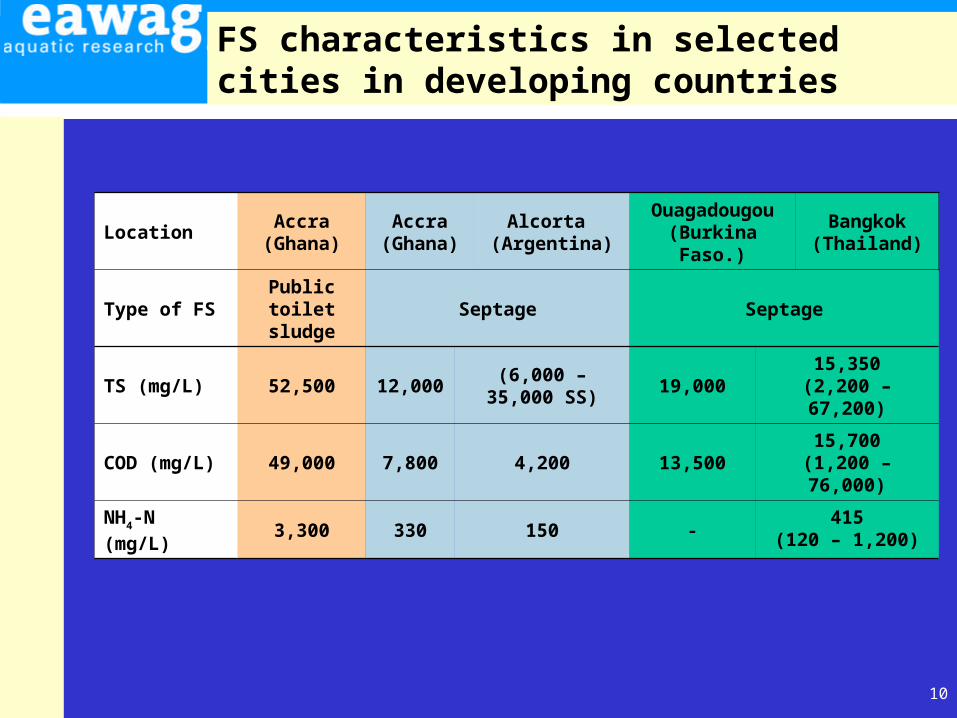
10
LocationAccra
(Ghana)Accra
(Ghana)Alcorta
(Argentina)Ouagadougou (Burkina Faso.)
Bangkok (Thailand)
Type of FSPublic toilet
sludgeSeptage Septage
TS (mg/L) 52,500 12,000(6,000 – 35,000
SS)19,000
15,350(2,200 – 67,200)
COD (mg/L) 49,000 7,800 4,200 13,50015,700
(1,200 – 76,000)
NH4-N (mg/L) 3,300 330 150 -415
(120 – 1,200)
FS characteristics in selected cities in developing countries
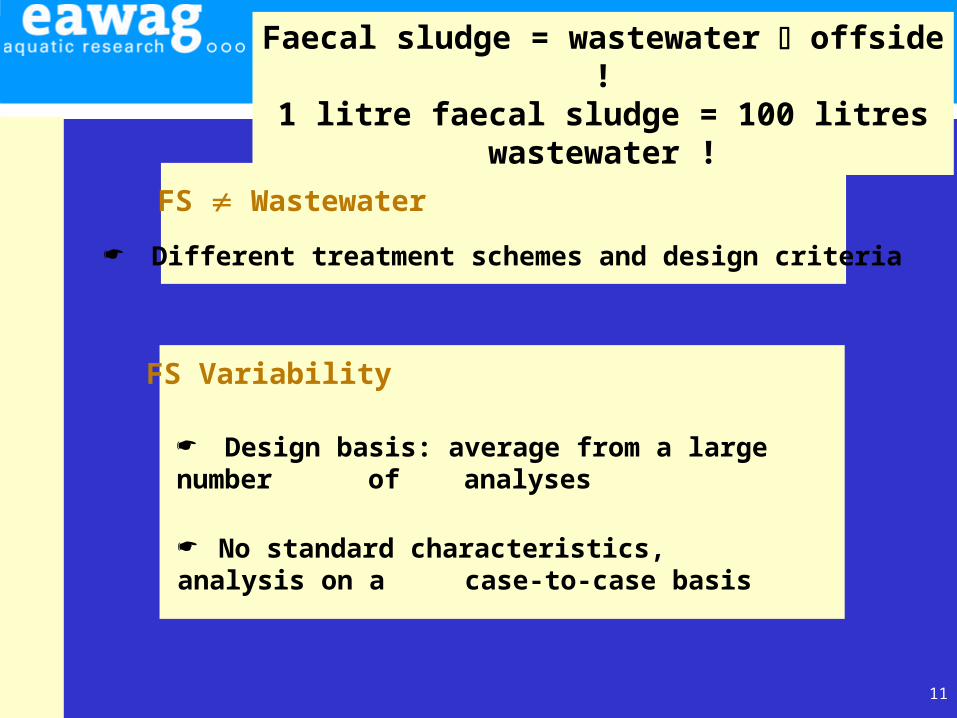
11
Different treatment schemes and design criteria
FS Wastewater
FS Variability
Design basis: average from a large number of analyses
No standard characteristics, analysis on a case-to-case basis
Faecal sludge = wastewater offside !1 litre faecal sludge = 100 litres wastewater !
12
Part B: Faecal sludge (FS) treatment standards
13
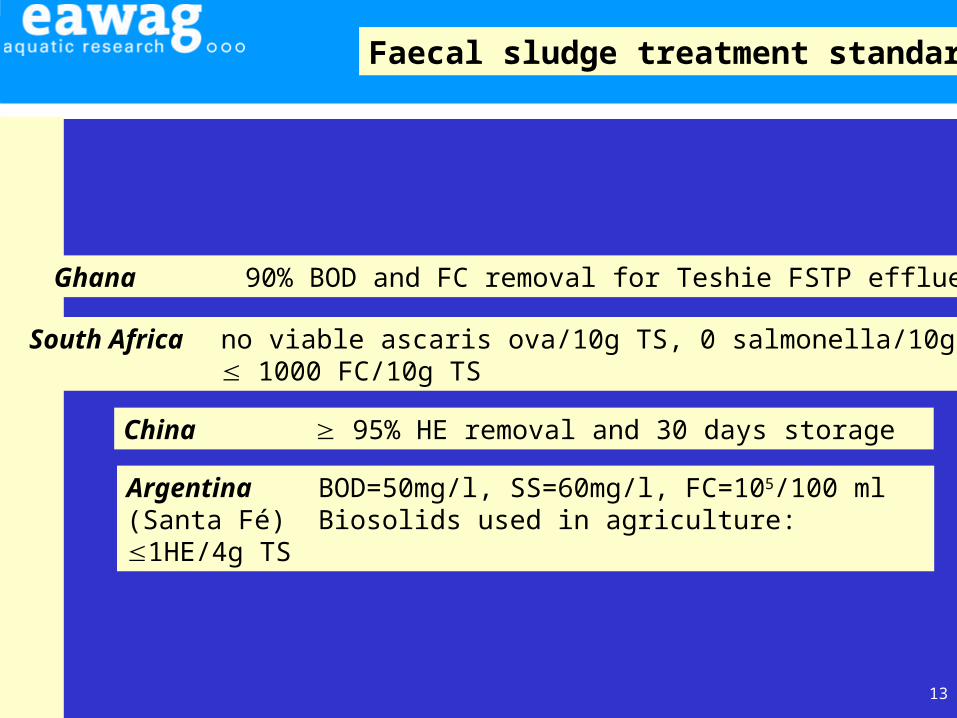
Faecal sludge treatment standards
Argentina BOD=50mg/l, SS=60mg/l, FC=105/100 ml(Santa Fé) Biosolids used in agriculture: 1HE/4g TS
China 95% HE removal and 30 days storage
South Africa no viable ascaris ova/10g TS, 0 salmonella/10g TS, 1000 FC/10g TS
Ghana 90% BOD and FC removal for Teshie FSTP effluent
14
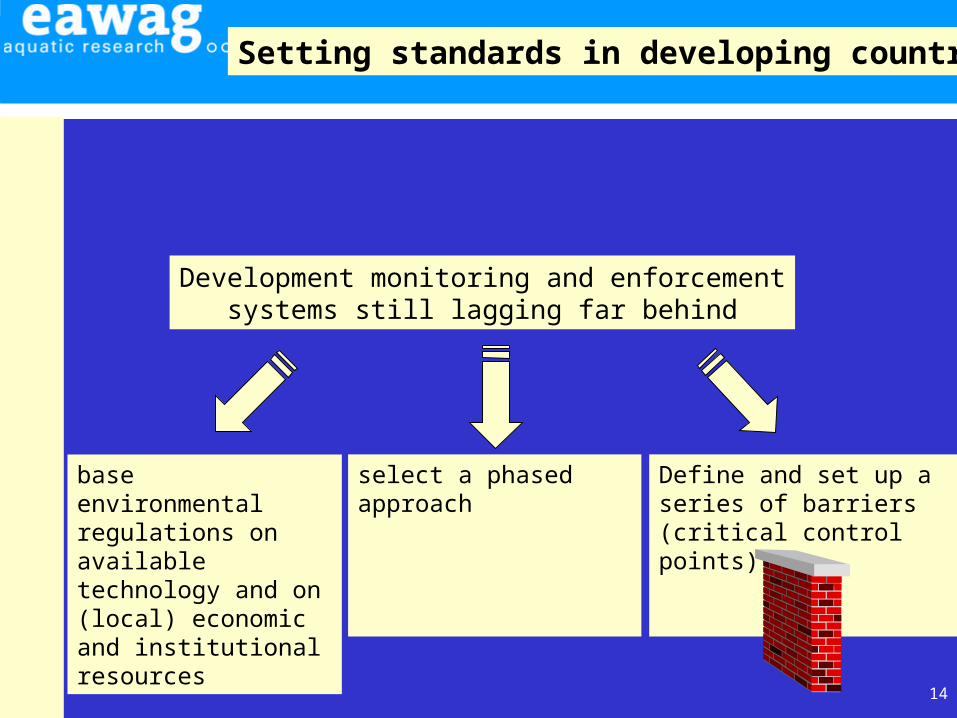
Setting standards in developing countries
Development monitoring and enforcementsystems still lagging far behind
Define and set up a series of barriers (critical control points)
select a phased approachbase environmental regulations on available technology and on(local) economic and institutional resources
15
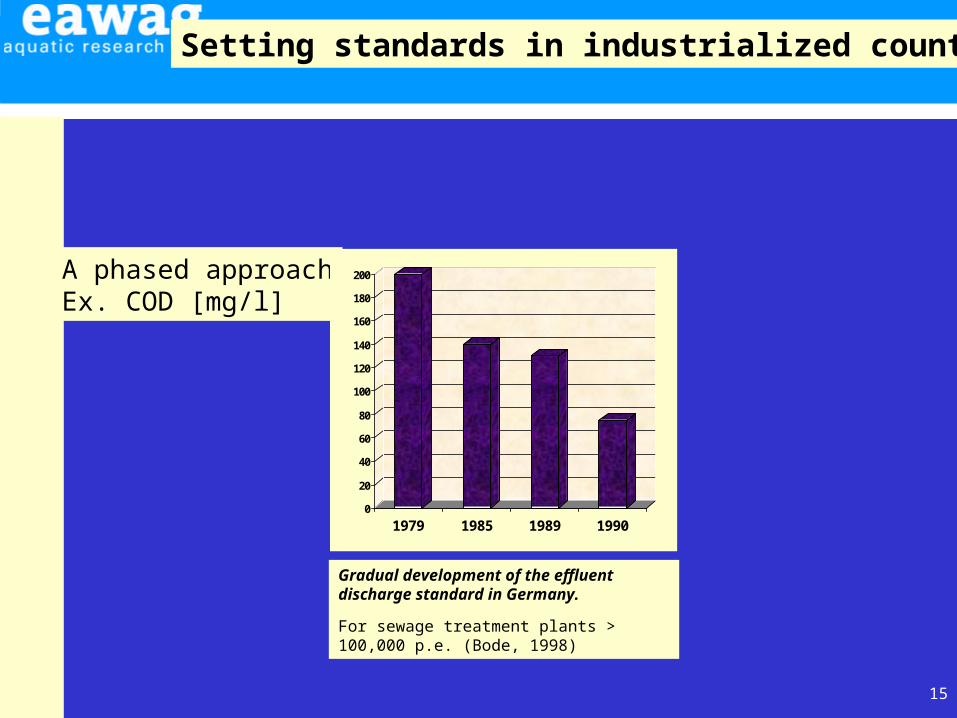
Setting standards in industrialized countries
A phased approachEx. COD [mg/l]
0
20
40
60
80
100
120
140
160
180
200
1979 1985 1989 1990
Gradual development of the effluent discharge standard in Germany.
For sewage treatment plants > 100,000 p.e. (Bode, 1998)
16
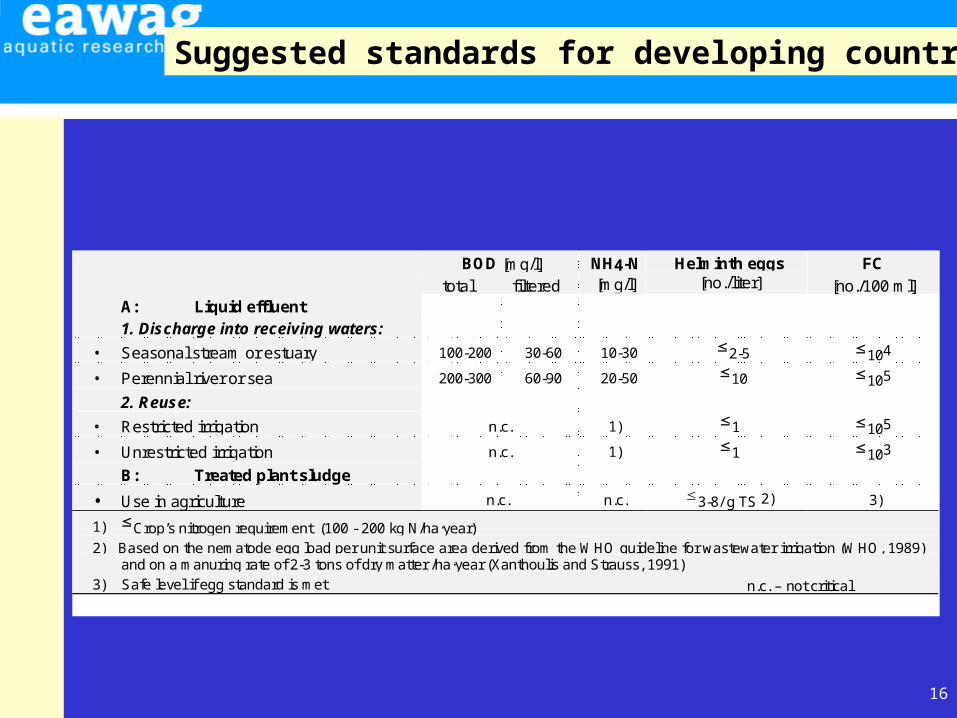
Suggested standards for developing countries
BOD [mg/l] total filtered
NH4-N[mg/l]
Helminth eggs[no./liter]
FC
[no./100 ml]A: Liquid effluent1. Discharge into receiving waters:
• Seasonal stream or estuary 100-200 30-60 10-30 2-5 104
• Perennial river or sea 200-300 60-90 20-50 10 105
2. Reuse:
• Restricted irrigation n.c. 1) 1 105
• Unrestricted irrigation n.c. 1) 1 103
B: Treated plant sludge
• Use in agriculture n.c. n.c. 3-8/ g TS 2) 3)
1) Crop’s nitrogen requirement (100 - 200 kg N/ha.year)2) Based on the nematode egg load per unit surface area derived from the WHO guideline for wastewater irrigation (WHO, 1989)
and on a manuring rate of 2-3 tons of dry matter /ha·year (Xanthoulis and Strauss, 1991)3) Safe level if egg standard is met n.c. – not critical
17
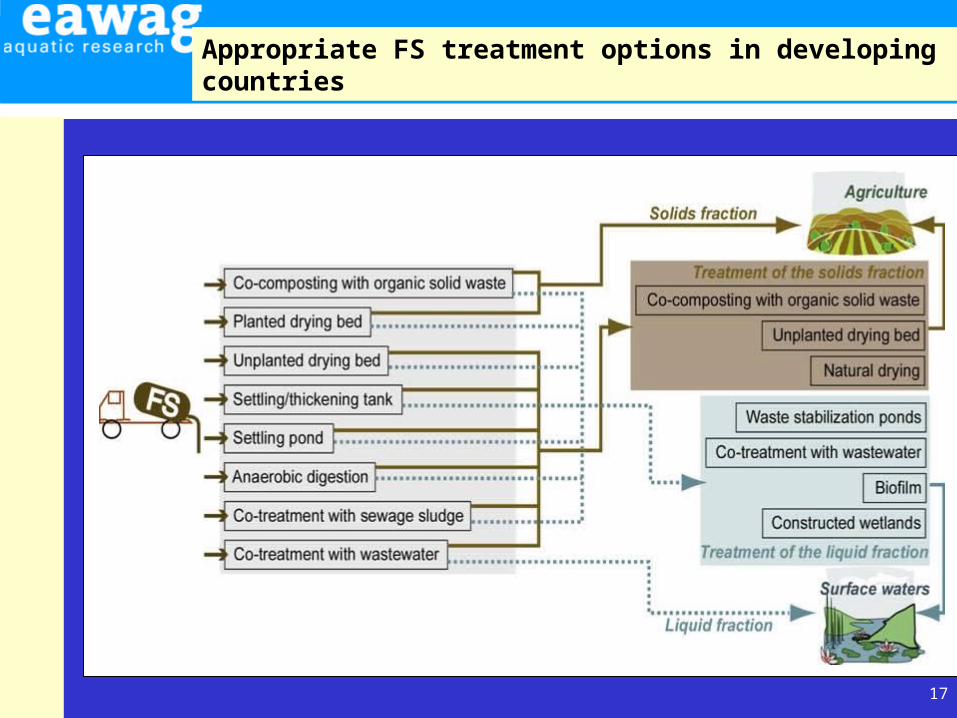
Appropriate FS treatment options in developing countries
18
Part C: Low-cost wastewater treatment options
Comment: This part is not essential: you can see it as a reminder about how constructed wetlands and anaerobic ponds work
19
Wa
ste
wa
ter
tre
atm
en
t
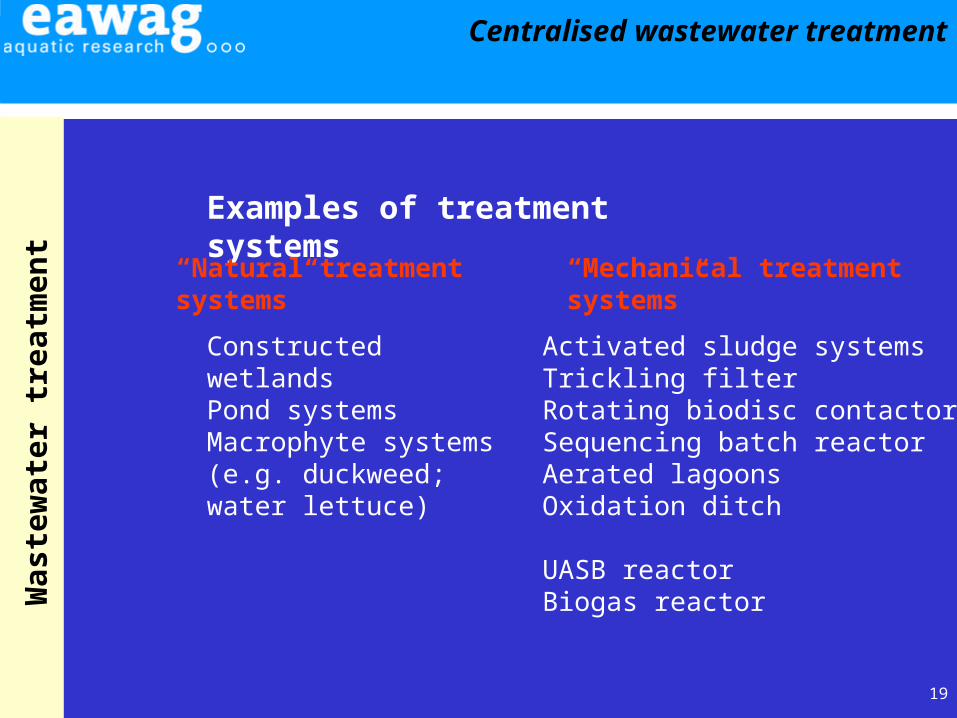
Constructed wetlandsPond systemsMacrophyte systems (e.g. duckweed; water lettuce)
Examples of treatment systems
Activated sludge systems Trickling filterRotating biodisc contactorSequencing batch reactorAerated lagoonsOxidation ditch
UASB reactorBiogas reactor
“Natural treatment systems”
“Mechanical treatment systems”
Centralised wastewater treatment
20
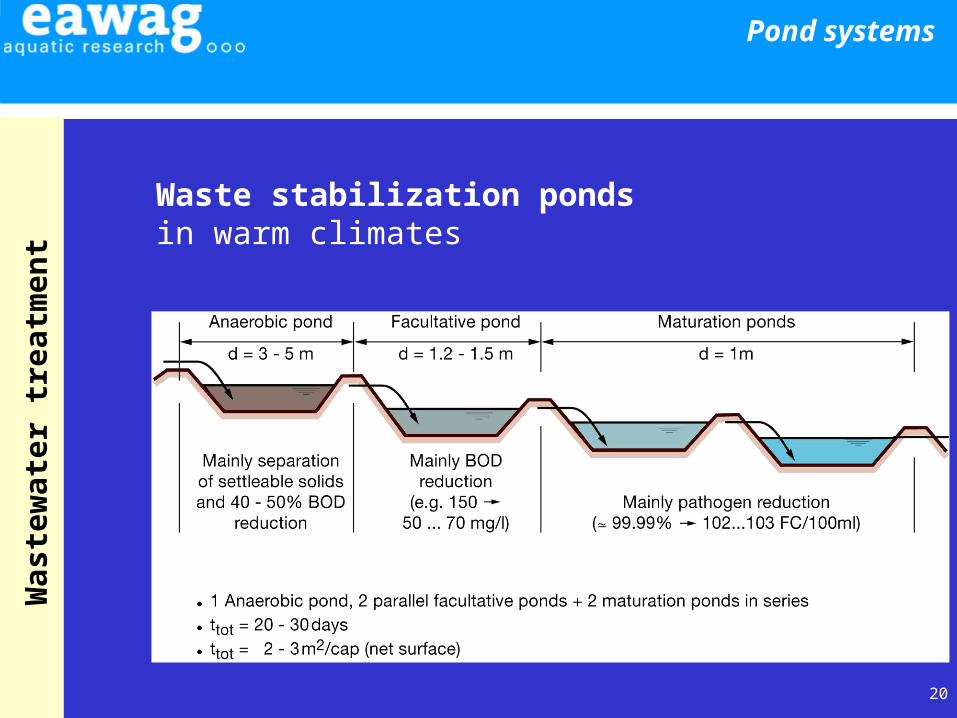
Waste stabilization ponds in warm climates
Pond systemsW
as
tew
ate
r tr
ea
tme
nt
21
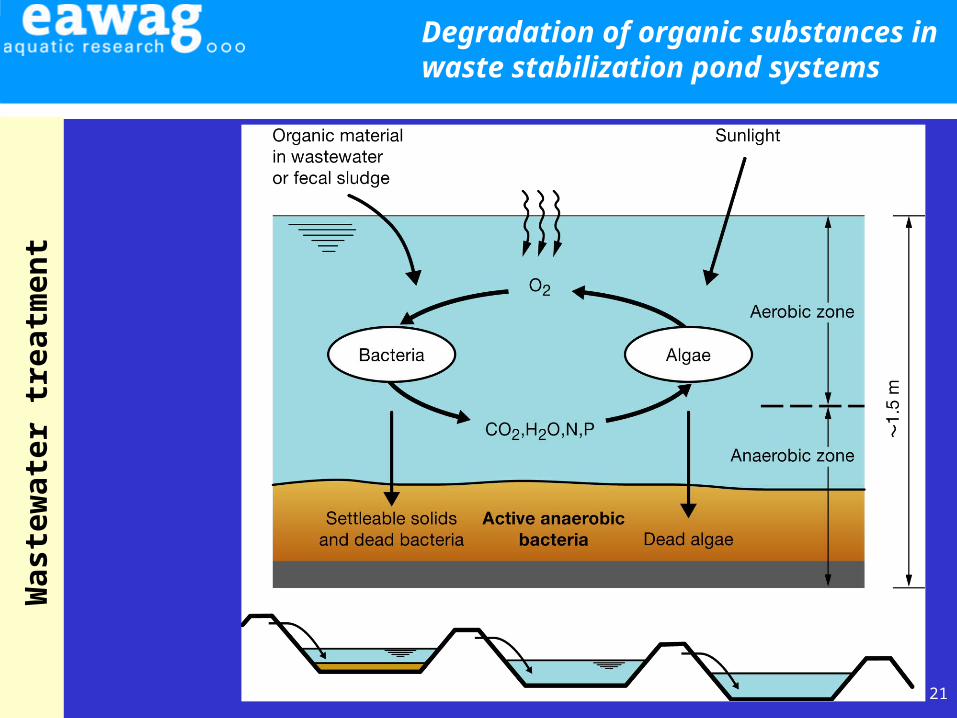
Degradation of organic substances inwaste stabilization pond systems
Wa
ste
wa
ter
tre
atm
en
t
22
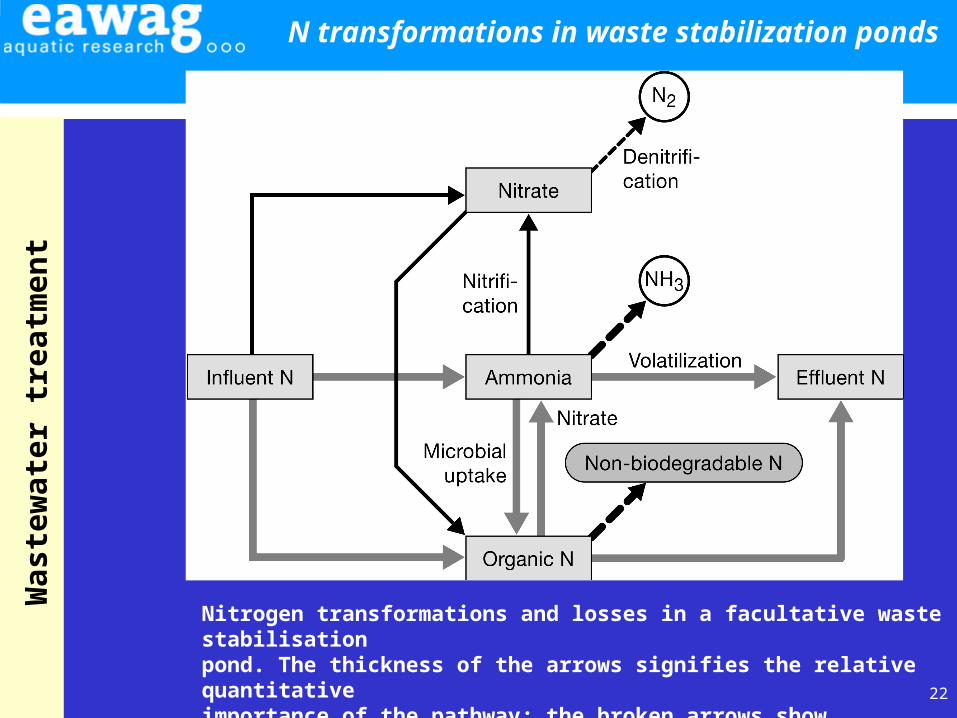
N transformations in waste stabilization ponds
Nitrogen transformations and losses in a facultative waste stabilisationpond. The thickness of the arrows signifies the relative quantitative importance of the pathway; the broken arrows show mechanisms of net nitrogen removal.
Wa
ste
wa
ter
tre
atm
en
t
23
Constructed wetlandsW
as
tew
ate
r tr
ea
tme
nt
24
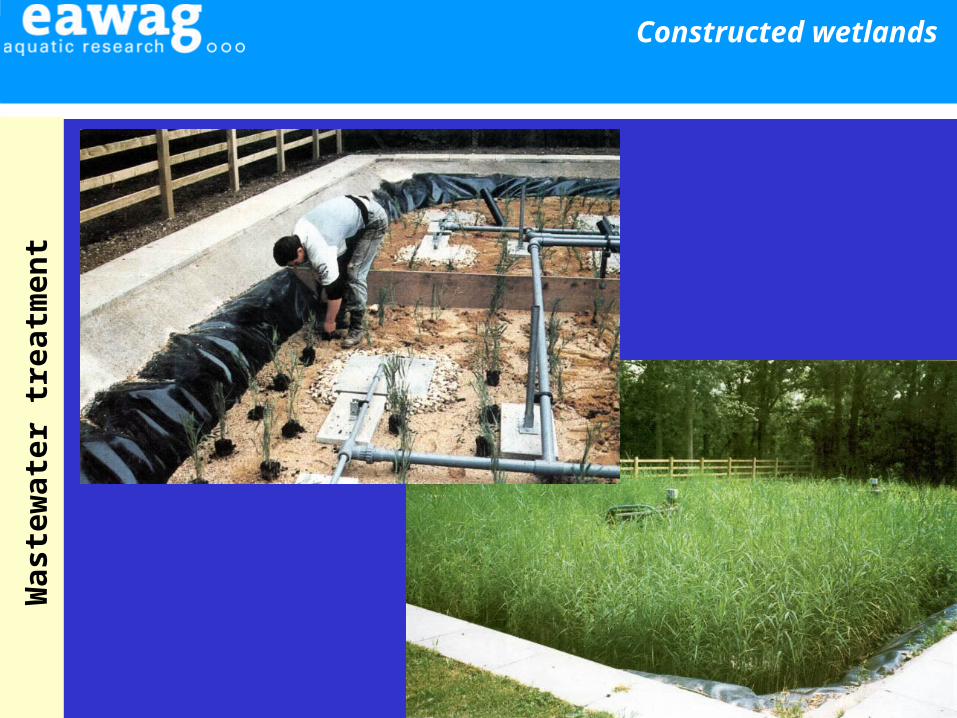
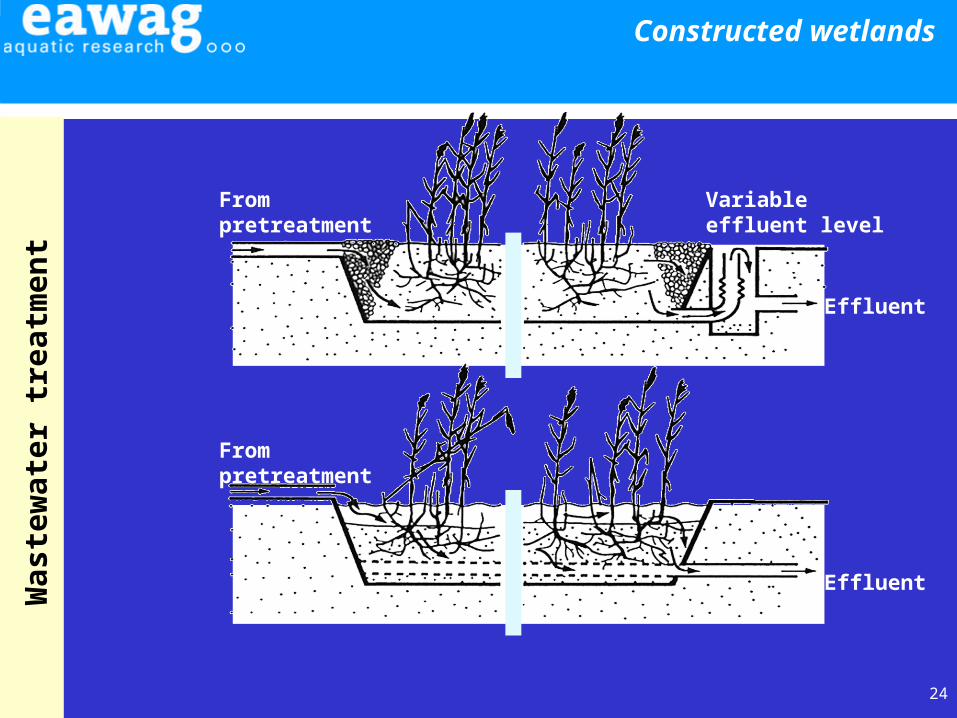
Constructed wetlands
From pretreatment
Variableeffluent level
Effluent
Effluent
From pretreatment
Wa
ste
wa
ter
tre
atm
en
t
25
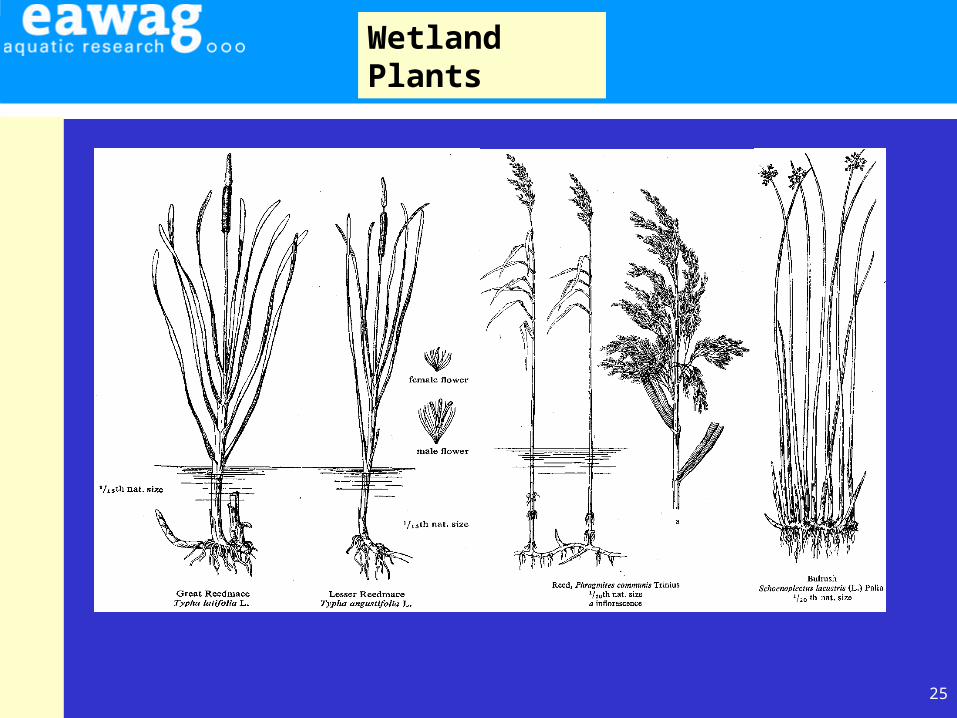
Wetland Plants
26
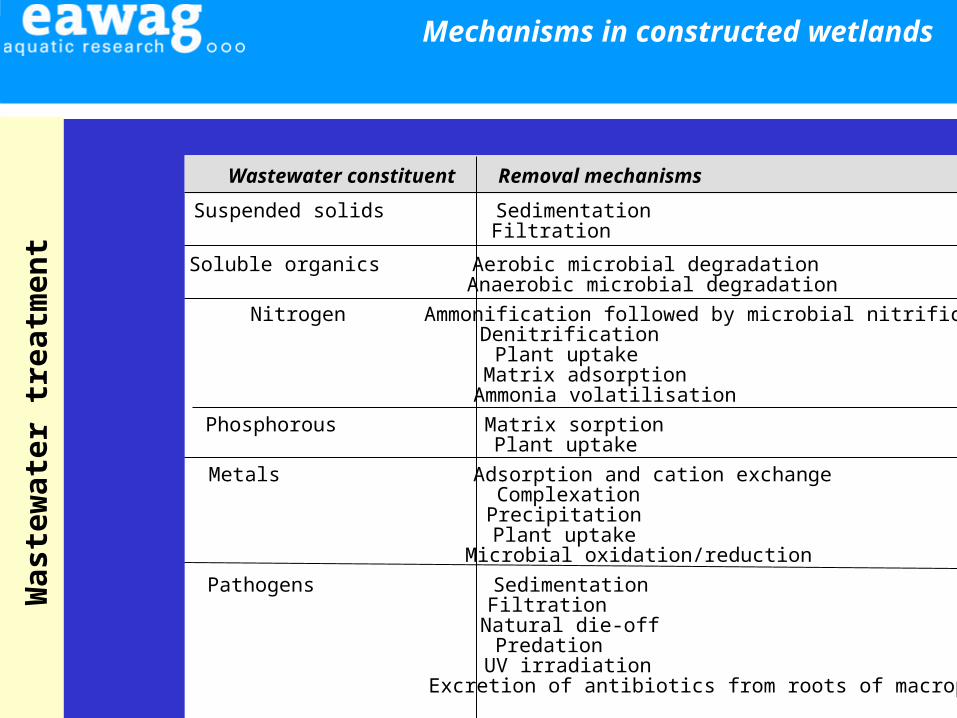
Mechanisms in constructed wetlands
Wastewater constituent Removal mechanisms
Suspended solids SedimentationFiltration
Soluble organics Aerobic microbial degradationAnaerobic microbial degradation
Nitrogen Ammonification followed by microbial nitrificationDenitrificationPlant uptakeMatrix adsorptionAmmonia volatilisation
Phosphorous Matrix sorption
Metals Adsorption and cation exchangeComplexationPrecipitationPlant uptakeMicrobial oxidation/reduction
Pathogens SedimentationFiltrationNatural die-offPredationUV irradiationExcretion of antibiotics from roots of macrophytes
Plant uptake
Wa
ste
wa
ter
tre
atm
en
t
27
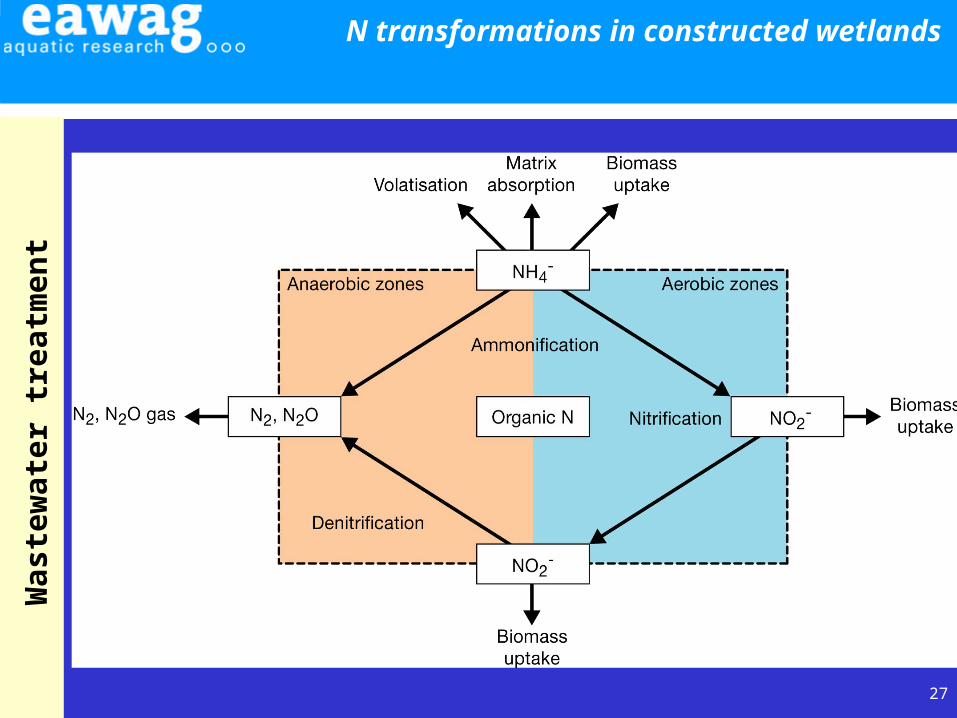
N transformations in constructed wetlandsW
as
tew
ate
r tr
ea
tme
nt
28
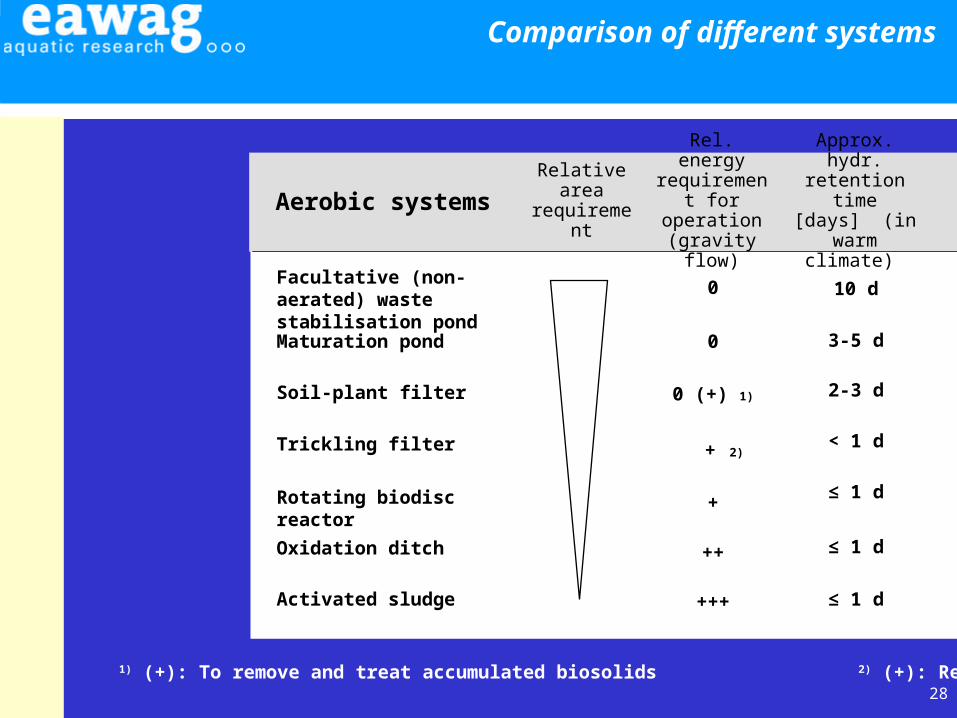
Comparison of different systems
≤ 1 d+++Activated sludge
≤ 1 d++Oxidation ditch
≤ 1 d+Rotating biodisc reactor
< 1 d + 2)Trickling filter
2-3 d0 (+) 1)Soil-plant filter
3-5 d0Maturation pond
10 d0Facultative (non-aerated) waste stabilisation pond
Approx. hydr. retention time
[days] (in warm climate)
Rel. energy requirement for operation(gravity flow)
Relative area
requirementAerobic systems
1) (+): To remove and treat accumulated biosolids 2) (+): Recirculation
29
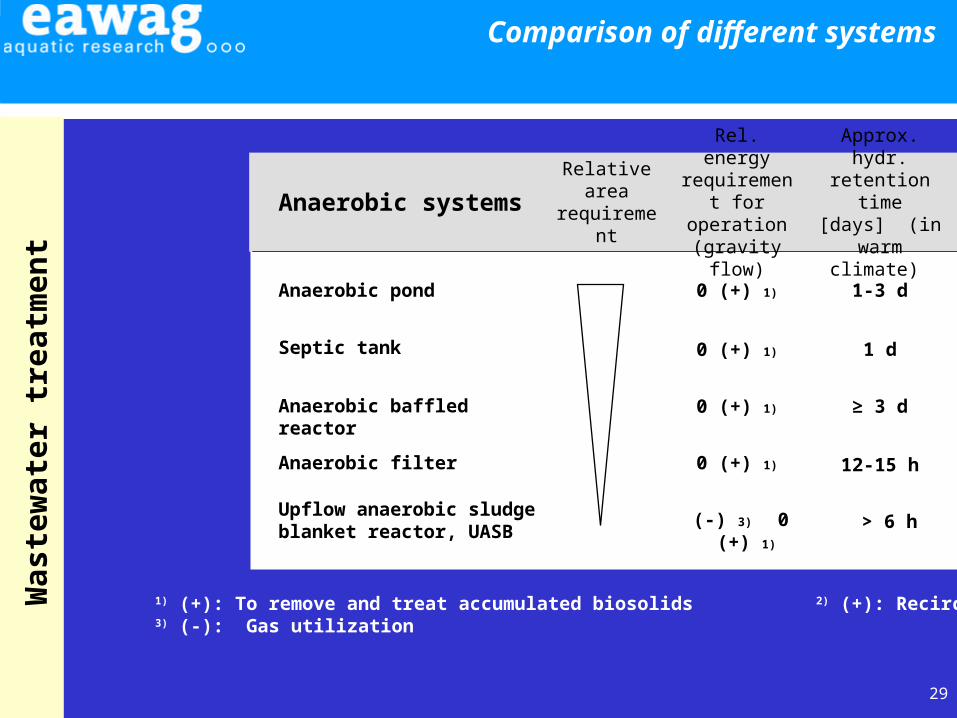
Comparison of different systems
> 6 h(-) 3) 0 (+) 1)Upflow anaerobic sludge blanket reactor, UASB
12-15 h0 (+) 1)Anaerobic filter
≥ 3 d0 (+) 1)Anaerobic baffled reactor
1 d0 (+) 1)Septic tank
1-3 d0 (+) 1)Anaerobic pond
Approx. hydr. retention time
[days] (in warm climate)
Rel. energy requirement for operation(gravity flow)
Relative area
requirementAnaerobic systems
1) (+): To remove and treat accumulated biosolids 2) (+): Recirculation 3) (-): Gas utilization
Wa
ste
wa
ter
tre
atm
en
t