1 DEVELOPPING A LOGISTICS PERFORMANCE ASSESSMENT TOOL FOR SMEs: A Closer Look at Logistics Costs…...
32
1 DEVELOPPING A LOGISTICS PERFORMANCE ASSESSMENT TOOL FOR SMEs: A Closer Look at Logistics Costs… Ruth Banomyong Centre for Logistics Research Thammasat University, Thailand
-
Upload
lionel-brooks -
Category
Documents
-
view
214 -
download
0
Transcript of 1 DEVELOPPING A LOGISTICS PERFORMANCE ASSESSMENT TOOL FOR SMEs: A Closer Look at Logistics Costs…...
1
DEVELOPPING A LOGISTICS PERFORMANCE ASSESSMENT TOOL
FOR SMEs: A Closer Look at Logistics Costs…
Ruth Banomyong
Centre for Logistics Research
Thammasat University, Thailand
2
Agenda
• Background• Framework Development• Methodology• Findings• Some Comments...• A closer look at logistics costs...
3
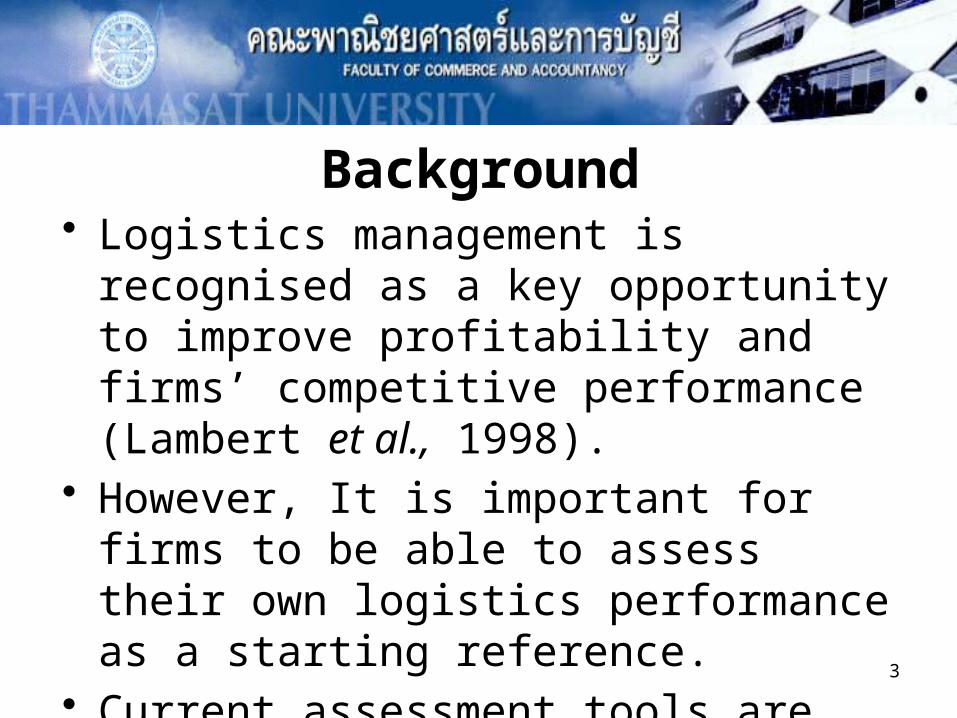
Background• Logistics management is recognised as a
key opportunity to improve profitability and firms’ competitive performance (Lambert et al., 1998).
• However, It is important for firms to be able to assess their own logistics performance as a starting reference.
• Current assessment tools are not user friendly.
4
Background
• The purpose of this presentation is to introduce a logistics performance assessment tool (LPAT).
• The objective of the LPAT is to measure the performance of a firm’s key logistics activities under different performance dimensions.
5
Background• The literature on the subject of performance measurement
in logistics had common theme (Bowersox et al., 1989; Byrne & Markham 1991; Keebler et al,. 1999; Griffis et al.,
2004): – Most firms do not comprehensively measure logistics performance,– Even the best performing firms fail to realise their productivity and
service potential available from logistics performance measurement, and;
– Logistics competency will increasingly be viewed as a competitive differentiator and a key strategic resource for the firm.
6
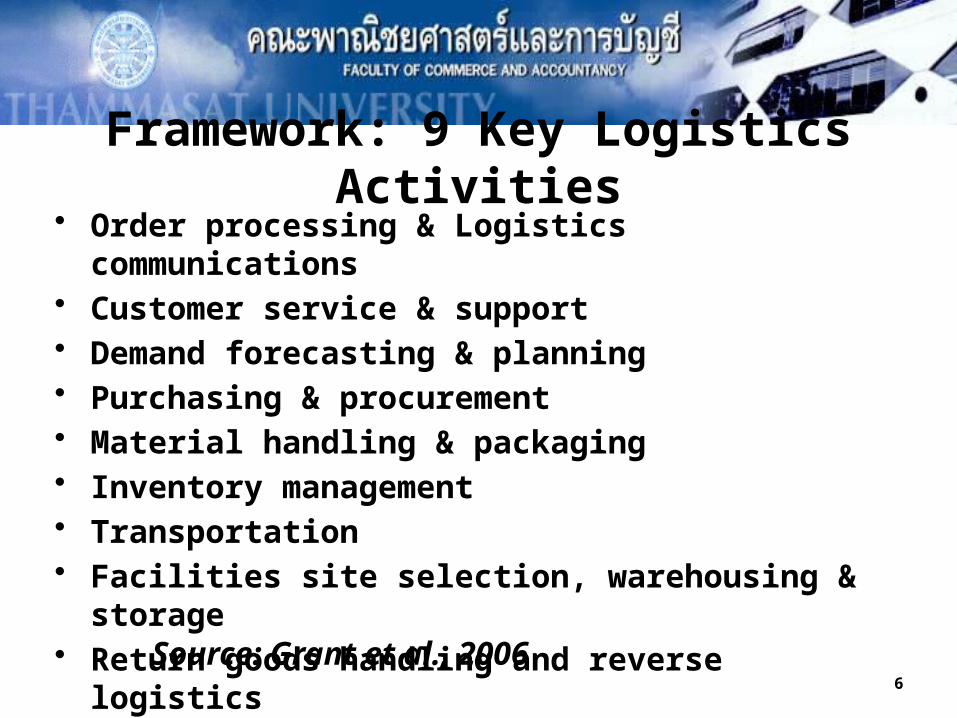
Framework: 9 Key Logistics Activities• Order processing & Logistics communications• Customer service & support• Demand forecasting & planning• Purchasing & procurement• Material handling & packaging• Inventory management• Transportation• Facilities site selection, warehousing & storage• Return goods handling and reverse logistics
Source: Grant et al., 2006
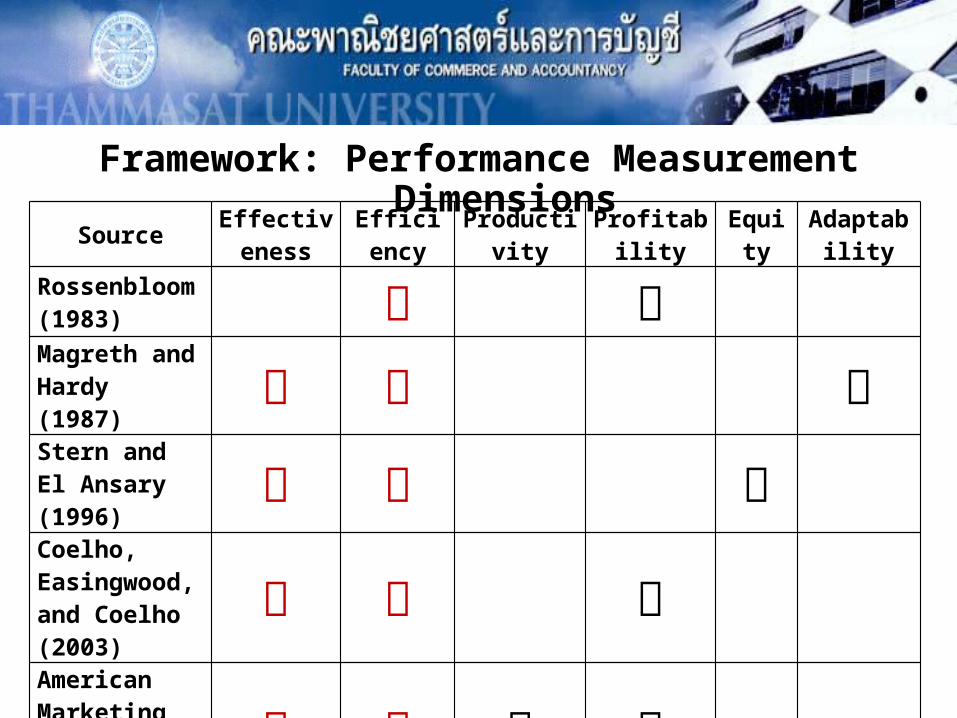
Framework: Performance Measurement Dimensions
Source Effectiveness
Efficiency
Productivity
Profitability
Equity
Adaptability
Rossenbloom (1983) Magreth and Hardy (1987)
Stern and El Ansary (1996)
Coelho, Easingwood,and Coelho (2003)
American Marketing Association (2005)

Framework Development
9 Logistics Activities
Time Dimension
Cost DimensionReliability
Dimension

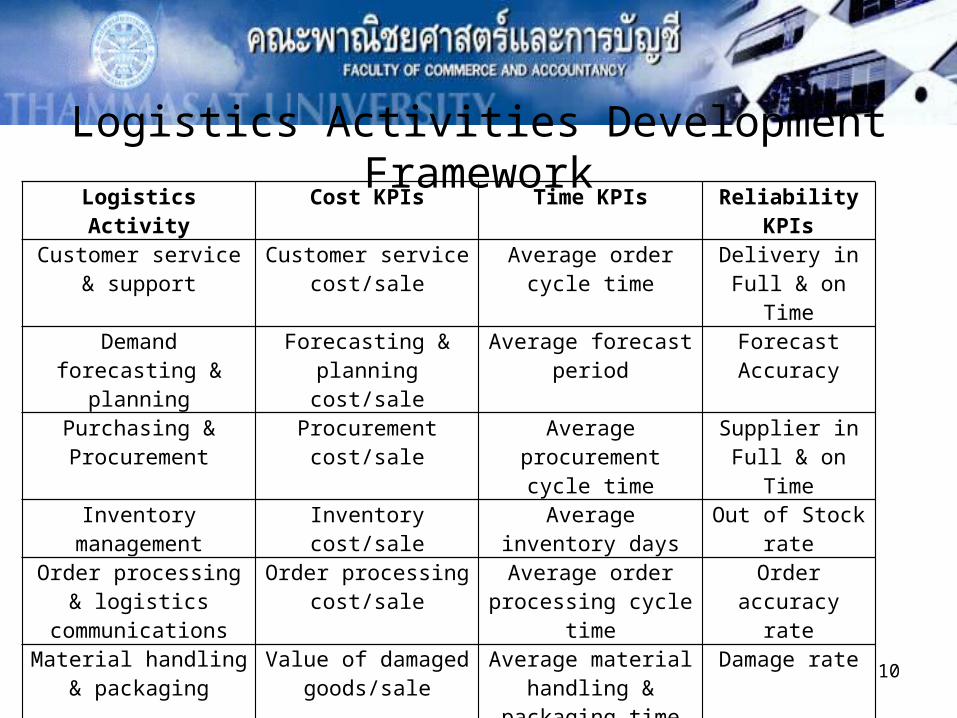
Logistics Activities Development Framework
10
Logistics Activity Cost KPIs Time KPIs Reliability KPIsCustomer service &
supportCustomer service
cost/saleAverage order cycle
timeDelivery in Full
& on TimeDemand forecasting &
planningForecasting &
planning cost/saleAverage forecast
periodForecast Accuracy
Purchasing & Procurement
Procurement cost/sale
Average procurement cycle time
Supplier in Full & on Time
Inventory management Inventory cost/sale Average inventory days
Out of Stock rate
Order processing & logistics
communications
Order processing cost/sale
Average order processing cycle time
Order accuracy rate
Material handling & packaging
Value of damaged goods/sale
Average material handling & packaging
time
Damage rate
Transportation Transport cost/sale Average delivery cycle time
Delivery in Full & on Time
Facilities site selection, warehousing & storage
Facility cost/sale Average inventory cycle time
Inventory Accuracy
Return goods handling & reverse logistics
Return goods value/sale
Average cycle time for customer return
Rate of returned goods
Methodology• A questionnaire was developed based on the
logistics activities performance framework. • 25 SMEs respondents were selected to answer
the questionnaire while one Thai multinational was also requested to answer the assessment questionnaire.
• The 25 SMEs were composed of firms in the automotive sector, electronic, jewelry, furniture, and rubber industry.
11
Methodology
• Respondents understood data requirement well. However only 2 were able to fill the whole questionnaire.
• Cost data was the most difficult to complete. Respondents with ISO have more available data.
• Data provided by Thai MNE could serve as a reference point.
12
Findings
• The data collected was compared with an existing logistics and supply chain benchmarking database
http://www.benchmarkingsuccess.com• The logistics performance out put based
on the 3 performance dimensions are illustrated in the following slides…
13
14
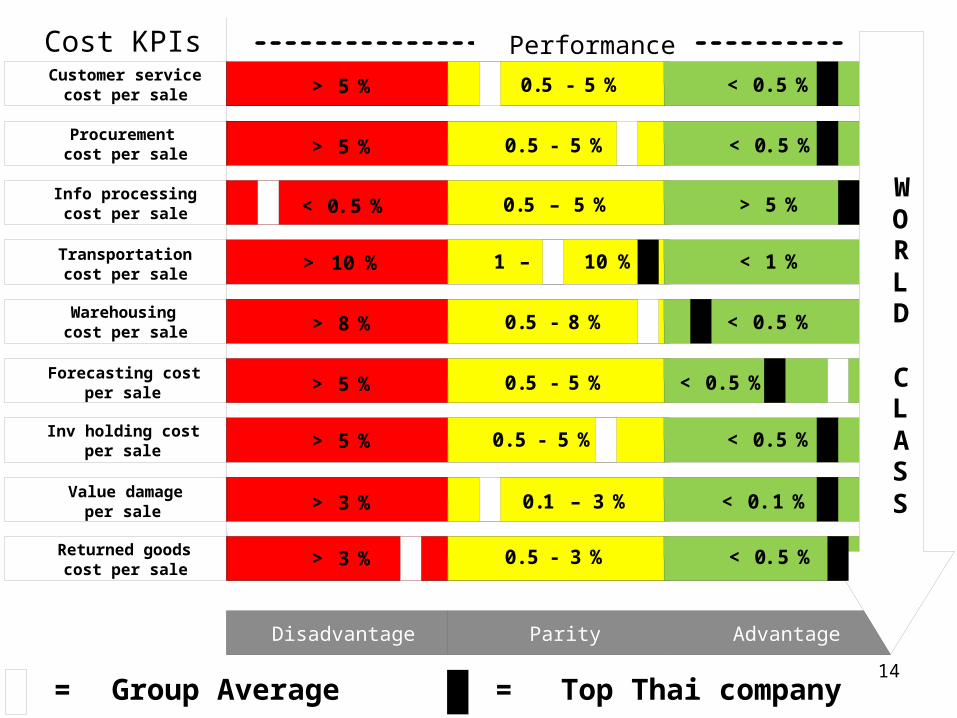
Cost KPIs PerformanceCustomer service
cost per sale
Procurement cost per sale
Info processing cost per sale
Disadvantage Parity Advantage
WORLD
CLASS
Transportation cost per sale
Warehousing cost per sale
Forecasting cost per sale
Inv holding cost per sale
Value damageper sale
Returned goods cost per sale
> 10 % 1 – 10 % < 1 %
> 5 % 0 . 5 - 5 % < 0 . 5 %
> 8 % 0 . 5 - 8 % < 0 . 5 %
> 5 % 0 . 5 - 5 % < 0 . 5 %
> 5 % 0 . 5 - 5 % < 0 . 5 %
> 3 % 0 . 1 – 3 % < 0 . 1 %
> 3 % 0 . 5 - 3 % < 0. 5 %
< 0. 5 % 0 . 5 – 5 % > 5 %
> 5 % 0 . 5 - 5 % < 0. 5 %
= Group Average = �Top Thai company
15
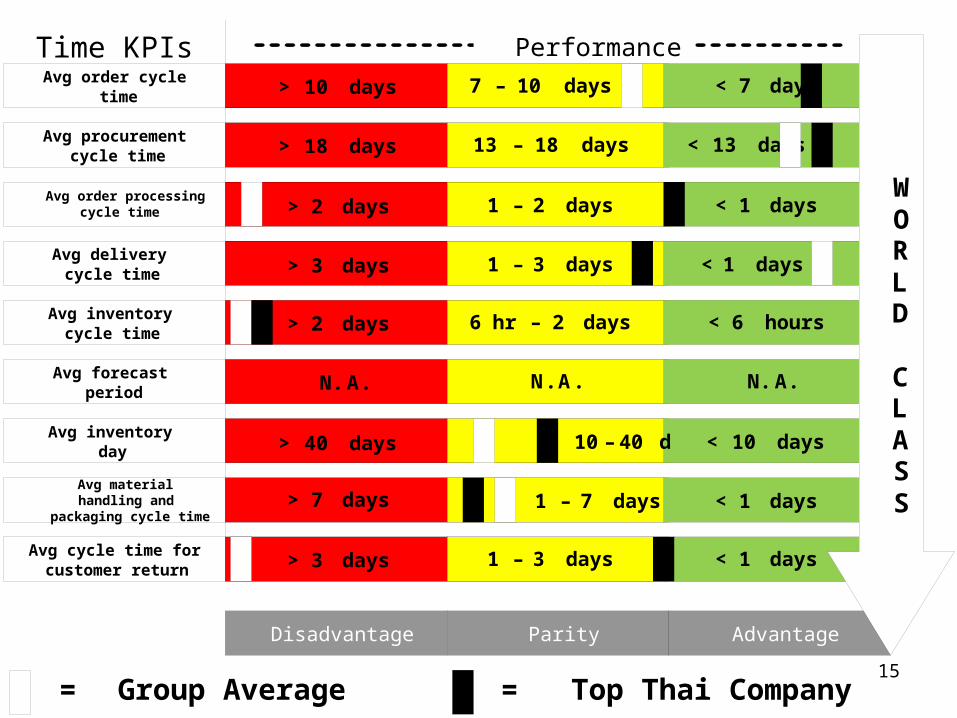
Time KPIs PerformanceAvg order cycle
time
Avg procurement cycle time
Avg order processing cycle time
Disadvantage Parity Advantage
Avg delivery cycle time
Avg inventory cycle time
Avg forecast period
Avg inventory day
Avg material handling and
packaging cycle time
Avg cycle time for customer return
> 10 days 7 – 10 days < 7 days
> 18 days 13 – 18 days < 13 days
> 2 days 1 – 2 days < 1 days
> 3 days 1 – 3 days < 1 days
> 2 days 6 hr – 2 days < 6 hours
N. A . N . A . N. A .
> 40 days 10 – 40 d < 10 days
> 7 days 1 – 7 days < 1 days
> 3 days 1 – 3 days < 1 days
WORLD
CLASS
= �Group Average = Top Thai Company
16
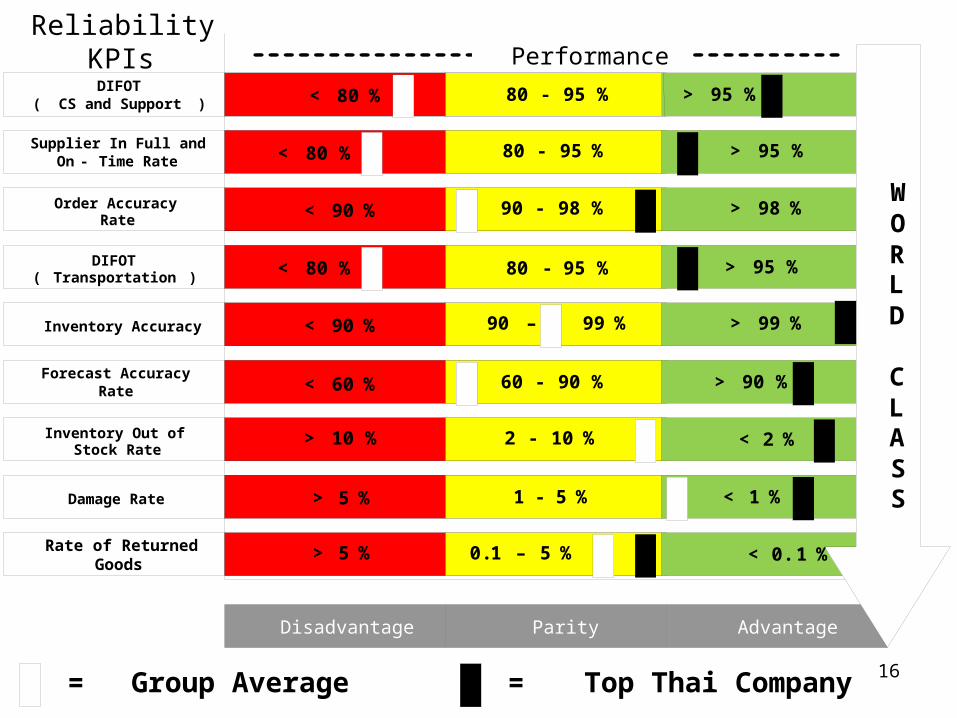
ReliabilityKPIs PerformanceDIFOT
( CS and Support ) < 80 % 80 - 95 %
Disadvantage Parity Advantage
WORLD
CLASS
Supplier In Full and On - Time Rate
Order Accuracy Rate
DIFOT( Transportation )
Inventory Accuracy
Forecast Accuracy Rate
Inventory Out of Stock Rate
Damage Rate
Rate of Returned Goods
< 80 % 80 - 95 % > 95 %
< 80 % 80 - 95 % > 95 %
< 90 % 90 - 98 % > 98 %
< 90 % 90 – 99 % > 99 %
< 60 % 60 - 90 % > 90 %
< 2 %2 - 10 %> 10 %
< 1 %1 - 5 %> 5 %
< 0 . 1 %0 . 1 – 5 %> 5 %
> 95 %
= �Group Average = �Top Thai Company
Some Comments...
• The LPAT tool could still be further simplified to make data collection easier.
• Key logistics activities are not equal in importance
• Further refinement of the logistics activities performance framework is needed…
17
Some Comments...• The objective would be to identify maybe
not more than 2 or 3 key logistics KPIs per performance dimension that could illustrate firms’ overall logistics performance.
• A composite performance metrics is currently under consideration.
• The development of this tool is an ongoing process. 18
A Closer Look at Logistics Cost...• Difficult to identify all logistics activity cost. • ABC can support the identification of cost of
each logistics costing. However, difficult to implement.
• Logistics cost ratio per sales is the most common indicator...
• National Logistics cost?• C2C metric to reflect supply chain
performance? An example. 19
20
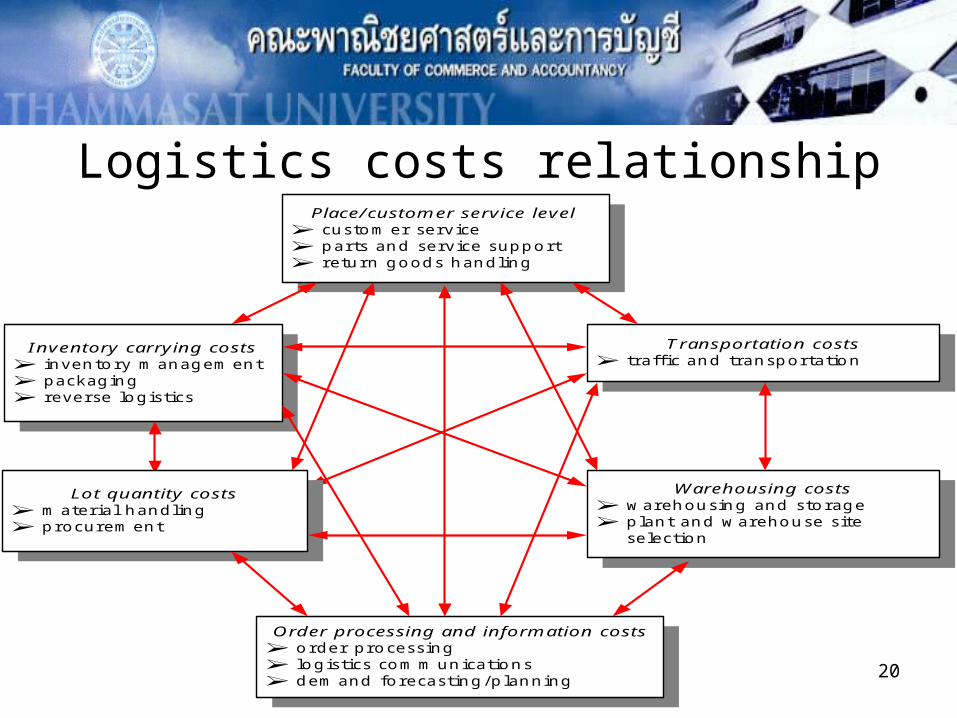
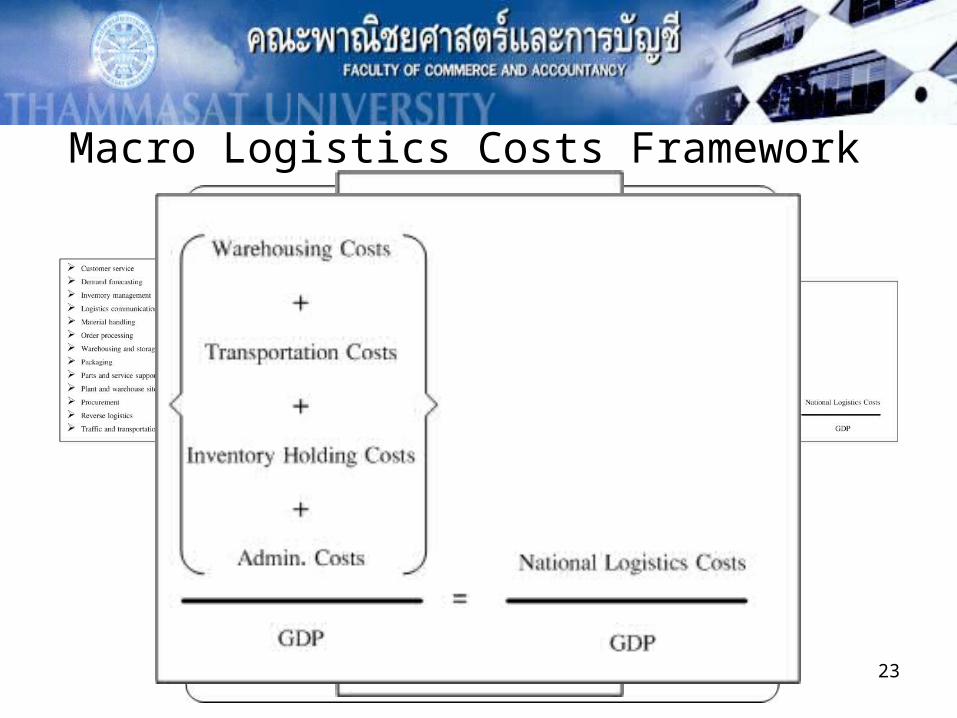
I nvento ry carrying costs invento ry m anagem ent packaging reverse logistics
P lace/ custom er service level custom er service parts and service support return goods handling
O rder processing and info rm ation costs order processing logistics com m unications dem and forecasting/planning
Lot quantity costs m aterial handling procurem ent
T ransportation costs traffi c and transportation
W arehousing costs w arehousing and sto rage plant and w arehouse site
selection
Logistics costs relationship
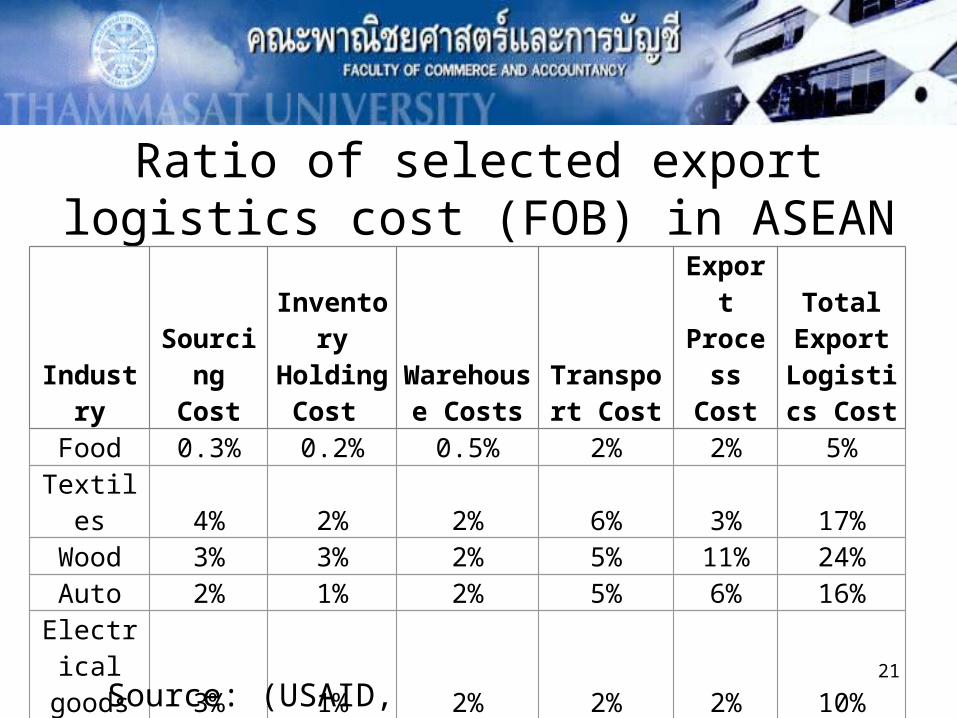
Ratio of selected export logistics cost (FOB) in ASEAN
21
IndustrySourcing
Cost
Inventory Holding
Cost Warehouse
CostsTransport
Cost
Export Process
Cost
Total Export
Logistics Cost
Food 0.3% 0.2% 0.5% 2% 2% 5%Textiles 4% 2% 2% 6% 3% 17%Wood 3% 3% 2% 5% 11% 24%Auto 2% 1% 2% 5% 6% 16%
Electrical goods 3% 1% 2% 2% 2% 10%
Average cost 2.5% 1.4% 1.7% 4% 4.8% 14.4%
Source: (USAID, 2006)
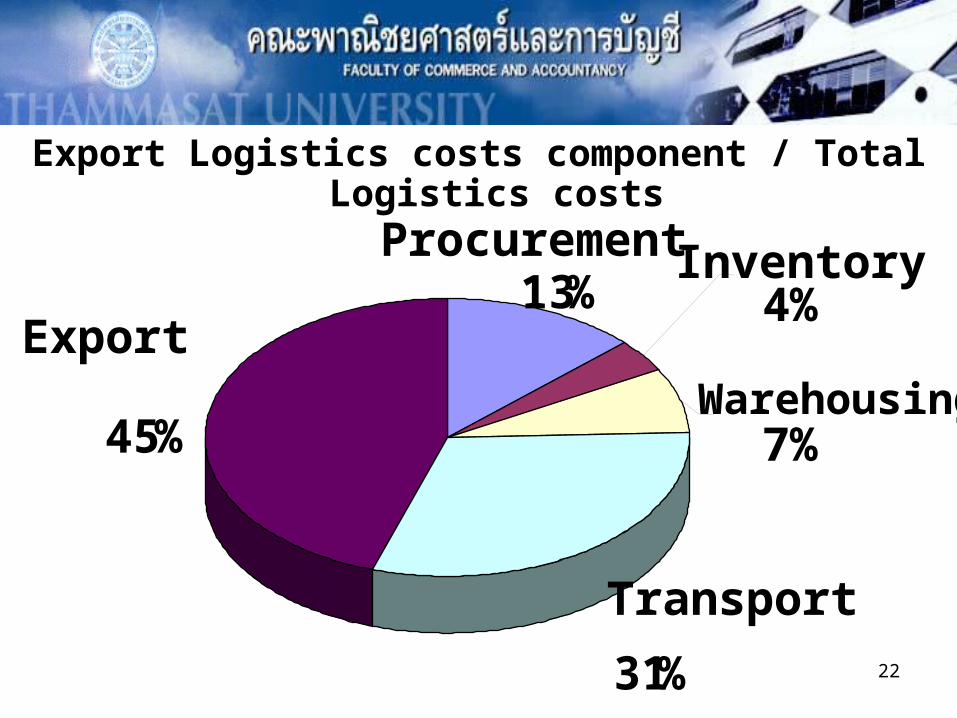
22
Transport
31%
Export
45%
Procurement13%
Inventory4%
Warehousing7%
Export Logistics costs component / Total Logistics costs
23
Macro Logistics Costs Framework
24
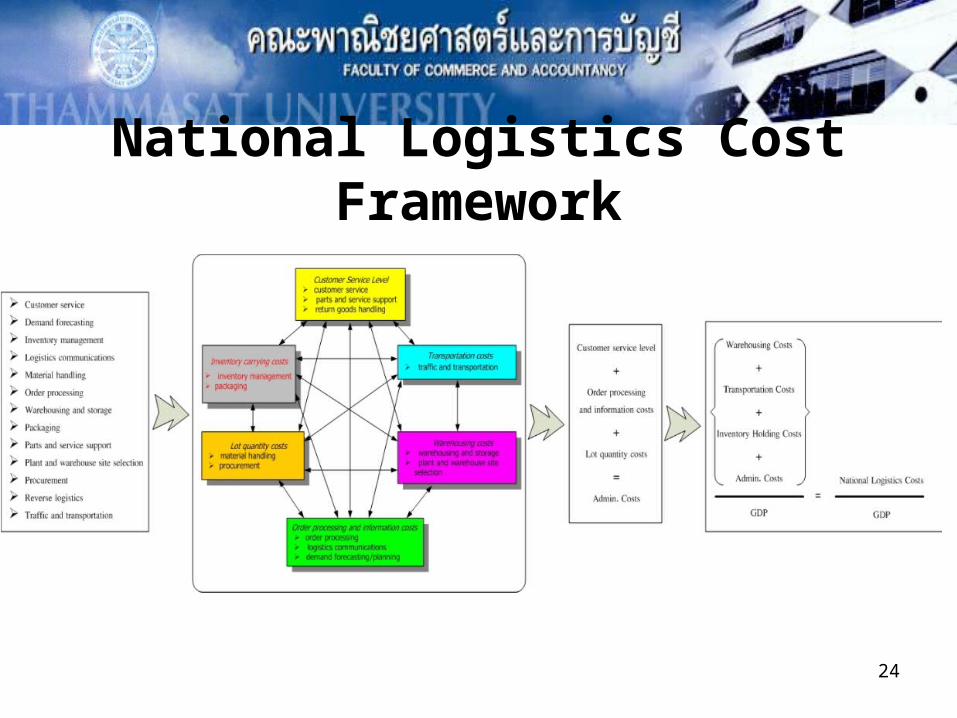
National Logistics Cost Framework
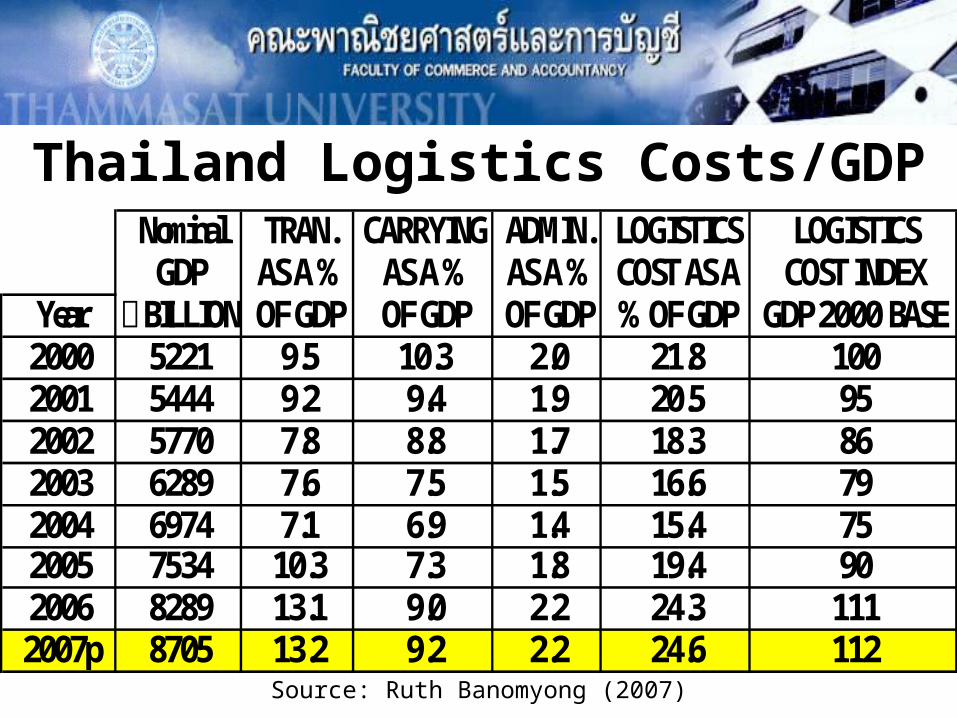
Thailand Logistics Costs/GDPNominal TRAN. CARRYING ADMIN. LOGISTICS LOGISTICSGDP AS A % AS A % AS A % COST AS A COST INDEX
Year ฿ BILLIONOF GDP OF GDP OF GDP % OF GDP GDP 2000 BASE2000 5221 9.5 10.3 2.0 21.8 1002001 5444 9.2 9.4 1.9 20.5 952002 5770 7.8 8.8 1.7 18.3 862003 6289 7.6 7.5 1.5 16.6 792004 6974 7.1 6.9 1.4 15.4 752005 7534 10.3 7.3 1.8 19.4 902006 8289 13.1 9.0 2.2 24.3 1112007p 8705 13.2 9.2 2.2 24.6 112
Source: Ruth Banomyong (2007)
26
Some Future trends...• Macro Logistics cost is increasing
– Transport cost – Inventory carrying cost
• Thammasat Annual Logistics Index (3rd quarter)
27
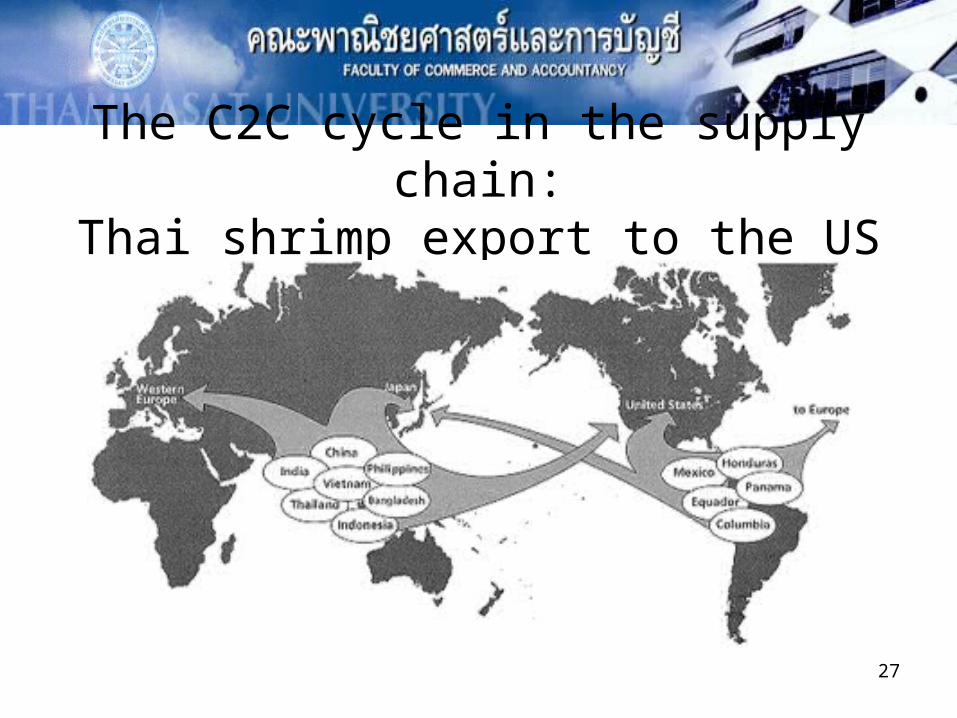
The C2C cycle in the supply chain:Thai shrimp export to the US
28
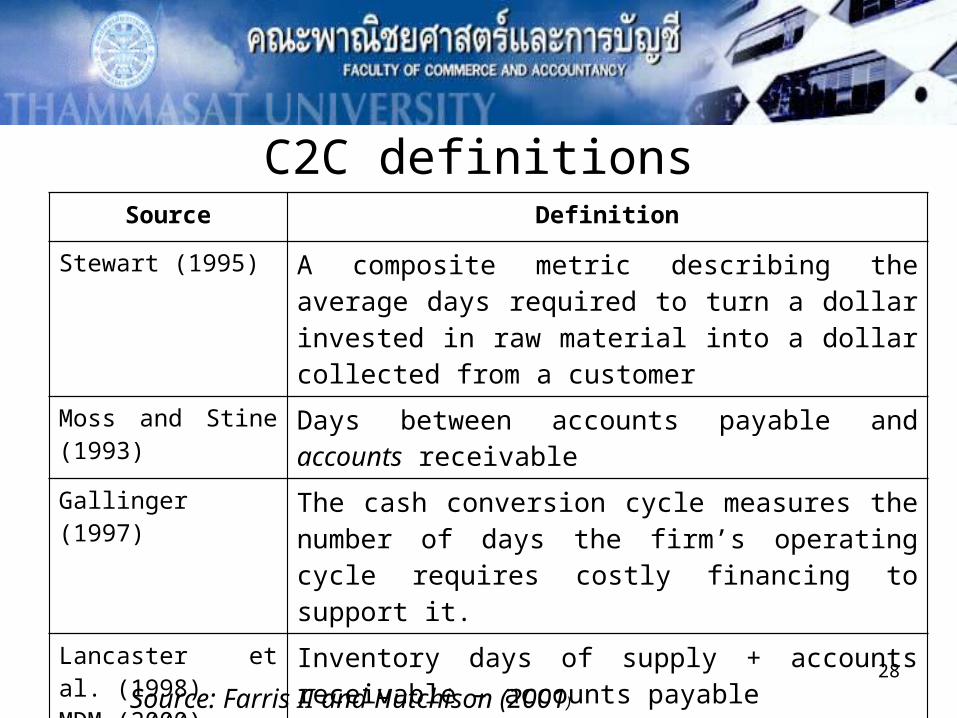
C2C definitionsSource Definition
Stewart (1995) A composite metric describing the average days required to turn a dollar invested in raw material into a dollar collected from a customer
Moss and Stine (1993)
Days between accounts payable and accounts receivable
Gallinger (1997) The cash conversion cycle measures the number of days the firm’s operating cycle requires costly financing to support it.
Lancaster et al. (1998)MDM (2000)Schilling (1996)Soenen (1993)
Inventory days of supply + accounts receivable – accounts payable
Source: Farris II and Hutchison (2001)
29
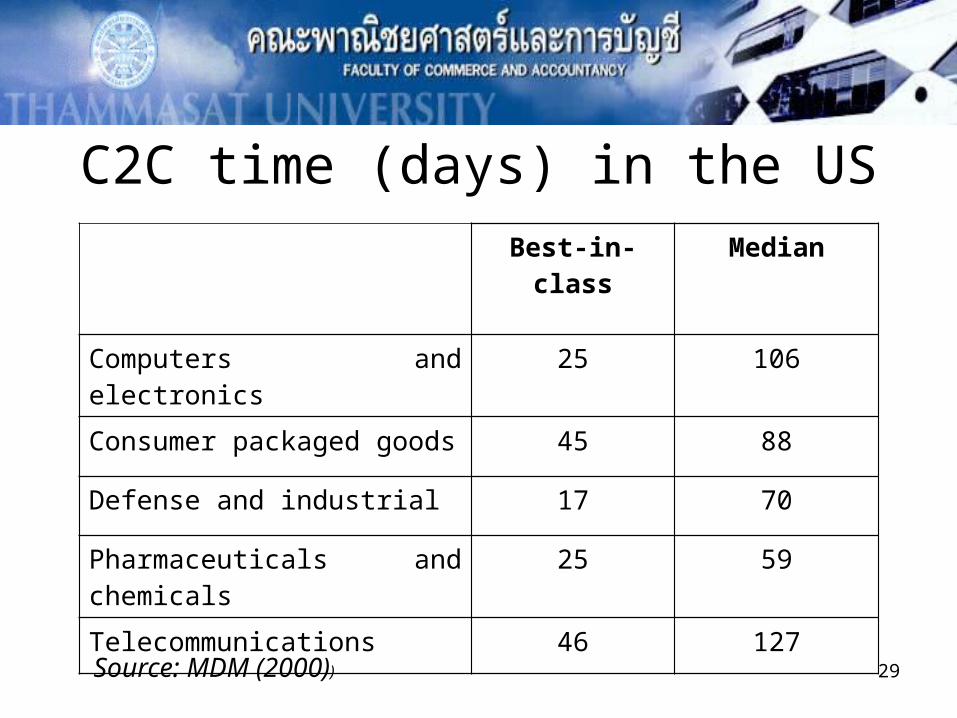
C2C time (days) in the USBest-in-class Median
Computers and electronics 25 106
Consumer packaged goods 45 88
Defense and industrial 17 70
Pharmaceuticals and chemicals
25 59
Telecommunications 46 127
Source: MDM (2000))
30
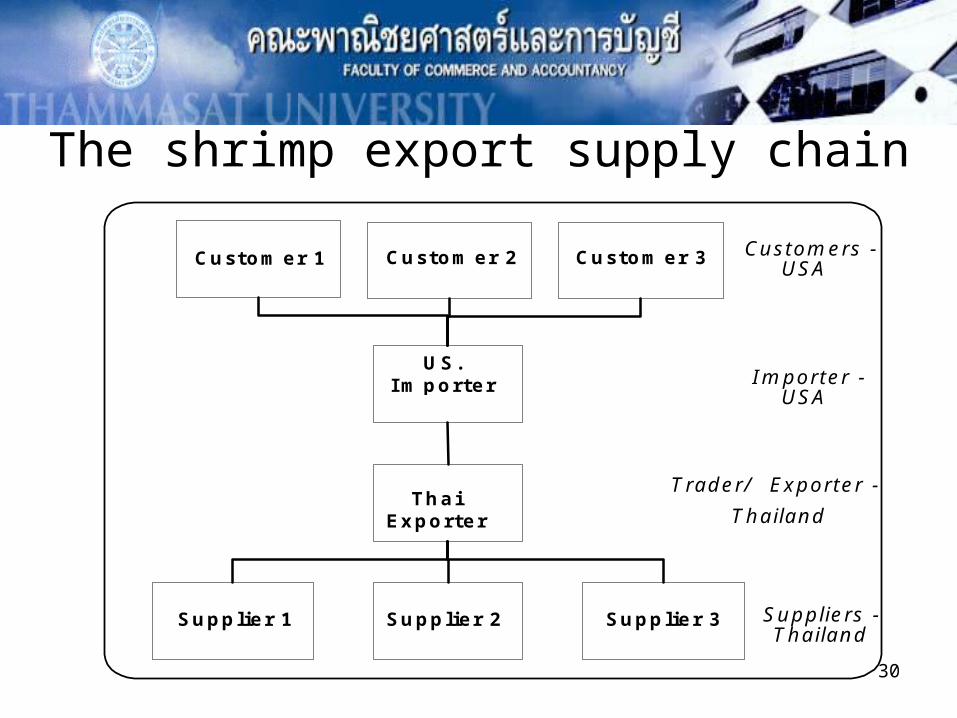
The shrimp export supply chain
Customer 2
US. Importer
Thai Exporter
Supplier 1 Supplier 3 Supplier 2 Suppliers - Thailand
Customers - USA
Importer - USA
Trader/ Exporter -
Thailand
Customer 1 Customer 3
31
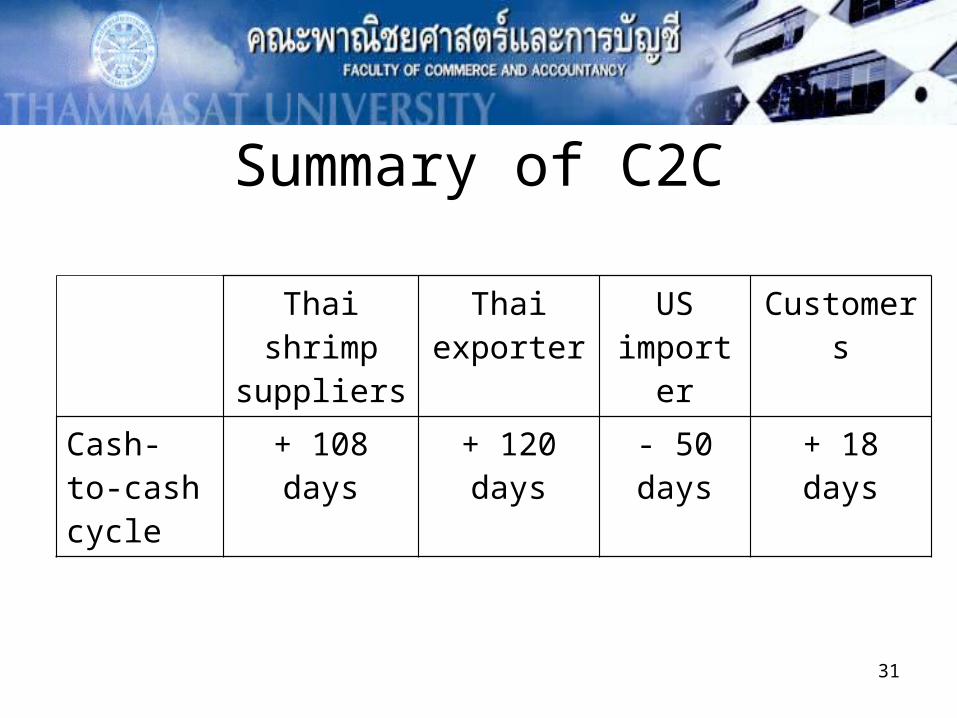
Summary of C2C
Thai shrimp suppliers
Thai exporter
US importer
Customers
Cash-to-cash cycle
+ 108 days + 120 days - 50 days + 18 days

32
Thank you for your attention
Questions
&
Answers