1 Development of Financial Markets in India Rakesh Mohan Deputy Governor Reserve Bank of India...
26
1 Development of Financial Markets in India Rakesh Mohan Deputy Governor Reserve Bank of India Lecture at the First Indian-French Financial Forum at Mumbai, May 16, 2007
-
Upload
gabriel-jackson -
Category
Documents
-
view
213 -
download
0
Transcript of 1 Development of Financial Markets in India Rakesh Mohan Deputy Governor Reserve Bank of India...

1
Development of Financial Markets in India
Rakesh MohanDeputy Governor
Reserve Bank of India
Lecture at the First Indian-French Financial Forum
at Mumbai, May 16, 2007

2
Scheme of the Presentation
Role of Financial Markets Money Market Government Securities Market Foreign Exchange Market Financial Market Integration

3
Role of Financial Markets
Intermediate between savers and investors Generate resources for investment and growth Allocate resources efficiently Improve the efficacy of the transmission
mechanism of monetary policy
4
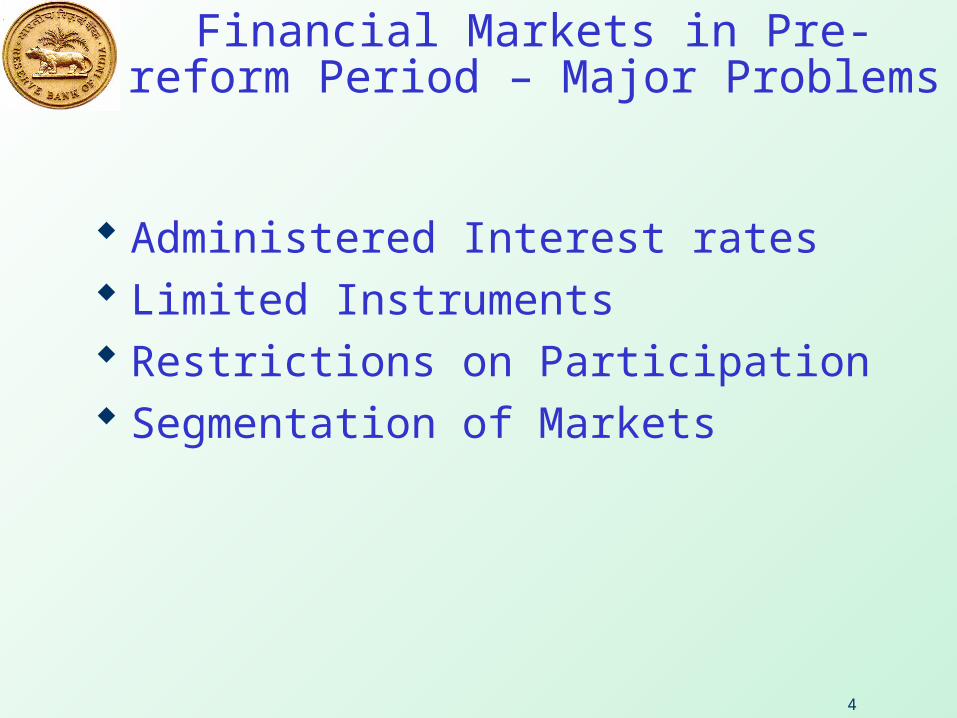
Financial Markets in Pre-reform Period – Major Problems
Administered Interest rates Limited Instruments Restrictions on Participation Segmentation of Markets

5
Money Market
Role of the Money Market Key role in the transmission of monetary policy
impulses Major Reforms Introduced
Development of the Liquidity Adjustment Facility Development of collateralised instruments – CBLO and
Market Repo Modification in issuance norms and maturity profile of
CD and CP Setting up of central counter party – Clearing
Corporation of India Ltd. (CCIL)

6
Money MarketImpact – Increase in Activity
(Rupees crore)
Average Daily Turnover Outstanding Amount
Year Call Money Market
Market Repo
(Outside the LAF)
Collateralised Borrowing and
Lending Obligation
(CBLO)
Term Money Market
Money Market - Total (2 to5)
Commercial
Paper
Certificates of Deposit
1 2 3 4 5 6 7 8
1997-98 22709 - - - 22709 1500 14296
1998-99 26500 - - - 26500 4770 3717
1999-00 23161 6895 - - 30056 7014 1908
2000-01 32157 10500 - - 42657 6751 1199
2001-02 35144 30161 - 195 65500 7927 949
2002-03 29421 46960 30 341 76752 8268 1224
2003-04 17191 10435 515 519 28660 7835 3212
2004-05 14170 17135 6697 526 38528 11723 6052
2005-06 17979 21183 20039 833 60034 17285 27298
2006-07 21725 33676 32390 1012 88803 21478 64954

7
Money MarketImpact – Decline in Volatility
LAF Corridor and Call Rate
0
5
10
15
20
25
5-Ju
n-00
11-J
an-
01
19-A
ug-
01
27-M
ar-
02
2-N
ov-
02
10-J
un-
03
16-J
an-
04
23-A
ug-
04
31-M
ar-
05
6-N
ov-
05
14-J
un-
06
20-J
an-
07
Per c
ent
Call Rate Reverse Repo Rate Repo Rate

8
Money MarketImpact – Decline in Volatility
Variation in Call Money Rates
0.0
0.1
0.2
0.3
0.4
0.5
0.6
0.7
0.8
0.9
1.0
1993
-94
1994
-95
1995
-96
1996
-97
1997
-98
1998
-99
1999
-00
2000
-01
2001
-02
2002
-03
2003
-04
2004
-05
2005
-06
2006
-07
Coe
ffici
ent o
f var
iatio
n

9
Money Market Impact – Improvement in Efficiency
Bid-Ask Spread in the Call Money Market
-0.50
-0.25
0.00
0.25
0.50
0.75
1.00
1.25
1.50
4/1
/20
04
5/2
0/2
00
4
7/2
/20
04
8/1
3/2
00
4
9/2
7/2
00
4
11
/6/2
00
4
12/1
5/2
00
4
1/1
9/2
00
5
2/2
5/2
00
5
4/6
/20
05
5/1
6/2
00
5
6/2
1/2
00
5
7/2
9/2
00
5
9/5
/20
05
10/1
1/2
00
5
11
/19
/20
05
12/2
4/2
00
5
1/3
1/2
00
6
3/8
/20
06
4/1
8/2
00
6
5/2
5/2
00
6
6/2
9/2
00
6
8/3
/20
06
9/8
/20
06
10/1
6/2
00
6
11
/23
/20
06
12/2
9/2
00
6
2/7
/07
Per
cen
t
Bid-Ask Spread Mean Mean + 2SD Mean - 2SD

10
Government Securities Market
Significance of the G-Sec. Market Enables smooth raising of government
borrowings Risk free rupee yield curve provides a benchmark
for pricing other debt instruments Plays a key role in the monetary policy
transmission mechanism
11
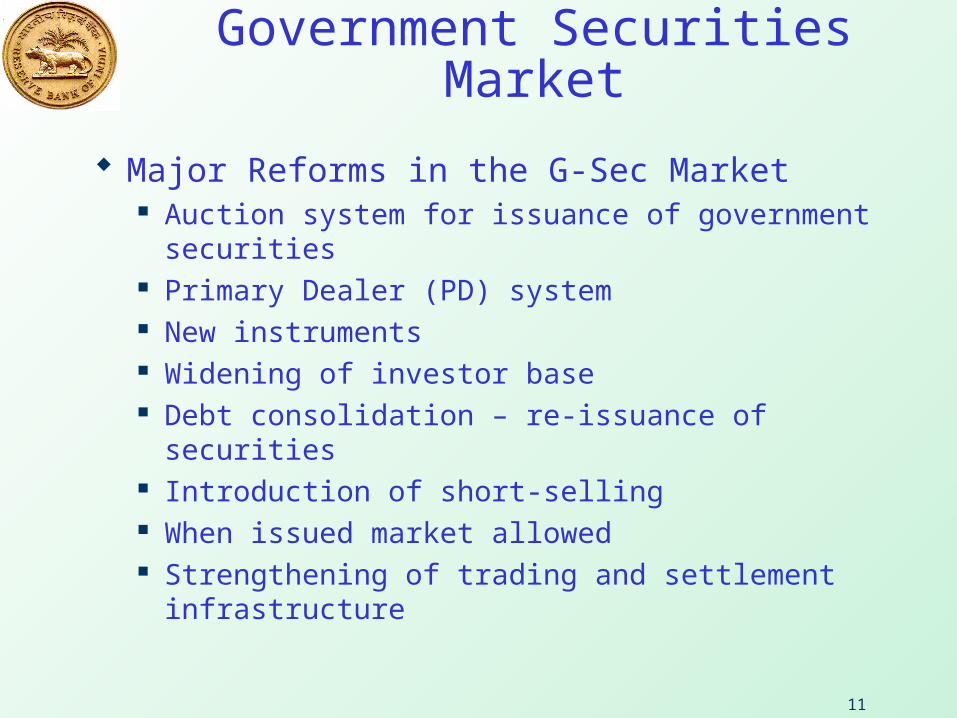
Government Securities Market
Major Reforms in the G-Sec Market Auction system for issuance of government securities Primary Dealer (PD) system New instruments Widening of investor base Debt consolidation – re-issuance of securities Introduction of short-selling When issued market allowed Strengthening of trading and settlement infrastructure

12
Government Securities Market - Impact
Turnover in Government Securities Market
0
20
40
60
80
100
120
1998-99 1999-00 2000-01 2001-02 2002-03 2003-04 2004-05 2005-06 2006-07
0
50
100
150
200
250
300
350
400
Per cent of GDP Per cent of Stock (right scale)

13
Government Securities MarketReasons for the Recent Decline in Activity
Yield and Annual Turnover (market value)
0
500000
1000000
1500000
2000000
2500000
3000000
3500000
1996-97
1997-98
1998-99
1999-00
2000-01
2001-02
2002-03
2003-04
2004-05
2005-06
2006-07
Rs. c
rore
0
2
4
6
8
10
12
14
16
Per c
ent
Annual Turnover Yield on 10-year security (end-March)

14
Government Securities MarketEmergence of Yield Curve
Yield Curve Movement - SGL Transactions
4
6
8
10
12
14
1 3 5 7 9 11 13 15 17 19 21 23 25 27 29
Years to maturity
Per c
ent
Mar-97 Mar-00 Mar-03 Mar-04 Mar-05 Mar-06

15
Foreign Exchange Market
Major Reforms Market-determined exchange rate in 1993 Current account convertibility in 1994 Substantial liberalisation of capital account
transactions Greater flexibility to market participants to
undertake foreign exchange operations Improvement in market infrastructure
16
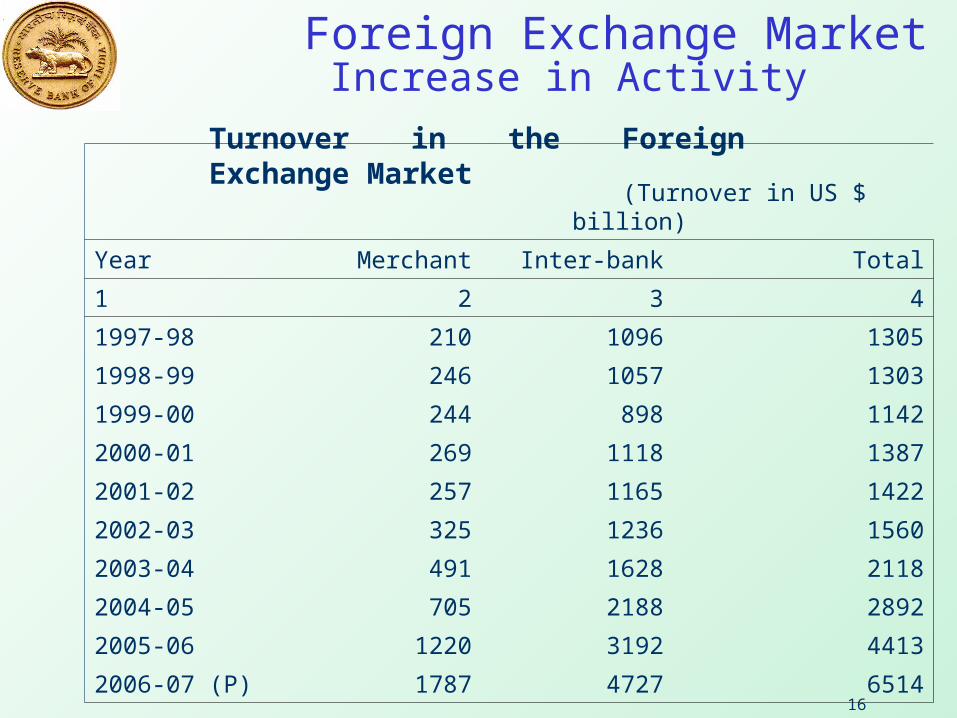
Foreign Exchange MarketIncrease in Activity
Turnover in the Foreign Exchange Market (Turnover in US $ billion)
Year Merchant Inter-bank Total
1 2 3 4
1997-98 210 1096 1305
1998-99 246 1057 1303
1999-00 244 898 1142
2000-01 269 1118 1387
2001-02 257 1165 1422
2002-03 325 1236 1560
2003-04 491 1628 2118
2004-05 705 2188 2892
2005-06 1220 3192 4413
2006-07 (P) 1787 4727 6514
17
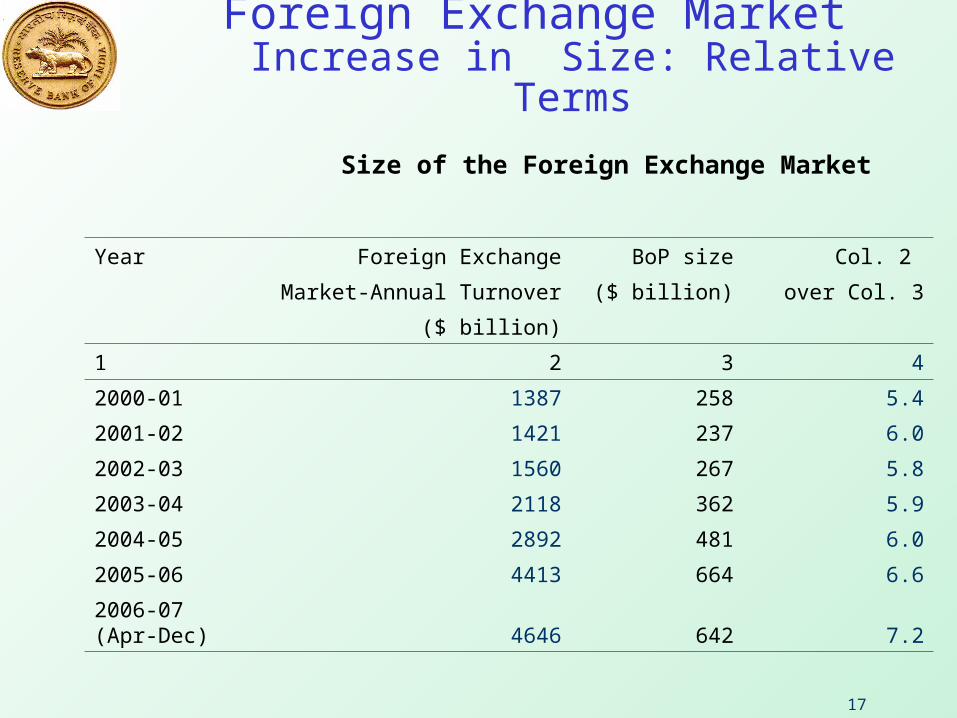
Foreign Exchange Market Increase in Size: Relative Terms
Size of the Foreign Exchange Market
Year Foreign Exchange BoP size Col. 2
Market-Annual Turnover ($ billion) over Col. 3
($ billion)
1 2 3 4
2000-01 1387 258 5.4
2001-02 1421 237 6.0
2002-03 1560 267 5.8
2003-04 2118 362 5.9
2004-05 2892 481 6.0
2005-06 4413 664 6.6
2006-07 (Apr-Dec) 4646 642 7.2

18
Foreign Exchange Market Improvement in Efficiency
Bid-Ask Spread of Select Currencies agains US Dollar
0.0
0.2
0.4
0.6
0.8
1.0
1.2
1.4
1.6
1/3/
2000
5/3/
2000
9/3/
2000
1/3/
2001
5/3/
2001
9/3/
2001
1/3/
2002
5/3/
2002
9/3/
2002
1/3/
2003
5/3/
2003
9/3/
2003
1/3/
2004
5/3/
2004
9/3/
2004
1/3/
2005
5/3/
2005
9/3/
2005
1/3/
2006
5/3/
2006
9/3/
2006
1/3/
2007
per c
ent
INR GBP EUR JPY
19
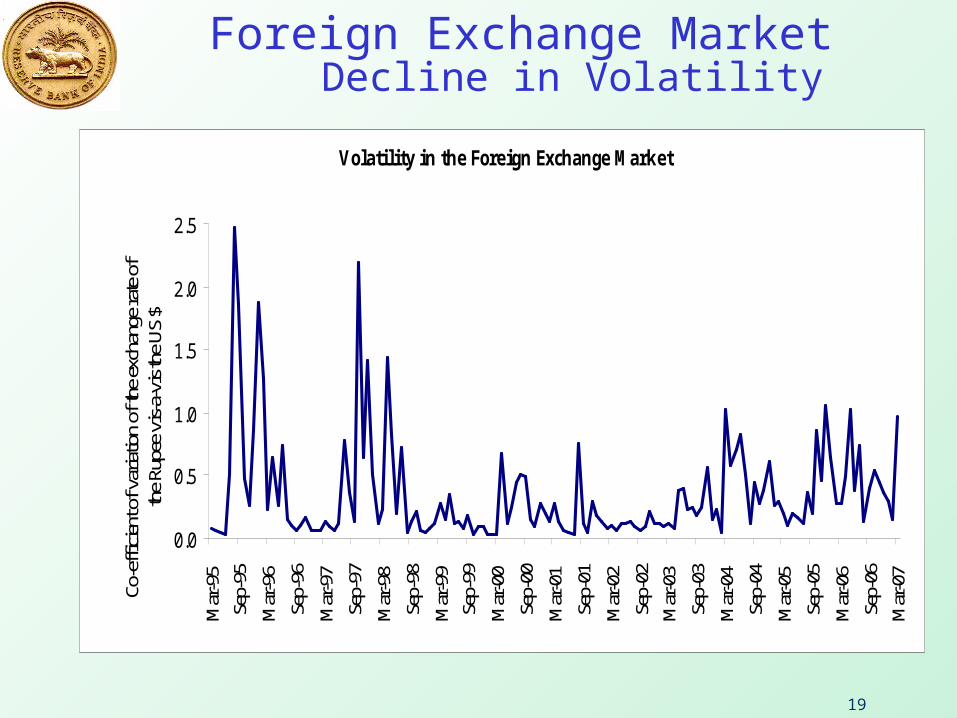
Foreign Exchange Market Decline in Volatility
Volatility in the Foreign Exchange Market
0.0
0.5
1.0
1.5
2.0
2.5M
ar-9
5Se
p-95
Mar
-96
Sep-
96M
ar-9
7Se
p-97
Mar
-98
Sep-
98M
ar-9
9Se
p-99
Mar
-00
Sep-
00M
ar-0
1Se
p-01
Mar
-02
Sep-
02M
ar-0
3Se
p-03
Mar
-04
Sep-
04M
ar-0
5Se
p-05
Mar
-06
Sep-
06M
ar-0
7
Co-e
ffic
ient
of v
aria
tion
of th
e ex
chan
ge ra
te o
f th
e Ru
pee
vis-
a-vi
s the
US
$

20
Financial Market Integration
Significance For monetary policy transmission framework
Evidence of stronger integration during the recent period (2000-2006) than the earlier period (1993-2000)
Correlation between the call rate and the reverse repo improved from 0.35 to 0.86
Correlation between the call rate and the 364-day Treasury Bills yield improved from 0.40 to 0.92
Correlation between the call rate and the 10-year yield improved from 0.46 to 0.88
Correlation between the call rate and the 6-months forward premia improved marginally from 0.61 to 0.62
Correlation between interest rates (the call rate) and the stock market improved from -0.10 to -0.23.
21
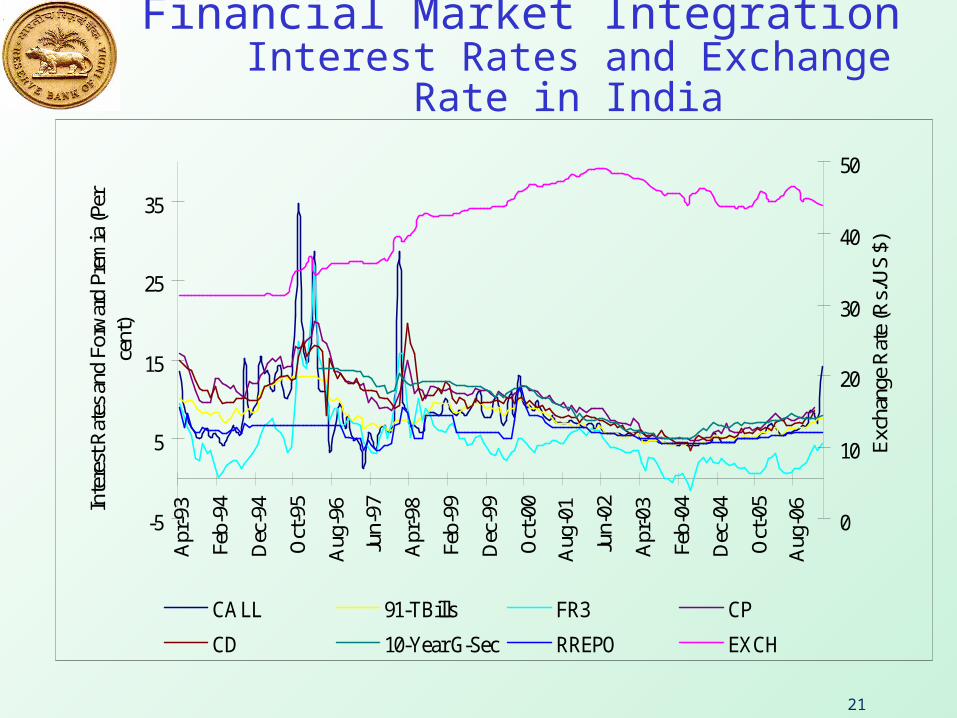
Financial Market Integration Interest Rates and Exchange Rate in India
-5
5
15
25
35A
pr-9
3
Feb-
94
Dec
-94
Oct
-95
Aug
-96
Jun-
97
Apr
-98
Feb-
99
Dec
-99
Oct
-00
Aug
-01
Jun-
02
Apr
-03
Feb-
04
Dec
-04
Oct
-05
Aug
-06In
tere
st R
ates
and
For
war
d Pr
emia
(Per
ce
nt)
0
10
20
30
40
50
Exc
hang
e R
ate
(Rs.
/US
$)
CALL 91-TBills FR3 CP
CD 10-Year G-Sec RREPO EXCH
22
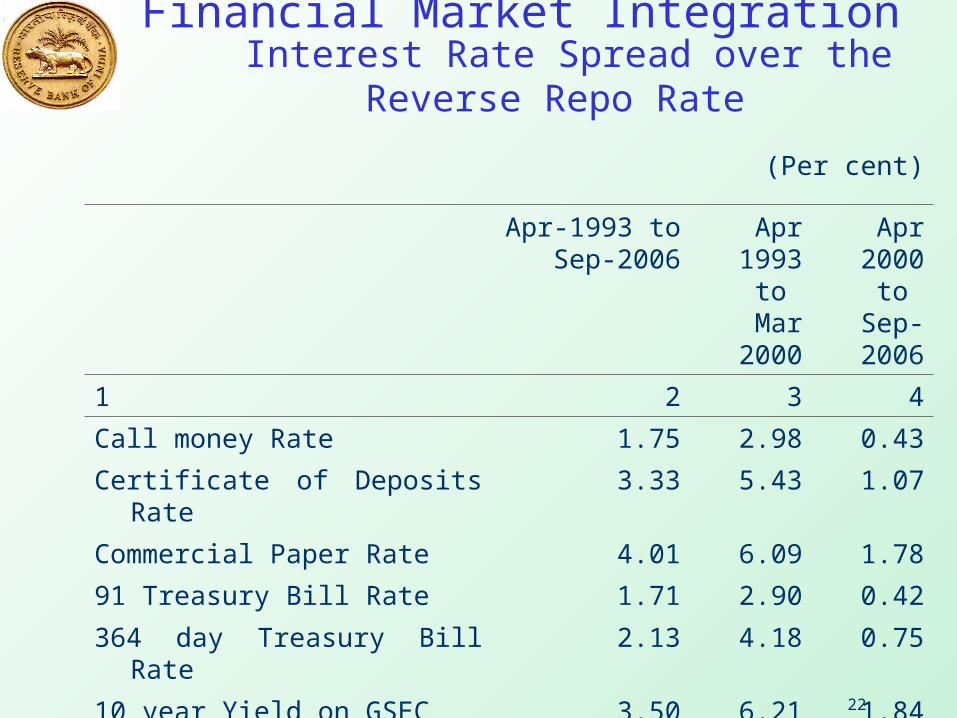
Financial Market Integration Interest Rate Spread over the Reverse Repo Rate
(Per cent)
Apr-1993 to Sep-2006
Apr 1993 to
Mar 2000
Apr 2000 to
Sep-2006
1 2 3 4
Call money Rate 1.75 2.98 0.43
Certificate of Deposits Rate 3.33 5.43 1.07
Commercial Paper Rate 4.01 6.09 1.78
91 Treasury Bill Rate 1.71 2.90 0.42
364 day Treasury Bill Rate 2.13 4.18 0.75
10 year Yield on GSEC 3.50 6.21 1.84
23
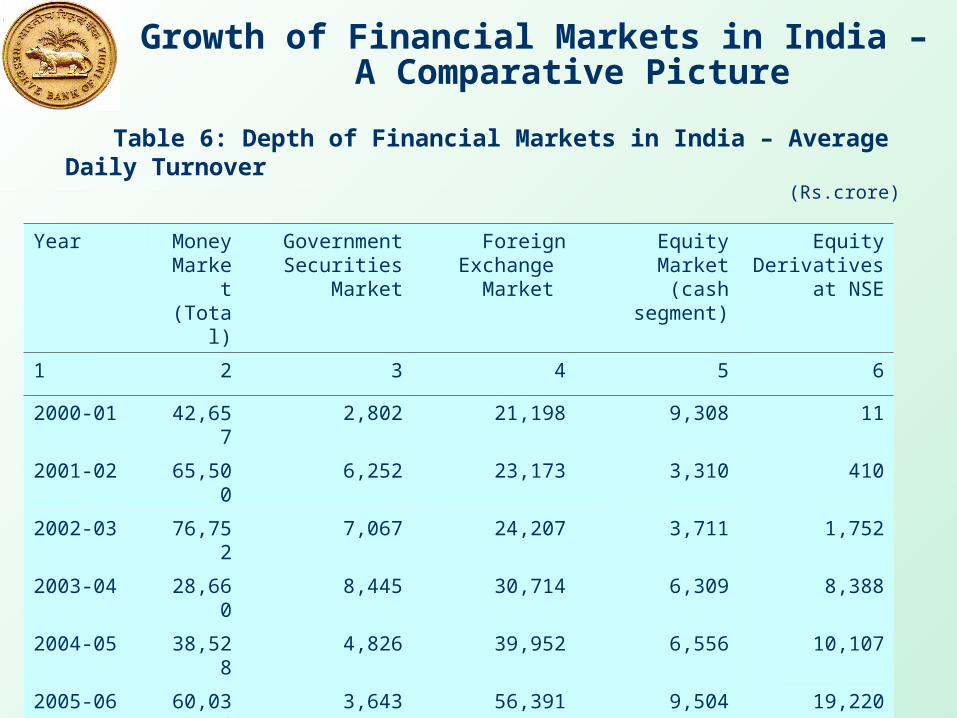
Growth of Financial Markets in India – A Comparative Picture
Table 6: Depth of Financial Markets in India – Average Daily Turnover(Rs.crore)
Year Money Market(Total)
GovernmentSecurities Market
Foreign Exchange
Market
Equity Market(cash segment)
EquityDerivatives
at NSE
1 2 3 4 5 6
2000-01 42,657 2,802 21,198 9,308 11
2001-02 65,500 6,252 23,173 3,310 410
2002-03 76,752 7,067 24,207 3,711 1,752
2003-04 28,660 8,445 30,714 6,309 8,388
2004-05 38,528 4,826 39,952 6,556 10,107
2005-06 60,034 3,643 56,391 9,504 19,220
2006-07 88,803 4,863 83,984 11,760 29,803
24
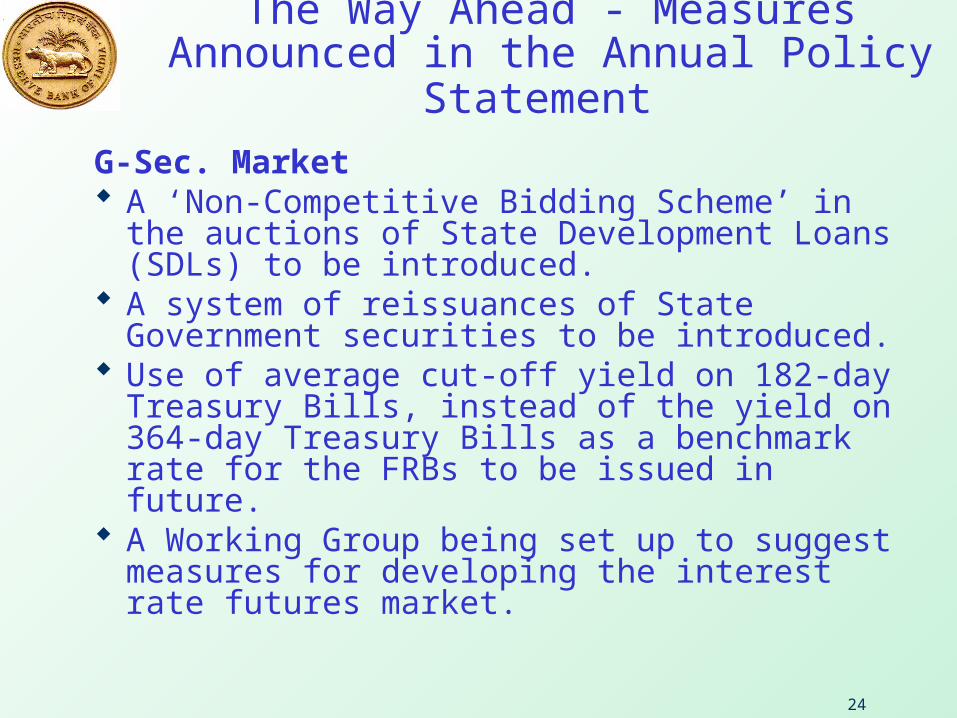
The Way Ahead - Measures Announced in the Annual Policy Statement
G-Sec. Market A ‘Non-Competitive Bidding Scheme’ in the
auctions of State Development Loans (SDLs) to be introduced.
A system of reissuances of State Government securities to be introduced.
Use of average cut-off yield on 182-day Treasury Bills, instead of the yield on 364-day Treasury Bills as a benchmark rate for the FRBs to be issued in future.
A Working Group being set up to suggest measures for developing the interest rate futures market.

25
The Way Ahead - Measures Announced in the Annual Policy Statement
Foreign Exchange Market Further liberalisation of foreign exchange facilities
in view of CFCAC Overseas investment limit to be enhanced Portfolio investment abroad limit to be enhanced Increase in the existing limit for prepayment of ECBs The limit for remittance scheme for individuals to be
enhanced Expanded the range of hedging tools available to the
market participants as also facilitate dynamic hedging by the residents
A Working Group on Currency Futures to be set up

26
Thank
You