1 DETERMINANTS OF DEPOSIT- INSURANCE ADOPTION AND DESIGN Asli Demirgüç-Kunt, World Bank Edward J....
33
1 DETERMINANTS OF DEPOSIT- INSURANCE ADOPTION AND DESIGN Asli Demirgüç-Kunt, World Bank Edward J. Kane, Boston College Luc Laeven, World Bank 5 th Annual Banking Research Conference Sponsored by FDIC Center for Financial Research and the JFSR September 22, 2005
-
Upload
gwen-fowler -
Category
Documents
-
view
215 -
download
0
Transcript of 1 DETERMINANTS OF DEPOSIT- INSURANCE ADOPTION AND DESIGN Asli Demirgüç-Kunt, World Bank Edward J....
1
DETERMINANTS OF DEPOSIT-INSURANCE ADOPTION AND DESIGN
Asli Demirgüç-Kunt, World Bank
Edward J. Kane, Boston College
Luc Laeven, World Bank
5th Annual Banking Research Conference Sponsored by FDIC Center for Financial Research and the JFSR
September 22, 2005

2
Cross-Country Variation in Safety-Net Design
• Most safety nets do not include an explicit deposit-insurance scheme (EDIS). This means that at least a few good EDIS substitutes exist.
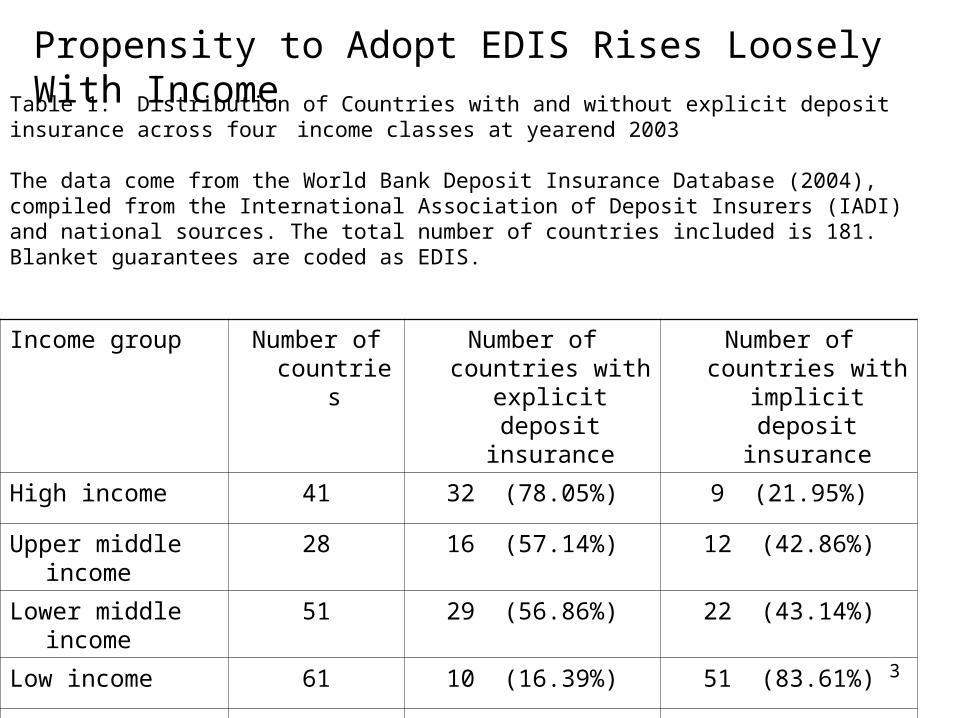
• Pattern: Most of the poorest and least financially developed countries have no EDIS at all and most high-income countries do. As important as the level of financial and economic development may be, political and cultural norms figure to play a role as well.
3
Income group Number of countries
Number of countries with explicit deposit
insurance
Number of countries with implicit deposit
insurance
High income 41 32 (78.05%) 9 (21.95%)
Upper middle income 28 16 (57.14%) 12 (42.86%)
Lower middle income
51 29 (56.86%) 22 (43.14%)
Low income 61 10 (16.39%) 51 (83.61%)
Total 181 87 (48.07%) 94 (51.93%)
Table 1: Distribution of Countries with and without explicit deposit insurance across four income classes at yearend 2003
The data come from the World Bank Deposit Insurance Database (2004), compiled from the International Association of Deposit Insurers (IADI) and national sources. The total number of countries included is 181. Blanket guarantees are coded as EDIS.
Propensity to Adopt EDIS Rises Loosely With Income

4
5
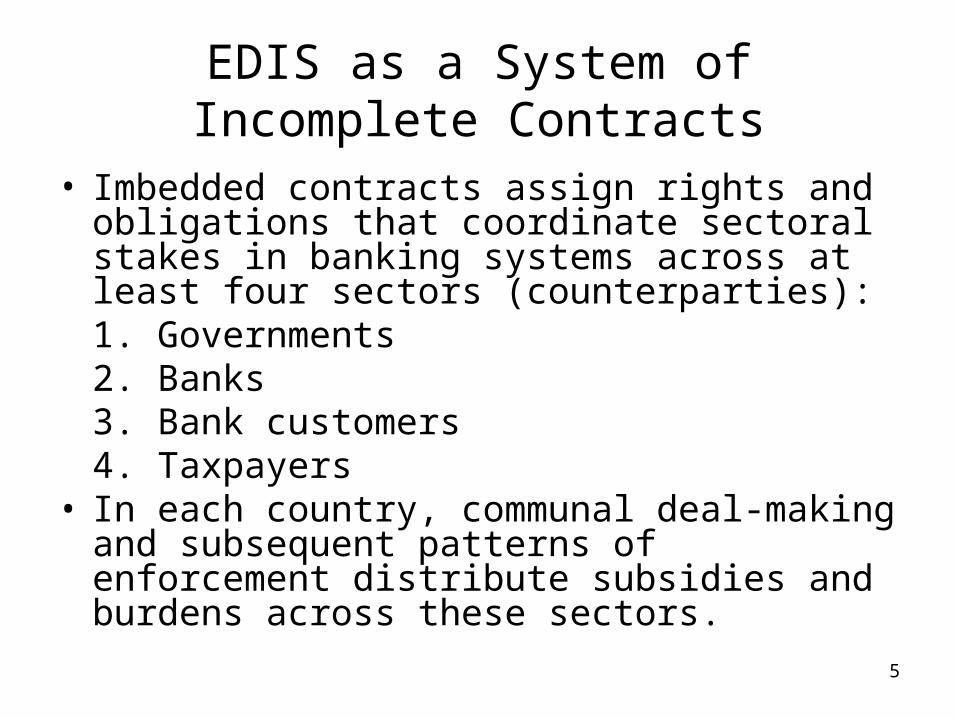
EDIS as a System of Incomplete Contracts
• Imbedded contracts assign rights and obligations that coordinate sectoral stakes in banking systems across at least four sectors (counterparties):
1. Governments2. Banks3. Bank customers4. Taxpayers
• In each country, communal deal-making and subsequent patterns of enforcement distribute subsidies and burdens across these sectors.

6
Safety-Net Design is Classic Problem in Incomplete Contracting
• Essence of contingent contracting is to create offsets to opportunistic incentives facing one’s counterparty.
• To make EDIS contracting fair and efficient, conscientious officials must impose and enforce risk-shifting controls on banks strong enough to keep the value of taxpayers’ multiperiod obligations (social costs) equal to social benefits
• From a contracting perspective, taxpayers may be said to accept responsibility for catastrophic risks. In doing so, they provide market-completion services to banks and their customers.
7
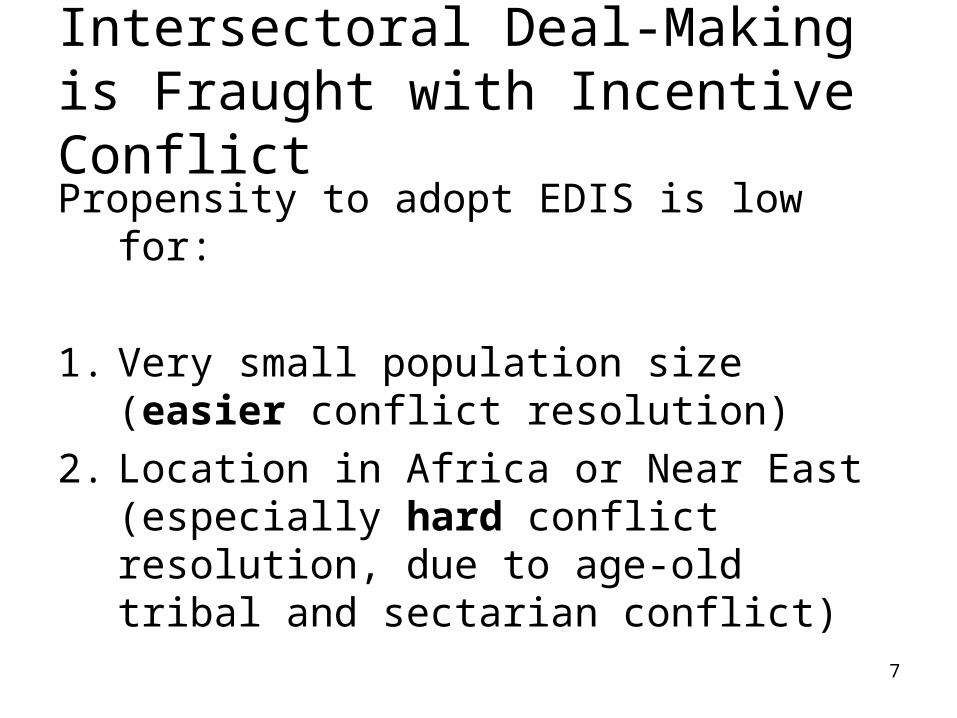
Intersectoral Deal-Making is Fraught with Incentive ConflictPropensity to adopt EDIS is low for:
1. Very small population size (easier conflict resolution)
2. Location in Africa or Near East (especially hard conflict resolution, due to age-old tribal and sectarian conflict)
8
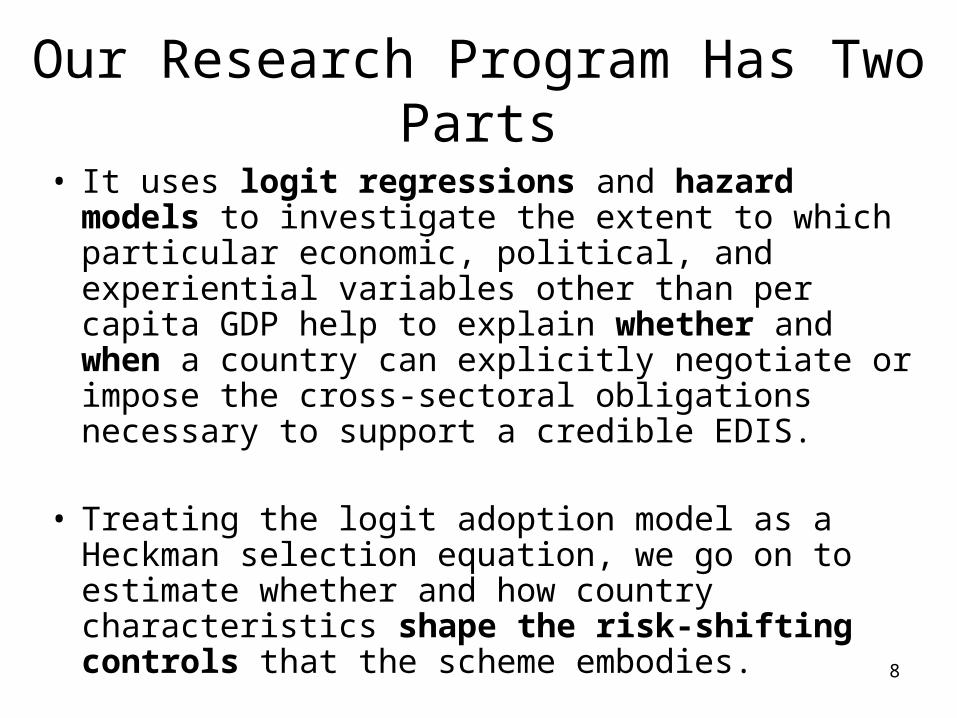
Our Research Program Has Two Parts
• It uses logit regressions and hazard models to investigate the extent to which particular economic, political, and experiential variables other than per capita GDP help to explain whether and when a country can explicitly negotiate or impose the cross-sectoral obligations necessary to support a credible EDIS.
• Treating the logit adoption model as a Heckman selection equation, we go on to estimate whether and how country characteristics shape the risk-shifting controls that the scheme embodies.
9
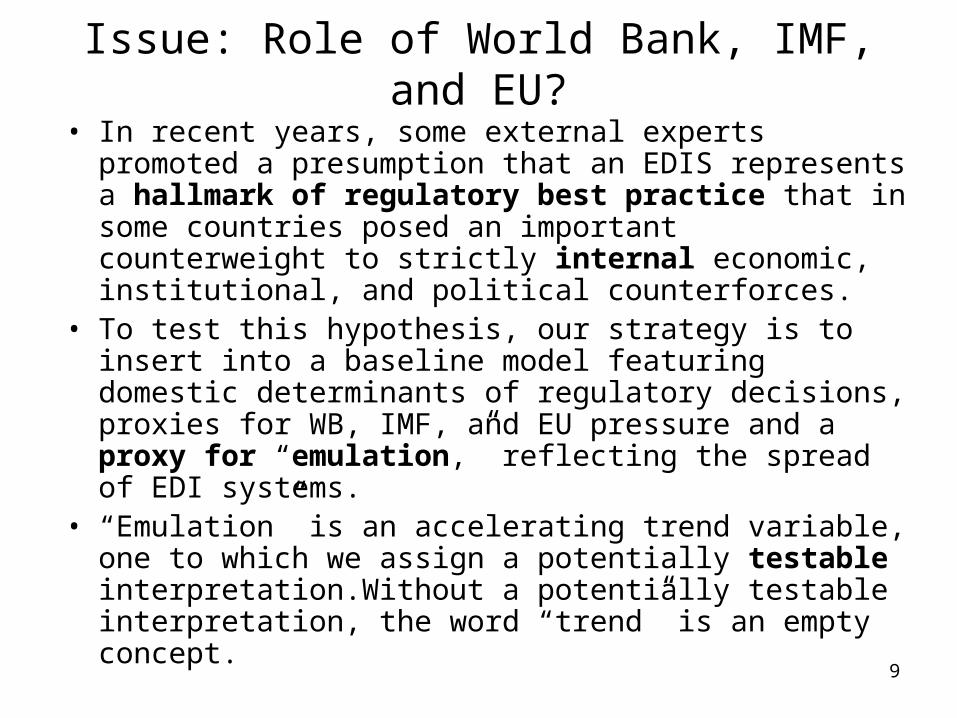
Issue: Role of World Bank, IMF, and EU?
• In recent years, some external experts promoted a presumption that an EDIS represents a hallmark of regulatory best practice that in some countries posed an important counterweight to strictly internal economic, institutional, and political counterforces.
• To test this hypothesis, our strategy is to insert into a baseline model featuring domestic determinants of regulatory decisions, proxies for WB, IMF, and EU pressure and a proxy for “emulation,” reflecting the spread of EDI systems.
• “Emulation” is an accelerating trend variable, one to which we assign a potentially testable interpretation.Without a potentially testable interpretation, the word “trend” is an empty concept.
10
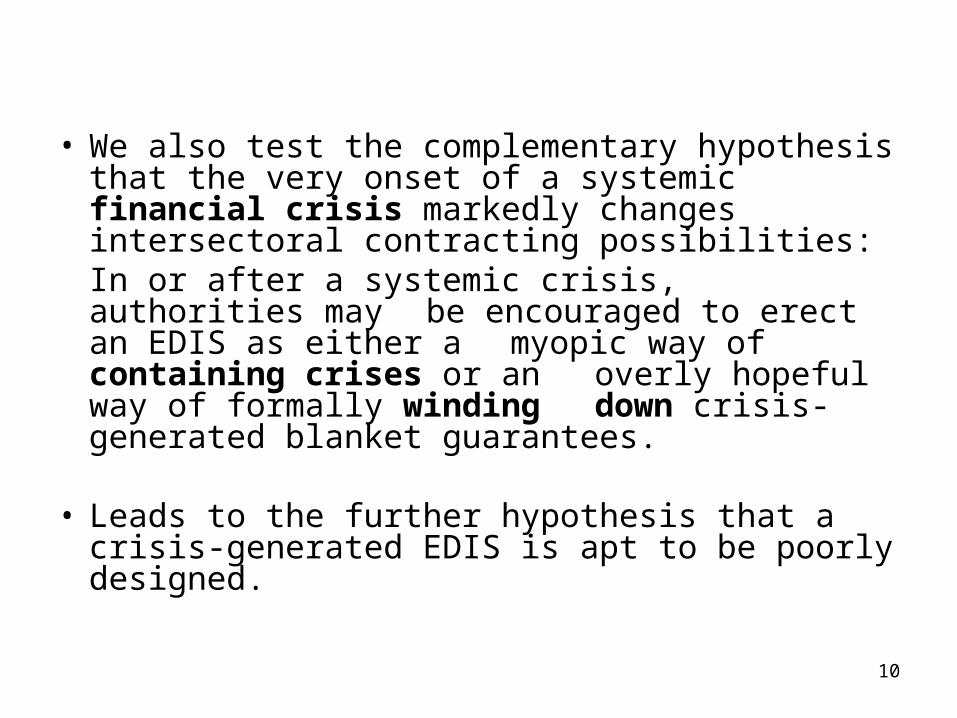
• We also test the complementary hypothesis that the very onset of a systemic financial crisis markedly changes intersectoral contracting possibilities:
In or after a systemic crisis, authorities may be encouraged to erect an EDIS as either a myopic way of containing crises or an overly hopeful way of formally winding down crisis-generated blanket guarantees.
• Leads to the further hypothesis that a crisis-generated EDIS is apt to be poorly designed.
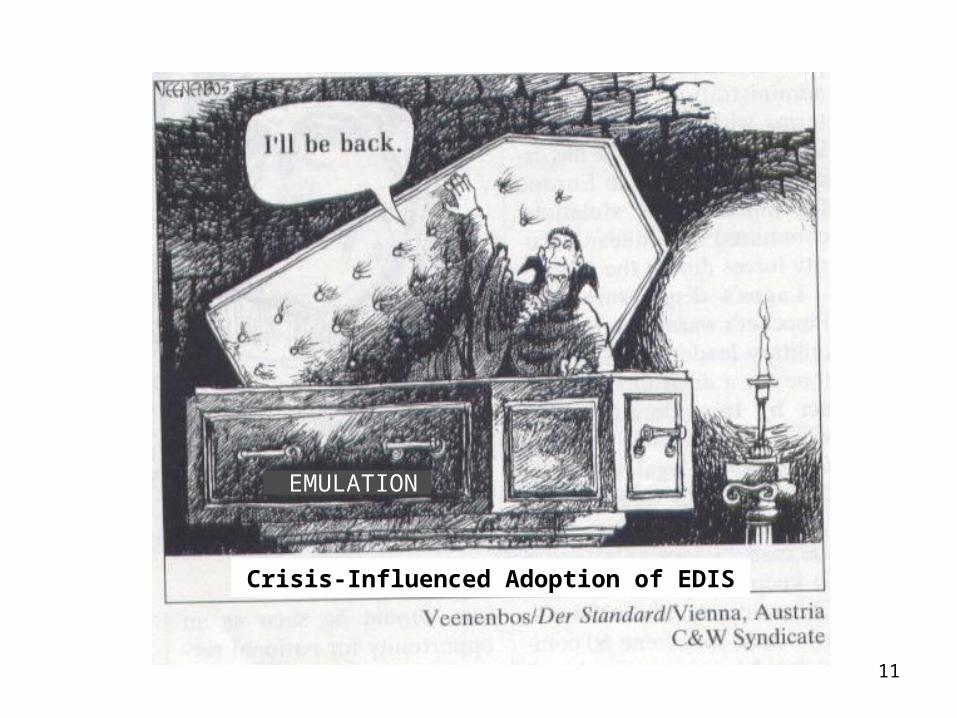
11
Crisis-Influenced Adoption of EDIS
EMULATION

12
Hypothesis-Testing Strategy
• As potential economic determinants, we include macroeconomic conditions, financial-crisis events, fiscal costs incurred in crises, and inefficiencies presumed to be associated with state-owned banks.
• As potential institutional and political determinants, we include various features of the country’s private and public contracting environments as proxies for:– Transparency (T)– Deterrency (D)– Bonding (B)– Accountability (A)

13
Table 2 names the design features our dataset covers and the country characteristics that the regression experiments employ. The unit of observation is a country-year. The table reports summary statistics on all variables.
Endogenous Explanatory Explanatory
Deposit Insurance (EI) Real Interest Rate Polity Score
Administration Inflation Executive Constraints
Membership GDP Growth Political Competition
Foreign currency deposits Credit Growth Bureaucracy
Interbank deposits Terms-of-Trade Change Corruption
Coinsurance GDP per capita Dem. Accountability
Permanent fund Emulation Law & Order
Funding Crisis Dummy Gov. Ownership
Coverage ratio Post-crisis adoption Privatization
Moral-hazard compositeFiscal cost / GDP WB, IMF, EU
14
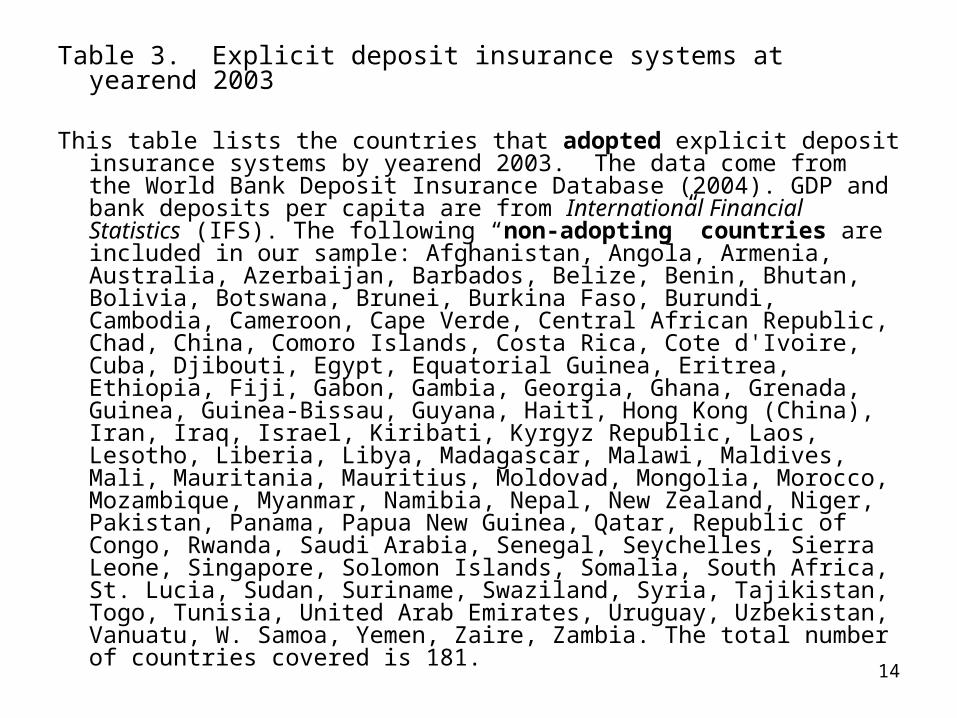
Table 3. Explicit deposit insurance systems at yearend 2003
This table lists the countries that adopted explicit deposit insurance systems by yearend 2003. The data come from the World Bank Deposit Insurance Database (2004). GDP and bank deposits per capita are from International Financial Statistics (IFS). The following “non-adopting” countries are included in our sample: Afghanistan, Angola, Armenia, Australia, Azerbaijan, Barbados, Belize, Benin, Bhutan, Bolivia, Botswana, Brunei, Burkina Faso, Burundi, Cambodia, Cameroon, Cape Verde, Central African Republic, Chad, China, Comoro Islands, Costa Rica, Cote d'Ivoire, Cuba, Djibouti, Egypt, Equatorial Guinea, Eritrea, Ethiopia, Fiji, Gabon, Gambia, Georgia, Ghana, Grenada, Guinea, Guinea-Bissau, Guyana, Haiti, Hong Kong (China), Iran, Iraq, Israel, Kiribati, Kyrgyz Republic, Laos, Lesotho, Liberia, Libya, Madagascar, Malawi, Maldives, Mali, Mauritania, Mauritius, Moldovad, Mongolia, Morocco, Mozambique, Myanmar, Namibia, Nepal, New Zealand, Niger, Pakistan, Panama, Papua New Guinea, Qatar, Republic of Congo, Rwanda, Saudi Arabia, Senegal, Seychelles, Sierra Leone, Singapore, Solomon Islands, Somalia, South Africa, St. Lucia, Sudan, Suriname, Swaziland, Syria, Tajikistan, Togo, Tunisia, United Arab Emirates, Uruguay, Uzbekistan, Vanuatu, W. Samoa, Yemen, Zaire, Zambia. The total number of countries covered is 181.
15
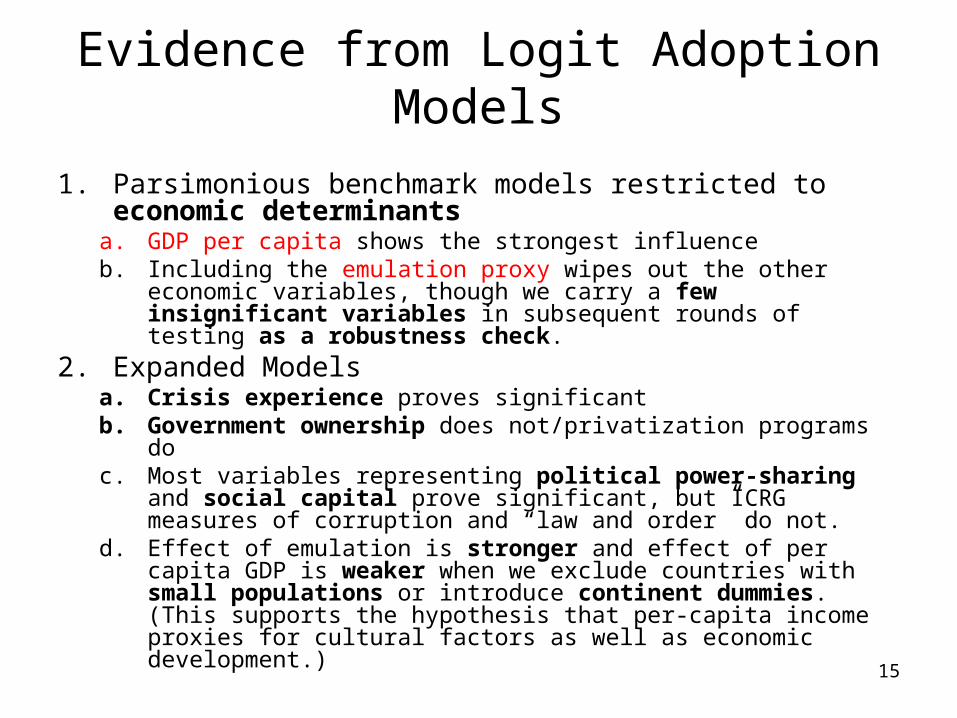
Evidence from Logit Adoption Models
1. Parsimonious benchmark models restricted to economic determinants
a. GDP per capita shows the strongest influenceb. Including the emulation proxy wipes out the other economic
variables, though we carry a few insignificant variables in subsequent rounds of testing as a robustness check.
2. Expanded Modelsa. Crisis experience proves significantb. Government ownership does not/privatization programs doc. Most variables representing political power-sharing and
social capital prove significant, but ICRG measures of corruption and “law and order” do not.
d. Effect of emulation is stronger and effect of per capita GDP is weaker when we exclude countries with small populations or introduce continent dummies. (This supports the hypothesis that per-capita income proxies for cultural factors as well as economic development.)

16
Evidential Value of Our Results Is Confirmed By Their Robustness
• Robustness tests employ three kinds of statistical models and alternative indices of political and cultural influences.
• Qualitative conclusions about the separate effects of external pressure, emulation, and other types of determinants prove robust.
17
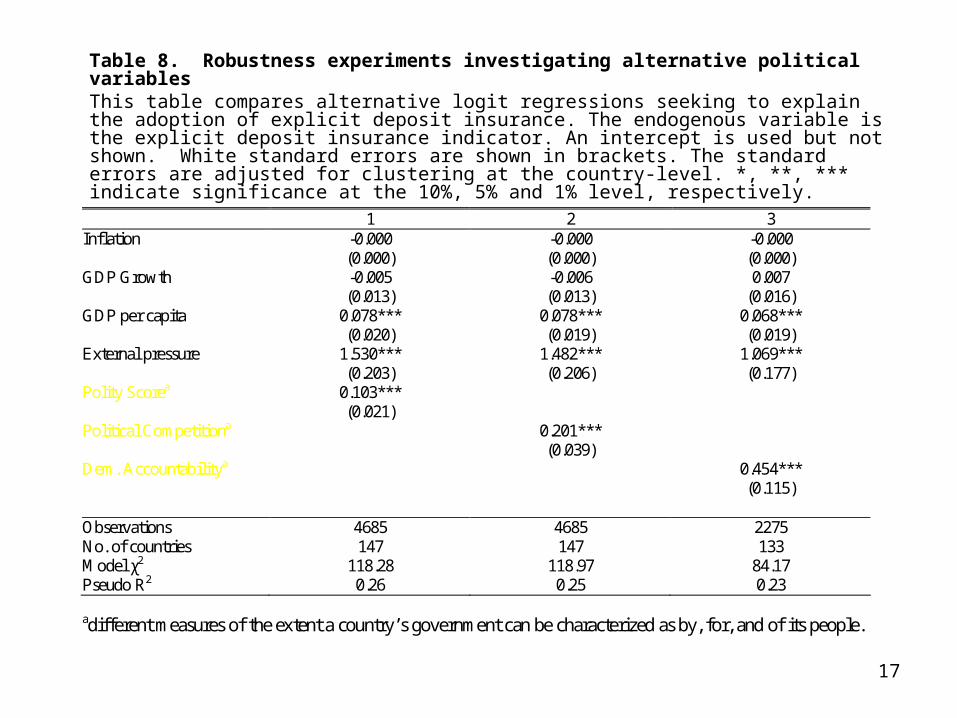
Table 8. Robustness experiments investigating alternative political variablesThis table compares alternative logit regressions seeking to explain the adoption of explicit deposit insurance. The endogenous variable is the explicit deposit insurance indicator. An intercept is used but not shown. White standard errors are shown in brackets. The standard errors are adjusted for clustering at the country-level. *, **, *** indicate significance at the 10%, 5% and 1% level, respectively.
1 2 3 Inflation -0.000 -0.000 -0.000 (0.000) (0.000) (0.000) GDP Growth -0.005 -0.006 0.007 (0.013) (0.013) (0.016) GDP per capita 0.078*** 0.078*** 0.068*** (0.020) (0.019) (0.019) External pressure 1.530*** 1.482*** 1.069*** (0.203) (0.206) (0.177) Polity Scorea 0.103*** (0.021) Political Competitiona 0.201*** (0.039) Dem. Accountabilitya 0.454*** (0.115) Observations 4685 4685 2275 No. of countries 147 147 133 Model χ2 118.28 118.97 84.17 Pseudo R2 0.26 0.25 0.23 adifferent measures of the extent a country’s government can be characterized as by, for, and of its people.
18
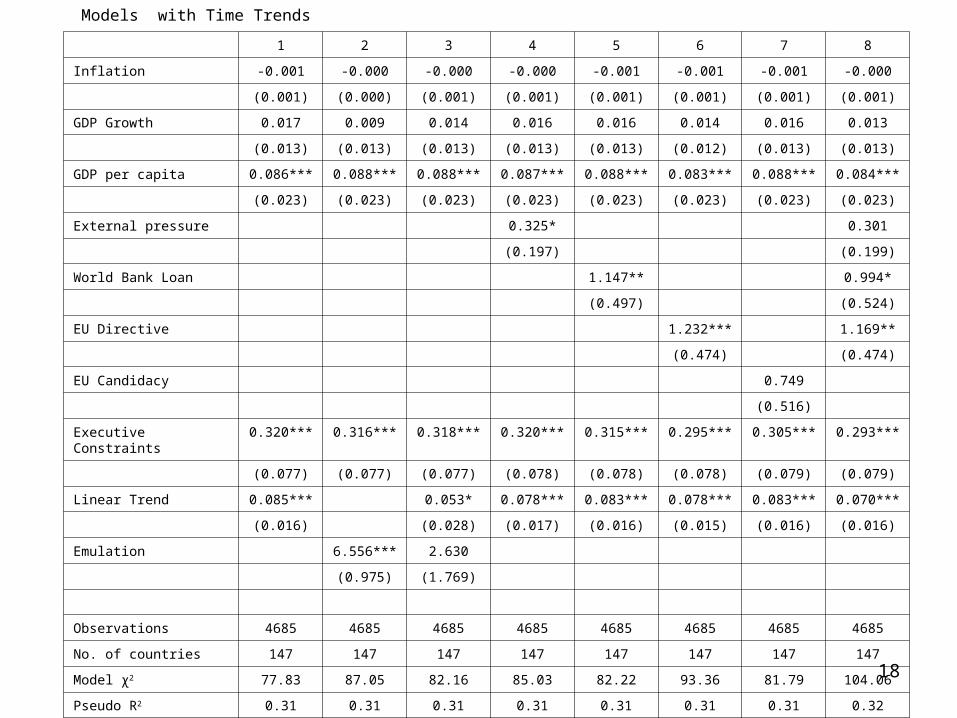
1 2 3 4 5 6 7 8
Inflation -0.001 -0.000 -0.000 -0.000 -0.001 -0.001 -0.001 -0.000
(0.001) (0.000) (0.001) (0.001) (0.001) (0.001) (0.001) (0.001)
GDP Growth 0.017 0.009 0.014 0.016 0.016 0.014 0.016 0.013
(0.013) (0.013) (0.013) (0.013) (0.013) (0.012) (0.013) (0.013)
GDP per capita 0.086*** 0.088*** 0.088*** 0.087*** 0.088*** 0.083*** 0.088*** 0.084***
(0.023) (0.023) (0.023) (0.023) (0.023) (0.023) (0.023) (0.023)
External pressure 0.325* 0.301
(0.197) (0.199)
World Bank Loan 1.147** 0.994*
(0.497) (0.524)
EU Directive 1.232*** 1.169**
(0.474) (0.474)
EU Candidacy 0.749
(0.516)
Executive Constraints 0.320*** 0.316*** 0.318*** 0.320*** 0.315*** 0.295*** 0.305*** 0.293***
(0.077) (0.077) (0.077) (0.078) (0.078) (0.078) (0.079) (0.079)
Linear Trend 0.085*** 0.053* 0.078*** 0.083*** 0.078*** 0.083*** 0.070***
(0.016) (0.028) (0.017) (0.016) (0.015) (0.016) (0.016)
Emulation 6.556*** 2.630
(0.975) (1.769)
Observations 4685 4685 4685 4685 4685 4685 4685 4685
No. of countries 147 147 147 147 147 147 147 147
Model χ2 77.83 87.05 82.16 85.03 82.22 93.36 81.79 104.06
Pseudo R2 0.31 0.31 0.31 0.31 0.31 0.31 0.31 0.32
Models with Time Trends
19
Alternative Focus: No. of Years Spent in Non-EDIS State
Hazard models surmount the problem of right-censored data by focusing instead on the transitional probability of staying in state N for a spell of exactly t years, where results for t>43 can be extrapolated from the transitions observed. The hazard rate λ(t) may be interpreted as the probability of country’s leaving state N in year t, given that it was in state N when the year began. The logit models estimated in the previous section imply that this probability λ is a function of country characteristics as well as time.
The Weibull model specifies that λ(t) in (1) evolves as:λ(t) = λαtα-1. (2)
The evolutionary parameter α determines whether the hazard rate is increasing (α > 1), decreasing (α < 1), or constant (α = 1) over time. High and significant values of α (which emerge in all of our Weibull specifications) denote positive duration dependence and can be interpreted as evidence of external influence or emulation.

20
Evidence from Weibull Hazard Models
1. As represented by the evolutionary parameter, emulation is even more significant than per capita GDP.
2. “Crisis experience” and “political power-sharing” proxy are also significant
21
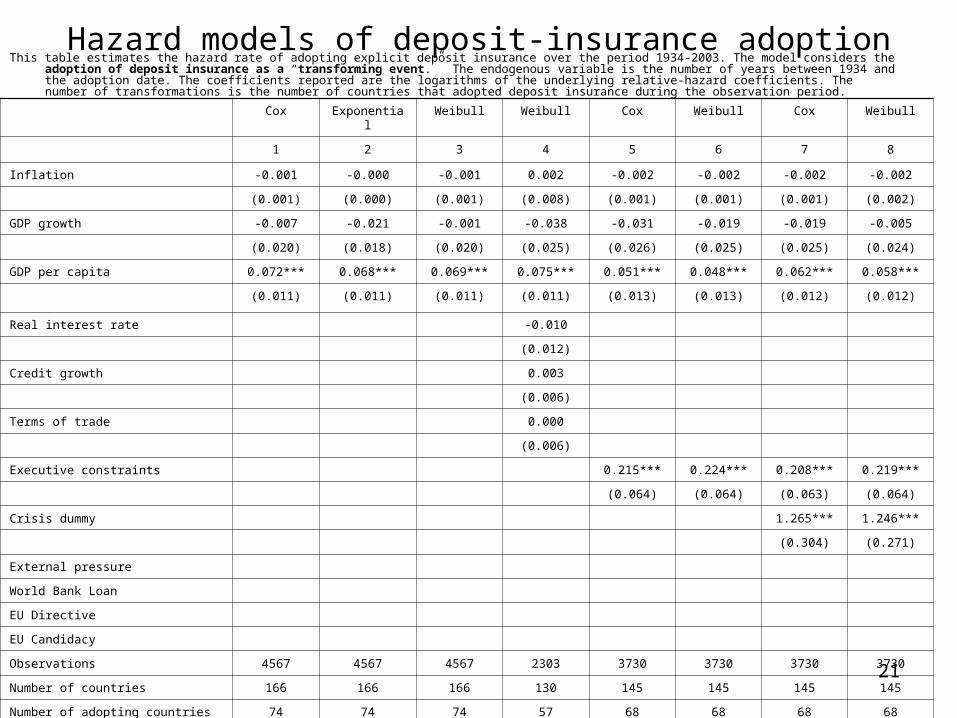
Hazard models of deposit-insurance adoptionThis table estimates the hazard rate of adopting explicit deposit insurance over the period 1934-2003. The model considers the adoption of deposit insurance as a
“transforming event.” The endogenous variable is the number of years between 1934 and the adoption date. The coefficients reported are the logarithms of the underlying relative-hazard coefficients. The number of transformations is the number of countries that adopted deposit insurance during the observation period.
Cox Exponential Weibull Weibull Cox Weibull Cox Weibull
1 2 3 4 5 6 7 8
Inflation -0.001 -0.000 -0.001 0.002 -0.002 -0.002 -0.002 -0.002
(0.001) (0.000) (0.001) (0.008) (0.001) (0.001) (0.001) (0.002)
GDP growth -0.007 -0.021 -0.001 -0.038 -0.031 -0.019 -0.019 -0.005
(0.020) (0.018) (0.020) (0.025) (0.026) (0.025) (0.025) (0.024)
GDP per capita 0.072*** 0.068*** 0.069*** 0.075*** 0.051*** 0.048*** 0.062*** 0.058***
(0.011) (0.011) (0.011) (0.011) (0.013) (0.013) (0.012) (0.012)
Real interest rate -0.010
(0.012)
Credit growth 0.003
(0.006)
Terms of trade 0.000
(0.006)
Executive constraints 0.215*** 0.224*** 0.208*** 0.219***
(0.064) (0.064) (0.063) (0.064)
Crisis dummy 1.265*** 1.246***
(0.304) (0.271)
External pressure
World Bank Loan
EU Directive
EU Candidacy
Observations 4567 4567 4567 2303 3730 3730 3730 3730
Number of countries 166 166 166 130 145 145 145 145
Number of adopting countries 74 74 74 57 68 68 68 68
Evolutionary parameter α (p-value) 4.48 (0.00) 4.26 (0.00) 4.49 (0.00) 4.26 (0.00)
22
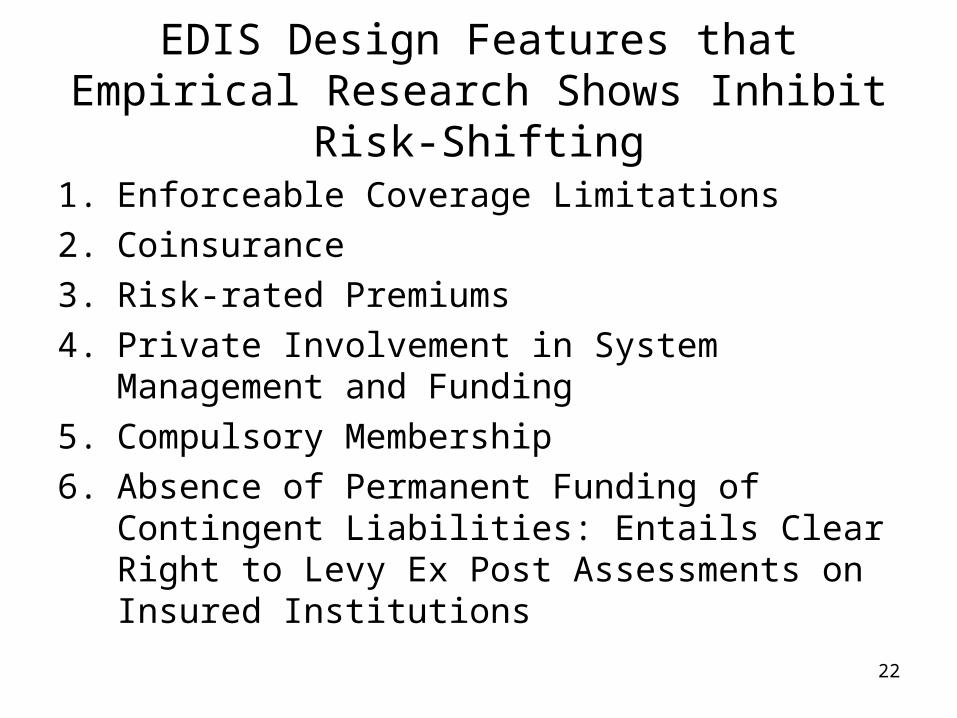
EDIS Design Features that Empirical Research Shows Inhibit Risk-Shifting
1. Enforceable Coverage Limitations
2. Coinsurance
3. Risk-rated Premiums
4. Private Involvement in System Management and Funding
5. Compulsory Membership
6. Absence of Permanent Funding of Contingent Liabilities: Entails Clear Right to Levy Ex Post Assessments on Insured Institutions
23
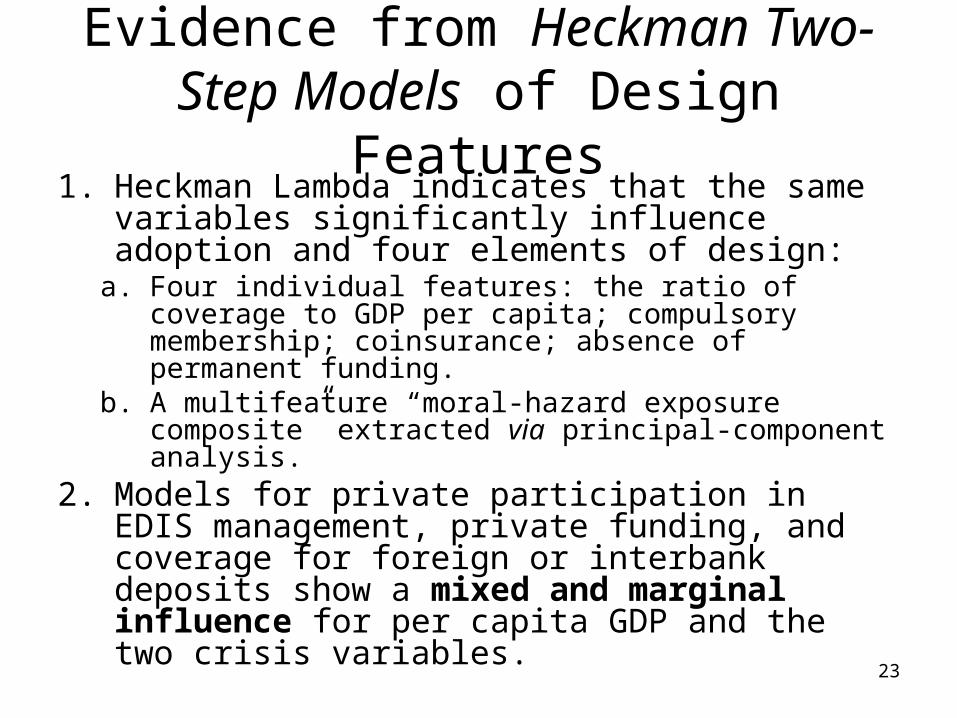
Evidence from Heckman Two-Step Models of Design Features
1. Heckman Lambda indicates that the same variables significantly influence adoption and four elements of design:
a. Four individual features: the ratio of coverage to GDP per capita; compulsory membership; coinsurance; absence of permanent funding.
b. A multifeature “moral-hazard exposure composite” extracted via principal-component analysis.
2. Models for private participation in EDIS management, private funding, and coverage for foreign or interbank deposits show a mixed and marginal influence for per capita GDP and the two crisis variables.
24
GDP per capita, emulation, and the crisis dummy show a positive (i.e., perverse) and significant influence on design. Post-crisis adoption is positive (i.e., also perverse) for the four cases features for which its influence is significant.
25
Panel A:
Moral- hazard
composite
Coverage ratio
Membership
Coinsurance
Permanent fund
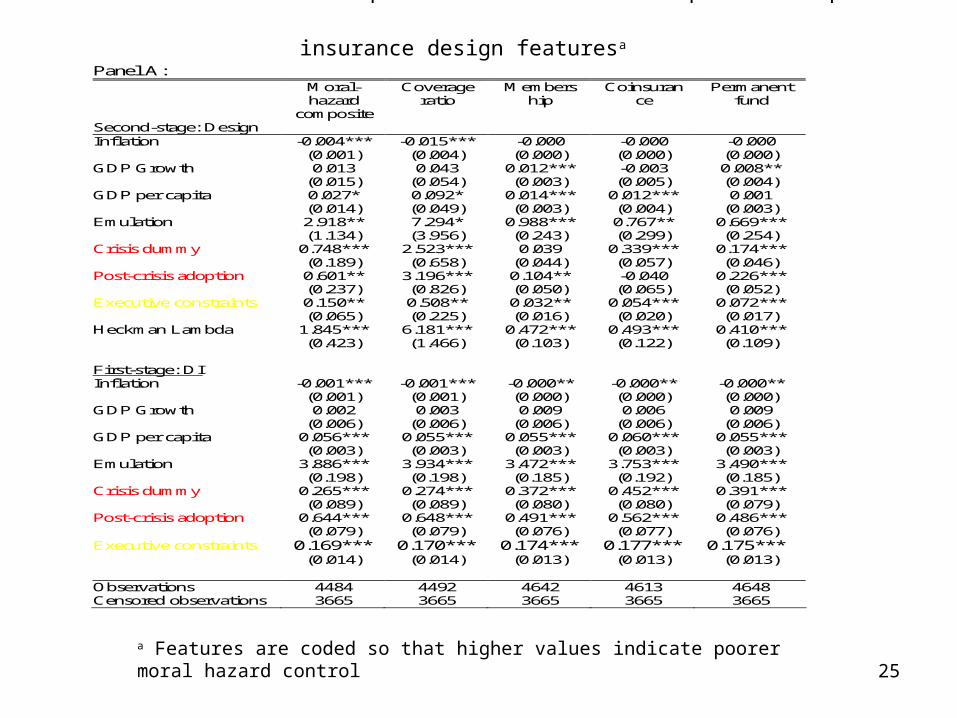
Second-stage: Design Inflation -0.004*** -0.015*** -0.000 -0.000 -0.000 (0.001) (0.004) (0.000) (0.000) (0.000) GDP Growth 0.013 0.043 0.012*** -0.003 0.008** (0.015) (0.054) (0.003) (0.005) (0.004) GDP per capita 0.027* 0.092* 0.014*** 0.012*** 0.001 (0.014) (0.049) (0.003) (0.004) (0.003) Emulation 2.918** 7.294* 0.988*** 0.767** 0.669*** (1.134) (3.956) (0.243) (0.299) (0.254) Crisis dummy 0.748*** 2.523*** 0.039 0.339*** 0.174*** (0.189) (0.658) (0.044) (0.057) (0.046) Post-crisis adoption 0.601** 3.196*** 0.104** -0.040 0.226*** (0.237) (0.826) (0.050) (0.065) (0.052) Executive constraints 0.150** 0.508** 0.032** 0.054*** 0.072*** (0.065) (0.225) (0.016) (0.020) (0.017) Heckman Lambda 1.845*** 6.181*** 0.472*** 0.493*** 0.410*** (0.423) (1.466) (0.103) (0.122) (0.109)
First-stage: DI Inflation -0.001*** -0.001*** -0.000** -0.000** -0.000** (0.001) (0.001) (0.000) (0.000) (0.000) GDP Growth 0.002 0.003 0.009 0.006 0.009 (0.006) (0.006) (0.006) (0.006) (0.006) GDP per capita 0.056*** 0.055*** 0.055*** 0.060*** 0.055*** (0.003) (0.003) (0.003) (0.003) (0.003) Emulation 3.886*** 3.934*** 3.472*** 3.753*** 3.490*** (0.198) (0.198) (0.185) (0.192) (0.185) Crisis dummy 0.265*** 0.274*** 0.372*** 0.452*** 0.391*** (0.089) (0.089) (0.080) (0.080) (0.079) Post-crisis adoption 0.644*** 0.648*** 0.491*** 0.562*** 0.486*** (0.079) (0.079) (0.076) (0.077) (0.076) Executive constraints 0.169*** 0.170*** 0.174*** 0.177*** 0.175*** (0.014) (0.014) (0.013) (0.013) (0.013) Observations 4484 4492 4642 4613 4648 Censored observations 3665 3665 3665 3665 3665
Table 10: Heckman two-step selection model for adoption of deposit-insurance design featuresa
a Features are coded so that higher values indicate poorer moral hazard control
26
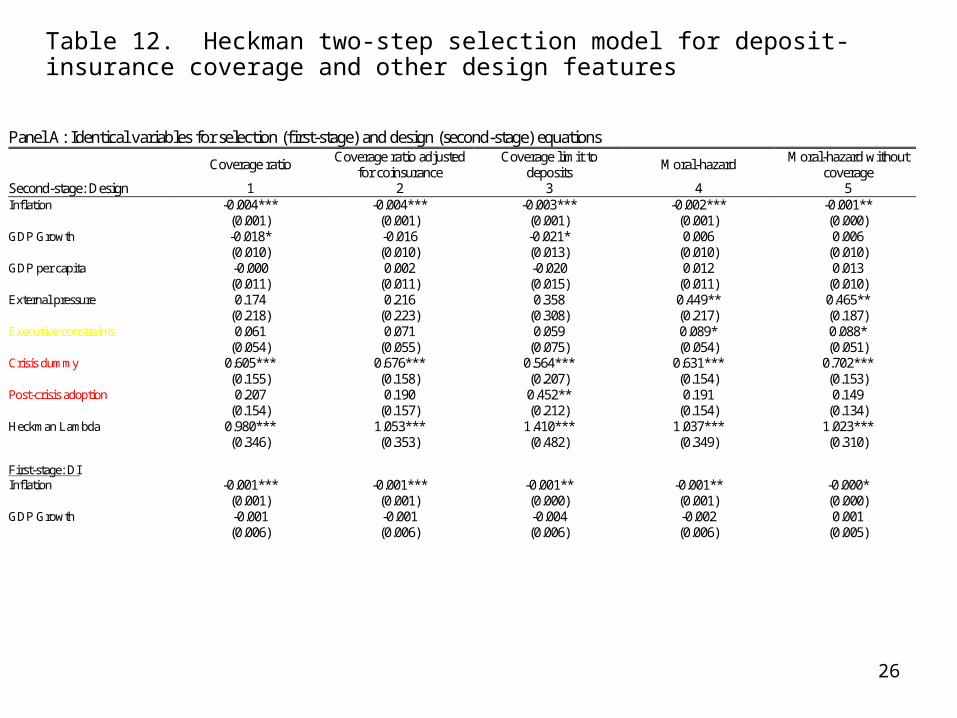
Table 12. Heckman two-step selection model for deposit-insurance coverage and other design features
Panel A: Identical variables for selection (first-stage) and design (second-stage) equations
Coverage ratio Coverage ratio adjusted
for coinsurance Coverage limit to
deposits Moral-hazard
Moral-hazard without coverage
Second-stage: Design 1 2 3 4 5 Inflation -0.004*** -0.004*** -0.003*** -0.002*** -0.001** (0.001) (0.001) (0.001) (0.001) (0.000) GDP Growth -0.018* -0.016 -0.021* 0.006 0.006 (0.010) (0.010) (0.013) (0.010) (0.010) GDP per capita -0.000 0.002 -0.020 0.012 0.013 (0.011) (0.011) (0.015) (0.011) (0.010) External pressure 0.174 0.216 0.358 0.449** 0.465** (0.218) (0.223) (0.308) (0.217) (0.187) Executive constraints 0.061 0.071 0.059 0.089* 0.088* (0.054) (0.055) (0.075) (0.054) (0.051) Crisis dummy 0.605*** 0.676*** 0.564*** 0.631*** 0.702*** (0.155) (0.158) (0.207) (0.154) (0.153) Post-crisis adoption 0.207 0.190 0.452** 0.191 0.149 (0.154) (0.157) (0.212) (0.154) (0.134) Heckman Lambda 0.980*** 1.053*** 1.410*** 1.037*** 1.023*** (0.346) (0.353) (0.482) (0.349) (0.310)
First-stage: DI Inflation -0.001*** -0.001*** -0.001** -0.001** -0.000* (0.001) (0.001) (0.000) (0.001) (0.000) GDP Growth -0.001 -0.001 -0.004 -0.002 0.001 (0.006) (0.006) (0.006) (0.006) (0.005)

27
GDP per capita 0.050*** 0.050*** 0.048*** 0.051*** 0.054*** (0.003) (0.003) (0.003) (0.003) (0.003) External pressure 0.949*** 0.949*** 0.943*** 0.932*** 0.931*** (0.069) (0.069) (0.070) (0.070) (0.068)
Executive constraints 0.178*** 0.178*** 0.181*** 0.177*** 0.183***
(0.013) (0.013) (0.013) (0.013) (0.013) Crisis dummy 0.488*** 0.488*** 0.472*** 0.476*** 0.618*** (0.087) (0.087) (0.089) (0.088) (0.080) Post-crisis adoption 0.510*** 0.510*** 0.515*** 0.507*** 0.441*** (0.073) (0.073) (0.074) (0.073) (0.072)
Observations 4492 4492 4435 4484 4600 Censored observations 3665 3665 3665 3665 3665 Panel B: Exclude GDP per capita in design equation (second-stage) No year effects With year effects Heckman two-step estimator Heckman ML estimator Heckman two-step estimator Heckman ML estimator Coverage ratio Moral hazard Coverage ratio Moral hazard Coverage ratio Moral hazard Coverage ratio Moral hazard Second-stage: Design 1 2 3 4 5 6 7 8 Inflation -0.004*** -0.002*** -0.003*** -0.002** -0.004*** -0.002** -0.003*** -0.002** (0.001) (0.001) (0.001) (0.001) (0.001) (0.001) (0.001) (0.001) GDP Growth -0.018* 0.007 -0.015 0.008 -0.023** 0.004 -0.022** 0.003 (0.010) (0.010) (0.010) (0.010) (0.010) (0.010) (0.010) (0.010) External pressure 0.181* 0.243*** 0.007 0.177** -0.003 -0.300 -0.255 -0.362 (0.094) (0.083) (0.076) (0.076) (0.491) (0.509) (0.517) (0.515) Executive constraints 0.063** 0.038 -0.006 0.009 0.049* 0.011 -0.008 -0.005 (0.028) (0.027) (0.023) (0.023) (0.028) (0.026) (0.022) (0.024) Crisis dummy 0.609*** 0.524*** 0.524*** 0.497*** 0.607*** 0.540*** 0.536*** 0.528*** (0.113) (0.103) (0.106) (0.101) (0.111) (0.100) (0.105) (0.099) Post-crisis adoption 0.212** 0.050 0.177** 0.053 0.260*** 0.095 0.241*** 0.106 (0.088) (0.079) (0.083) (0.078) (0.086) (0.076) (0.081) (0.076) Heckman Lambda 0.994*** 0.669*** 0.681*** 0.541*** 0.951*** 0.573*** 0.691*** 0.503*** (0.103) (0.093) (0.062) (0.073) (0.102) (0.091) (0.061) (0.076)
First-stage: DI Inflation -0.001*** -0.001** -0.001** -0.001** -0.001*** -0.001** -0.001** -0.001** (0.001) (0.001) (0.000) (0.000) (0.001) (0.001) (0.000) (0.000) GDP Growth -0.001 -0.002 0.000 -0.001 -0.001 -0.002 0.000 -0.001

28
GDP per capita 0.050*** 0.051*** 0.052*** 0.053*** 0.050*** 0.051*** 0.052*** 0.052*** (0.003) (0.003) (0.003) (0.003) (0.003) (0.003) (0.003) (0.003) External pressure 0.949*** 0.932*** 0.960*** 0.925*** 0.949*** 0.932*** 0.962*** 0.926*** (0.069) (0.070) (0.069) (0.069) (0.069) (0.070) (0.069) (0.069) Executive constraints 0.178*** 0.177*** 0.170*** 0.172*** 0.178*** 0.177*** 0.171*** 0.174*** (0.013) (0.013) (0.013) (0.013) (0.013) (0.013) (0.013) (0.013) Crisis dummy 0.488*** 0.476*** 0.501*** 0.470*** 0.488*** 0.476*** 0.499*** 0.468*** (0.087) (0.088) (0.086) (0.087) (0.087) (0.088) (0.086) (0.087) Post-crisis adoption 0.510*** 0.507*** 0.526*** 0.488*** 0.510*** 0.507*** 0.519*** 0.484*** (0.073) (0.073) (0.072) (0.073) (0.073) (0.073) (0.072) (0.073)
Observations 4492 4484 4492 4484 4492 4484 4492 4484 Censored observations 3665 3665 3665 3665 3665 3665 3665 3665 Joint significance of year effects (p-value)
0.00 0.00 0.00 0.00
29
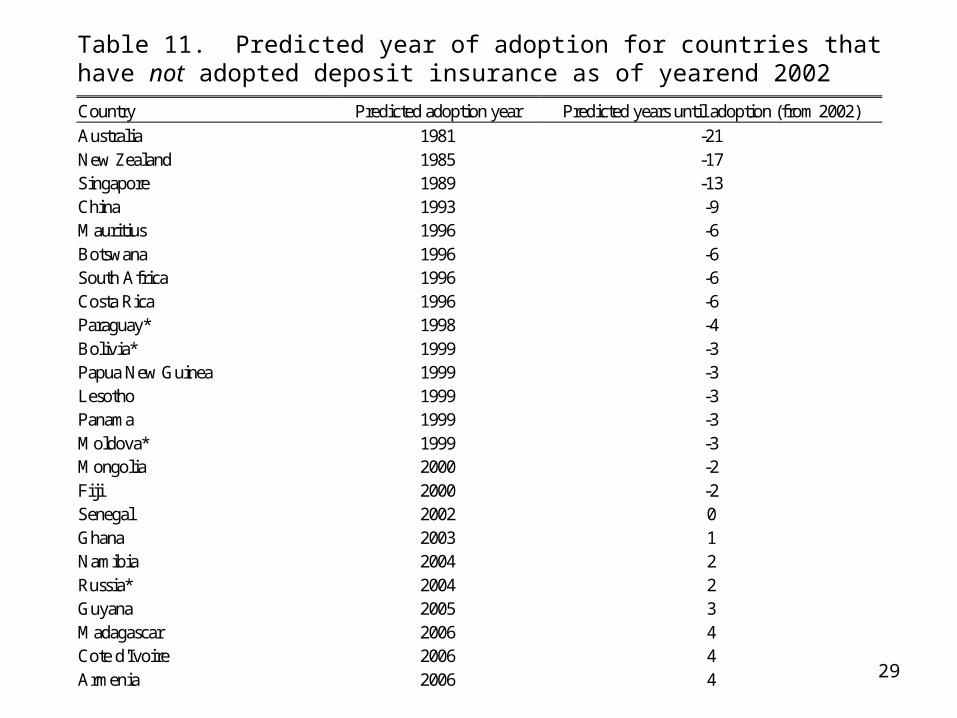
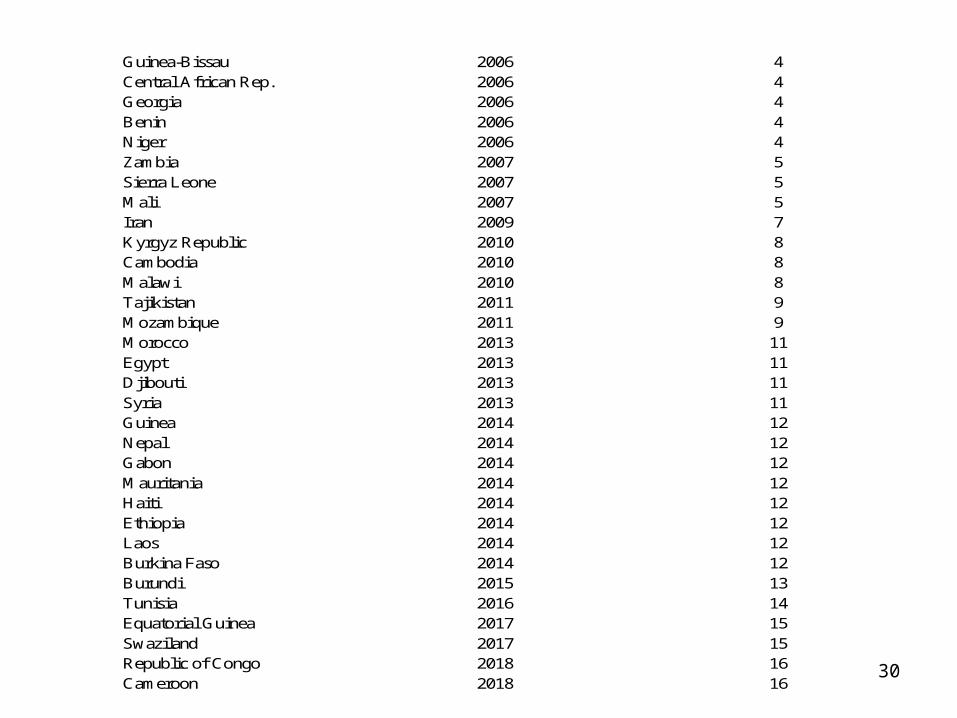
Table 11. Predicted year of adoption for countries that have not adopted deposit insurance as of yearend 2002
Country Predicted adoption year Predicted years until adoption (from 2002)
Australia 1981 -21 New Zealand 1985 -17 Singapore 1989 -13 China 1993 -9 Mauritius 1996 -6 Botswana 1996 -6 South Africa 1996 -6 Costa Rica 1996 -6 Paraguay* 1998 -4 Bolivia* 1999 -3 Papua New Guinea 1999 -3 Lesotho 1999 -3 Panama 1999 -3 Moldova* 1999 -3 Mongolia 2000 -2 Fiji 2000 -2 Senegal 2002 0 Ghana 2003 1 Namibia 2004 2 Russia* 2004 2 Guyana 2005 3 Madagascar 2006 4 Cote d'Ivoire 2006 4 Armenia 2006 4
30
Guinea-Bissau 2006 4 Central African Rep. 2006 4 Georgia 2006 4 Benin 2006 4 Niger 2006 4 Zambia 2007 5 Sierra Leone 2007 5 Mali 2007 5 Iran 2009 7 Kyrgyz Republic 2010 8 Cambodia 2010 8 Malawi 2010 8 Tajikistan 2011 9 Mozambique 2011 9 Morocco 2013 11 Egypt 2013 11 Djibouti 2013 11 Syria 2013 11 Guinea 2014 12 Nepal 2014 12 Gabon 2014 12 Mauritania 2014 12 Haiti 2014 12 Ethiopia 2014 12 Laos 2014 12 Burkina Faso 2014 12 Burundi 2015 13 Tunisia 2016 14 Equatorial Guinea 2017 15 Swaziland 2017 15 Republic of Congo 2018 16 Cameroon 2018 16

31
Togo 2018 16 Pakistan 2018 16 Gambia 2018 16 Angola 2018 16 Bhutan 2018 16 Azerbaijan 2019 17 Rwanda 2019 17 Yemen 2019 17 Eritrea 2019 17 Chad 2019 17 Liberia 2020 18 Zimbabwe* 2021 19 Sudan 2023 21 Uzbekistan 2024 22
Notes:
a. Albania and Uruguay have established deposit insurance systems in 2002.
b. Malta, Paraguay, Russia, and Zimbabwe have adopted deposit insurance in 2003.
c. Moldova has adopted deposit insurance in 2004.
d. While Bolivia does not have a formal deposit insurance system, it has a Financial Restructuring Fund set up in December 2001 that acts as deposit insurance.
e. A proposal for explicit deposit insurance was drafted in 1999 by these 6 Francophone African countries but the proposal has only been ratified by 2 out of the 6 Communauté Économique et Monétaire de l'Afrique Centrale (CEMAC) countries: Cameroon, Central African Republic, Chad, Equatorial Guinea, Gabon, and Republic of Congo.
f. To our knowledge, several countries have considered (or are considering) the adoption of deposit insurance: Australia, New Zealand, Singapore, China, South Africa, Namibia, and Pakistan.
32
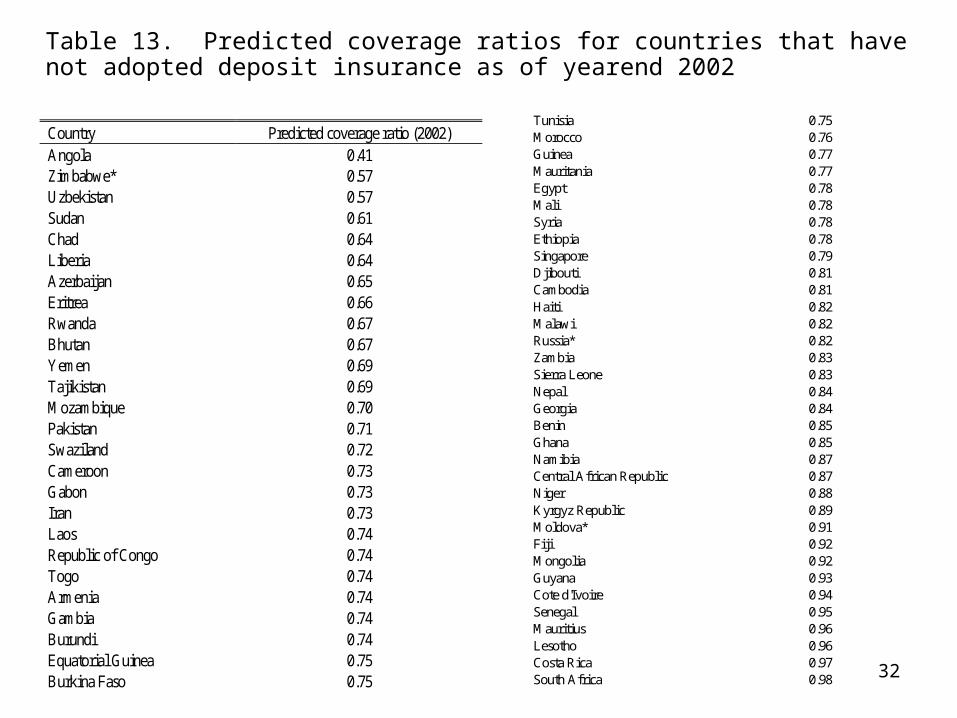
Table 13. Predicted coverage ratios for countries that have not adopted deposit insurance as of yearend 2002
Country Predicted coverage ratio (2002) Angola 0.41 Zimbabwe* 0.57 Uzbekistan 0.57 Sudan 0.61 Chad 0.64 Liberia 0.64 Azerbaijan 0.65 Eritrea 0.66 Rwanda 0.67 Bhutan 0.67 Yemen 0.69 Tajikistan 0.69 Mozambique 0.70 Pakistan 0.71 Swaziland 0.72 Cameroon 0.73 Gabon 0.73 Iran 0.73 Laos 0.74 Republic of Congo 0.74 Togo 0.74 Armenia 0.74 Gambia 0.74 Burundi 0.74 Equatorial Guinea 0.75 Burkina Faso 0.75
Tunisia 0.75 Morocco 0.76 Guinea 0.77 Mauritania 0.77 Egypt 0.78 Mali 0.78 Syria 0.78 Ethiopia 0.78 Singapore 0.79 Djibouti 0.81 Cambodia 0.81 Haiti 0.82 Malawi 0.82 Russia* 0.82 Zambia 0.83 Sierra Leone 0.83 Nepal 0.84 Georgia 0.84 Benin 0.85 Ghana 0.85 Namibia 0.87 Central African Republic 0.87 Niger 0.88 Kyrgyz Republic 0.89 Moldova* 0.91 Fiji 0.92 Mongolia 0.92 Guyana 0.93 Cote d'Ivoire 0.94 Senegal 0.95 Mauritius 0.96 Lesotho 0.96 Costa Rica 0.97 South Africa 0.98

33
Australia 0.98 Botswana 0.98 Panama 0.98 New Zealand 0.99 Guinea-Bissau 0.99 Bolivia* 1.01 Papua New Guinea 1.06 Paraguay* 1.06 Madagascar 1.10 China 1.33
Notes:
a. Albania and Uruguay have established deposit insurance systems in 2002.
b. Malta, Paraguay, Russia, and Zimbabwe have adopted deposit insurance in 2003.
c. Moldova has adopted deposit insurance in 2004.
d. While Bolivia does not have a formal deposit insurance system, it has a Financial Restructuring Fund set up in December 2001 that acts as deposit insurance.
e. A proposal for explicit deposit insurance was drafted in 1999 by these 6 Francophone African countries but the proposal has only been ratified by 2 out of the 6 Communauté Économique et Monétaire de l'Afrique Centrale (CEMAC) countries: Cameroon, Central African Republic, Chad, Equatorial Guinea, Gabon, and Republic of Congo.