
1. DESIGN OF SOLAR LANTERN FOR FARMERS IN … · increasing the efficiency of heat exchanger...
163
1. DESIGN OF SOLAR LANTERN FOR FARMERS IN RURAL INDIA COLLEGE: M S RAMAIAH SCHOOL OF ADVANCE STUDIES, BANGALORE. GUIDE: SHARATH S SHIRSI COLLEGE STUDENTS: VIGNESH SCHOOL STUDENTS: SREENIVAS 9 TH std , GIRISH 9 TH std, GHPS HEBBALA INTRODUCTION The project selected is “Design of Low cost Solar Lantern for Farmers in Rural India”. In India, power cuts in villagers are to an average of 5 hours per day. This power cut happens either in the evening hours or in the night. Farmers and other village occupants are not wealthy enough to purchase generators or inverters, so Indian government introduced solar powered products to them. India is located in the equatorial plane where solar energy is available throughout the year. The Solar panel generates energy from sun which can be stored in battery or any other energy stored device. Solar products like solar water heaters, fan, street light etc. have already been introduced to them by local firms as well as by socialistic groups. Some of the organizations like ‘d.light’ have set up a community to acknowledge the villagers with the benefits of solar products. Project is aimed at conducting research about different types of Solar Lanterns and other solar products available in the Indian Market. Project will mainly focus on studies related to the present Solar Lanterns available in the market; and the environment and the condition in which these Lanterns support the customers. The outcome of the project will develop a new Solar Lantern which is less costly than all the other brands of solar lanterns in the market are to satisfy the requirements of the farmers in rural India. Quality Function Deployment (QFD) was done considering the customer and technical voice obtained as a result of the research. Detailed Product Design Specification (PDS) was created. Mind mapping was used to create ideas. Five concepts were generated using the PDS. Using the weight ranking method, a concept was selected which had most of the qualities which the QFD demands. A concept was generated and mock up model was made. From the guidelines received, changes were made in the selected concept and a prototype of 1:1 scale made and validated. This project was very much helpful in understanding the processes involved in designing a lantern in an industrial background.
Transcript of 1. DESIGN OF SOLAR LANTERN FOR FARMERS IN … · increasing the efficiency of heat exchanger...

1. DESIGN OF SOLAR LANTERN FOR FARMERS IN RURAL INDIA
COLLEGE: M S RAMAIAH SCHOOL OF ADVANCE STUDIES, BANGALORE.
GUIDE: SHARATH S SHIRSI
COLLEGE STUDENTS: VIGNESH
SCHOOL STUDENTS: SREENIVAS 9TH std , GIRISH 9TH std, GHPS HEBBALA
INTRODUCTION
The project selected is “Design of Low cost Solar Lantern for Farmers in Rural India”. In India, power cuts in villagers are to an average of 5 hours per day. This power cut happens either in the evening hours or in the night. Farmers and other village occupants are not wealthy enough to purchase generators or inverters, so Indian government introduced solar powered products to them. India is located in the equatorial plane where solar energy is available throughout the year. The Solar panel generates energy from sun which can be stored in battery or any other energy stored device. Solar products like solar water heaters, fan, street light etc. have already been introduced to them by local firms as well as by socialistic groups. Some of the organizations like ‘d.light’ have set up a community to acknowledge the villagers with the benefits of solar products.
Project is aimed at conducting research about different types of Solar Lanterns and other solar products available in the Indian Market. Project will mainly focus on studies related to the present Solar Lanterns available in the market; and the environment and the condition in which these Lanterns support the customers. The outcome of the project will develop a new Solar Lantern which is less costly than all the other brands of solar lanterns in the market are to satisfy the requirements of the farmers in rural India. Quality Function Deployment (QFD) was done considering the customer and technical voice obtained as a result of the research. Detailed Product Design Specification (PDS) was created. Mind mapping was used to create ideas. Five concepts were generated using the PDS. Using the weight ranking method, a concept was selected which had most of the qualities which the QFD demands.
A concept was generated and mock up model was made. From the guidelines received, changes were made in the selected concept and a prototype of 1:1 scale made and validated. This project was very much helpful in understanding the processes involved in designing a lantern in an industrial background.

2. DESIGNING AND DEVELOMENT OF FOULING FREE HEAT PIPES
COLLEGE: H M S INSTITUTE OF TECHNOLOGY, KYATHASANDRA, TUMKUR.
GUIDE: DR. VIJAYA VITTALA C B
COLLEGE STUDENTS: HARSHA KUMAR J, BHARATH B K, DHANANJAYA N, GOWTHAM D
SCHOOL STUDENTS: R INDU SHEKAR 9TH std KENDRIYA VIDYALAYA, TUMKUR; GUNASHREE S GOWDA 8TH std ARIN INTERNATIONAL SCHOOL, TUMKUR.
DESIGN AND DEVELOPMENT OF FOULING FREE HEAT PIPES Heats pipes are particularly useful in energy conversion equipment where it is desired to recover heat from hot gases for preheat of air in steam power plant or it is used for supplementary heating applications. Ex; Gas/Electric geyser, various boilers like Benson/Van Monti boiler, etc.. But the major problem which is decreasing the efficiency is Fouling. This fouling is measured or its magnitude is taken as fouling factor. The fouling of any heat pipe is more, its efficiency is less, and therefore our project is endeavourer to solve the problem of fouling, by observing the principle of “lotus leaf”. That is any droplet which falls on the lotus leaf is nearly spherical in shape, therefore we are trying to adopt the hidden principle of surface chemistry and surface physics in heat exchanger to eliminate fouling. So as to help in increasing the efficiency of heat exchanger devices there by help in reserving the fuel, which indirectly help in conserving the green? Heats pipes are particularly useful in energy conversion equipment where it is desired to recover heat from hot gases for preheat of air in steam power plant or it is used for supplementary heating applications. Ex; Gas/Electric geyser, various boilers like Benson/Van Monte boiler, etc... But the major problem which is decreasing the efficiency is Fouling. This fouling is measured or its magnitude is taken as fouling factor. The fouling of any heat pipe is more, its efficiency is less, and therefore our project is Endeavour to solve the problem of fouling, by observing the principle of “lotus leaf”. That is any droplet which falls on the lotus leaf is nearly spherical in shape, therefore we are trying to adopt the hidden principle of surface chemistry and surface physics in heat exchanger to eliminate fouling. So as to help in increasing the efficiency of heat exchanger devices there by help in reserving the fuel, which indirectly help in conserving the green? Research and work cited: Common fouling mechanisms are:
Particulate fouling results from sedimentation of dust, rust, fine sand or other entrained
solids. These types fouling can be avoided majorly by filtration technique.
Precipitation fouling is a solids deposition at the heat transfer surface from a
supersaturated fluid. A common example is salt crystallization from an aqueous solution.
Precipitation can also occur via sublimation, e.g., ammonium chloride in overhead and
effluent vapours. In this case our concept will help a lot.

Chemical reaction fouling is the breakdown and bonding of unstable compounds at the heat
transfer surface. Oil sludge and polymerization are examples of chemical reaction fouling.
Coking is a subset of chemical reaction fouling. It is one of the most problematic types of
fouling. In the extreme, the coke deposit is a very hard layer of carbon, salts and other
compounds.
Corrosion fouling is the accumulation of corrosion products, such as iron oxide, on the heat
transfer surface.
Biological fouling is the growth of living organisms, like algae and mussels, on the heat
transfer surface. Fouling in service is often a combination of two or more mechanisms. Also,
one mechanism may be an initiator for another mechanism. Fluids may be categorized into
three groups according to their potential for fouling
Non fouling fluids do not require regular cleaning. Some examples are non-polymerizing
light hydrocarbons, steam and sub cooled boiler feed water.
Asymptotic fouling fluids reach a maximum constant fouling resistance after a short run
time. The fluid velocity imparts a shear stress at the fouling layer that removes some of the
deposit. As the fouling layer thickens, flow area is reduced and velocity increases, thereby
increasing the removal rate. When the removal rate equals the deposition rate, fouling
reaches an asymptotic limit. Thickness of the final asymptotic fouling layer is inversely
proportional to the original velocity. Cooling tower water is an example of an asymptotic
fouling fluid.
Linear fouling fluids have a fouling layer that is too tenacious to prevent with economic
design velocities. The fouling layer continues to build as a roughly linear function of time.
The fouling rate depends on velocity
By understanding different types of fouling we have come up with the following solution; illustrated in below figure:
The work of coating metal layer and Teflon will be carried on the external surface.

Fouling is defined as the deposition and accumulation of unwanted materials such as scale, algae suspended solids and insoluble salts on the internal or external surface of processing equipment’s including boilers and heat exchanger.
Heat exchanger and boilers fouling remains today one of the major unresolved problems in thermal science and prevention or mitigation of fouling problems is still ongoing processes. The aim of the project is to decrease the rate of fouling factor in boiler, heat exchanger or heat pipes. This can achieve by creating non-uniform surface in different pattern over the boiler surface which sets up a vibration using surface energy which avoids the fouling. The experiment will be conducted on two brass/copper tube or brass/copper vessel. Brass/copper tube or vessel will be coated alternately with high/less by any surface material like Teflon/metal. By using water as a fluid the boiling process will be initiated on both, plain as well as altered surface. Experiment is conducted for different range of time like 5hr, 10hr, 20hr, 25hr, and 30hr.... on both plain as well as altered surface under controlled environment of heat flux and heat rate. Observation will be carried out on the surfaces to found the fouling factor. Photographs will be taken at the time interval to monitor the fouling rate. CONCLUSION: As quoted earlier this innovation definitely helps in reducing the fouling, which in turn increases efficiency of a system and help us conserve energy, which implies conservation of green. Expected Outcome of the project: Increasing efficiency of the heat transfer system, by self-cleaning mechanism for fouling free operation Application of the project: Desalination, Steam Generation

3. ELECTRO-ENERGISER
COLLEGE: ACHARYA INSTITUTE OF TECHNOLOGY, BANGALORE
GUIDE: SUNIL KUMAR S
COLLEGE STUDENTS: SHARATH
SCHOOL STUDENTS: BILAL AHMAD ANSARI 9TH std GOVT HS CHIKKABANAVARA, MIRIDI SAICHARAN 9TH std POORNA PRAGNA HIGH SCHOOL.
INTRODUCTION Like food and water electricity is the basic need for this modern civilization. In 2013, world total of electricity production and consumption is 20,279 TWH. The main source for the production of electricity is Non-conventional sources of energy which is consumed more for production of electricity and is non-viable. This causes lack of distribution of electricity uniformly to various regions. The problem caused due to these criteria is lack of accessibility of electricity in rural areas. 18% of world populations do not have access to electricity.
The non-conventional sources of energy is used less for production of electricity.
AIM AND OBJECTIVES
To harness the available non-conventional energy without causing any harm to the environment.
The exhaust gases emitted from automobile will have enough velocity and pressure which can drive a small turbine and generate electricity. This electricity is stored and used for further application
To meet the demand of fast moving generation where the electricity can be used for various portable devices during the motion of automobile.
CONSTRUCTION
The model consists of
Reaction turbine enclosed in a circular compartment which consists of an inlet and outlet pipe these pipes are integrated to the compartment.
The turbine is placed centrally on a shaft. The shaft is connected to a generator or a dynamo outside the compartment.
There is battery which is connected to the dynamo. A slot or a small compartment is made which encloses all the above components .This compartment ends at the outlet pipe of the turbine
The whole assembly is fitted near the exhaust pipe so that the opening of the exhaust pipe and the inlet of turbine compartment is in tight fit. So that the exhaust gases should not escape.
The connection from the battery goes to the various parts of the automobile for usage.

WORKING
The gases from the exhaust pipe enter into compartment of the turbine through the inlet pipe. The inlet is in the shape of a nozzle. As the gas enters there is an increase in velocity of the gas.
These High velocity gases are directed on to the blades of the turbine. Due to reaction force the pressure of the gas is converted to kinetic energy resulting in the rotation of the shaft.
The shaft is connected to a generator which generates electricity. The power transmitted by the shaft is given by the relation N=2*3.14*n*T/60 which is equal to the rpm reading in the meter.
This electricity generated is stored in a rechargeable battery and can be used for various purposes
The voltage in the case of ac generator is related with current
RPM (dynamo) = (C x 60) / (P / 2)
Where C= frequency in cycles per second; p= number of poles (even number)
IMPACT
Small scale
• The stored electricity can be used as a portable charger in two wheel automobile and
also four wheel vehicles while in motion without the consumption of primary battery.
• This battery can be detached from the automobile.

Large scale
• Heavy transport vehicles running for long distances produce emission which can generate ample amount of electricity.
• This electricity can be used for rural areas were electricity is not accessible, in deep mining areas.
CONCLUSION
There are only ways to conserve and use elsewhere which is why we propose this concept. By application of this, we hope and wish to light millions of rural houses which are lying in the darkness. Also integrate functional aspects into vehicle.

4. ENERGY LEECH LAMP
COLLEGE: SIR M VISHVESHWARAIAH INSTITUTE OF TECHNOLOGY, BANGALORE.
GUIDE: BEULA DAVID
COLLEGE STUDENTS: TARUN S NAIR, SURYANARAYAN
SCHOOL STUDENTS: VARUNACHAR 8th Std, DHANUSH C 9th Std, GHS IISc Campus
The Energy Leech lamp is a commercially viable implementation of a lesser known, yet simple voltage booster circuit known as a joule thief. This lamp is designed to run on batteries that have been discarded on account of being ‘dead’ or unable to power conventional electronic devices.
INTRODUCTION TO JOULE THIEF
A joule thief is a minimalist self-oscillating voltage booster that is small, low-cost, and easy-to-build; typically used for driving light loads. It can use nearly all of the energy in a single-cell electric battery, even far below the voltage where other circuits consider the battery fully discharged (or "dead"). Hence the name suggests the notion that the circuit is stealing energy or "joules" from the source.
The circuit uses the self-oscillating properties of the blocking oscillator, to form an unregulated voltage boost converter. As with all power conversion technology, no energy is actually created by the circuit (in accordance with the law of conservation of energy). Instead, the output voltage is increased at the expense of higher current draw on the input. As a result, the amount of power entering the circuit is the same as the amount leaving, minus the losses in the conversion process.
DESCRIPTION OF OPERATION:
Example of a joule thief circuit driving a LED. The coil consists of a standard ferrite toroid core with two windings of 20 turns each using 0.15 mm (0.006 inch) diameter wire (38 swg) (34-35 AWG). The circuit can utilize an input voltage down to about 0.35 V and can run for an extended period on a 1.5 V AA. The battery voltage is usually 1.5 V. The resistor is ~1 kΩ, 1/4 W. The transistor could be a BC547B, 2SC2500, BC337, PN2222, 2N4401 or other NPN. Vceo = 30 V, P = 0.625 W. A white light-emitting diode with Vf = 3.2 V might be used.

WORKING:
The circuit works by rapidly switching the transistor. Initially, current enters the transistor base terminal (through the resistor and secondary winding), causing it to begin conducting collector current through the primary winding.
This induces a voltage in the secondary winding (positive, because of the winding polarity) which turns the transistor on harder. This self-stoking/positive-feedback process almost instantly turns the transistor on as hard as possible (putting it in the saturation region), making the collector-emitter path look like essentially a closed switch (since VCE will be only about 0.1 volts, assuming that the base current is high enough)
With the primary winding effectively across the battery, the current increases at a rate proportional to the supply voltage divided by the inductance. Switch-off of the transistor takes place by different mechanisms dependent upon supply voltage.
The predominant mode of operation relies on the non-linearity of the inductor (this does not apply to air core coils). As the saturation of the core occurs, the resulting magnetic field stops increasing and the current in the secondary winding is lost, depriving the transistor of base drive and the transistor starts to turn off. The magnetic field starts to collapse, turning the transistor hard off.
At low supply voltages (typically 0.75v and below) the transistor requires a larger base current to maintain saturation as the collector current increases. Hence, when it reaches a critical collector current, the base drive available becomes insufficient and turning it hard off.
Once the current in the coils stops increasing for any reason, the transistor goes into the cut-off region. If the load on the circuit is very small the rate of rise and ultimate voltage at the collector is limited only by stray capacitances, and may rise to more than 100 times the supply voltage. For this reason, it is imperative that a load is always connected so that the transistor is not damaged.
The transistor dissipates very little energy, even at high oscillating frequencies, because it spends most of its time in the fully on or fully off state, thus minimizing the switching losses.
The switching frequency in the example circuit opposite is about 50 kHz. The light-emitting diode will blink at this rate, but the persistence of the human eye means that this will not be noticed.
A simple shunt-regulator for loads requiring a constant voltage

When a more constant output voltage is desired, a voltage regulator can be added to the output of the first schematic. In this example of a simple shunt-regulator, a blocking diode ("D_rect") allows the secondary winding to charge a filter capacitor ("C filter") but prevents the transistor from discharging the capacitor. A Zener diode ("Z1") is used to limit the maximum output voltage.
Reasons for using an FET, rather than a BJT in the joule thief circuit:
FET has high input impedance.
FETs are more temperature stable than BJT.
FETs are usually smaller in construction than BJTs.
However, there are some constraints as well:
FET has relatively low gain-bandwidth product compared to conventional transistors.
realization of circuit using FET
LIST OF THE COMPONENTS USED WITH THEIR SPECIFICATIONS:
1. FERRITE CORE T-4520 Al value>500 Outer diameter=45mm Inner diameter=28mm Height=20mm 2. LED 3V WHITE 3x3 cluster 3. DISCHARGED BATTERY -1 4. BJT 3904
Current project status: the circuit using the above components is fully operational and is
able to run on a single partially discharged battery to provide appreciable light output
continuously for over 10 hours without any drop in brightness. Further optimisation of the
circuit is being considered along with making it ready for production.

POSSIBLE CHANGES TO BE IMPLEMENTED
1. FERRITE CORE T-4520
Al value>500
Outer diameter=45mm
Inner diameter=28mm
Height=20mm
2. HIGH POWER LEDs
3. DISCHARGED BATTERY 1 1.1V
4. FET IRF530
5. POTENTIOMETER to alter light intensity as required
6. PRODUCTION GRADE BODY made of polycarbonate and kaolin coated glass
sphere/acrylic sphere
Computer generated model for production
REAL LIFE APPLICATIONS AND ADVANTAGE OF A JOULE THIEF The making of the project was a very economical affair. The whole project can be realised and can be used for a wide variety of applications The major applications being that:
The use of discharged or dead batteries for lighting small areas for relatively long
durations
The circuit can be applied onto a printed circuit board (PCB) for compact design.
Scientifically the voltage boost does save a lot of power from the 230v 1 phase
supply or the 400V 3 phase supply as the original source of power is merely 1V DC

In villages and other rural areas where still lighting is still an issue, this kind of a
setup will be a boon to humanity
The use of more than one LED’s at the output can provide extra lighting
This kind of lighting aims at optimum usage of electronic waste.
Our design is minimalistic and flexible enough to handle more than one type of
commercially available batteries, and is designed to be maintenance free. Our goal is to
achieve the luminous intensity of a standard 0W incandescent bulb which is sufficient to see
with comfortably.
CONCLUSION:
As it can be deciphered from the above descriptions, our main aim is to implement an
existing, lesser known technology for producing a product that is economical and can
produce a simple solution to address the basic, essential issue of lighting. This product also
has a large scope of greater development and more applications, which we will be looking at
during the course of its construction.

5. GENERATION OF ENERGYINDUCED BY VEHICULAR MOVEMENT
COLLEGE: SRI JAYACHAMARAJENDRA COLLEGE OF ENGINEERING, MYSORE
GUIDE:
COLLEGE STUDENTS: JAYANTH BAPU, ASHWIN KUMAR, SUBASH A, TARIQ AHMED FARHAN
SCHOOL STUDENTS: HARISH A 9TH std MANASAGANGOTHRI HIGH SCHOOL
ABSTRACT
As the title goes, we intend to design a system to harness the energy through movement of
vehicles on the busy streets of India. The inspiration to design such a system came from two
main sources.
The traffic congested streets of Bangalore
The Faraday’s law of Induction
Faraday’s Law of Induction
Much description needn’t be given about the former, but about the latter, Faraday’s law of
induction states that “Any change in the magnetic environment of a coil of wire will cause a
voltage (emf) to be “induced” in the coil. No matter how the change is produced, the
voltage will be generated.”
The quantitative statement of Faraday’s law is: The induced electromotive force in any
closed circuit is equal to the negative of the time rate of change of the magnetic flux
through the circuit.
The magnetic flux is defined by a surface integral:
That is, relative motion between the coil and the magnet causes electricity to be generated
in the closed circuit connected to the coil. The strength of this Electro-Magnetic Force
induced depends on several factors, some of which are:
Strength of the Magnetic field / Magnet
Length and Diameter of the coil
Many devices use the principle of Faraday’s law and are highly reliable in their performance.
Some of the devices are Dynamo, Induction motors, Induction chargers and so on.
Thus, we can conclude that this law can be used successfully to generate energy and this
induced energy can be harnessed in a battery which can be used to power electronic
applications.
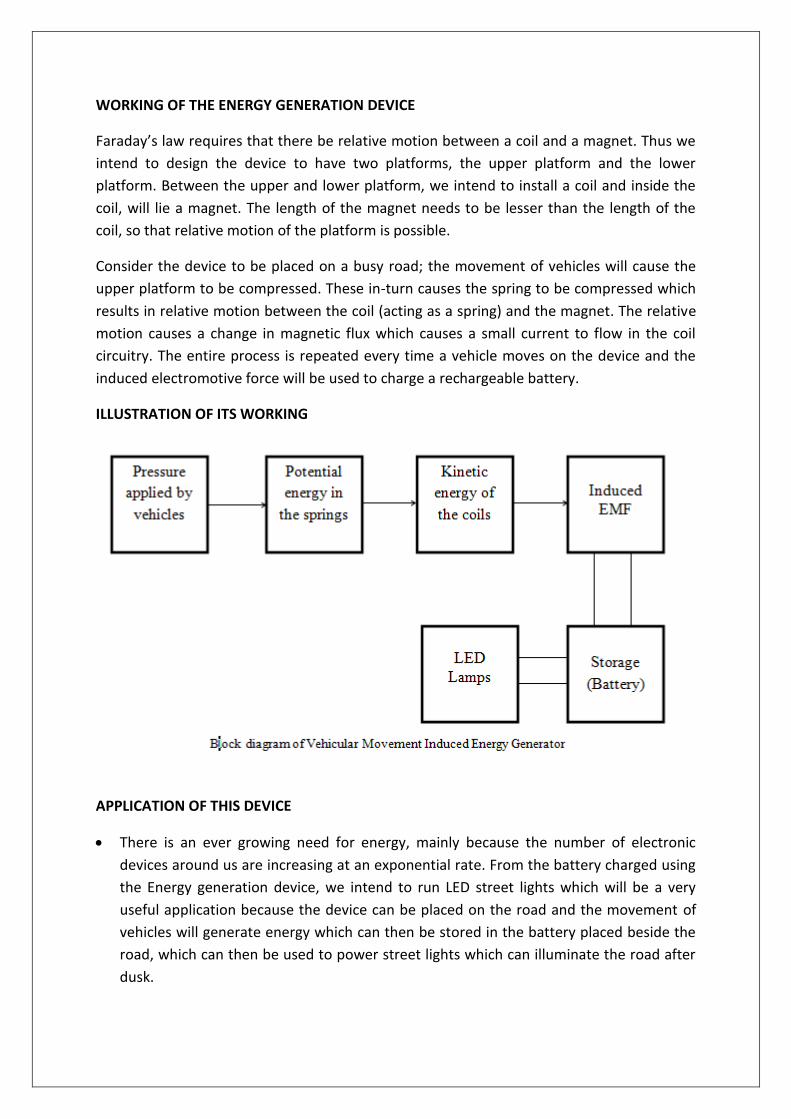
WORKING OF THE ENERGY GENERATION DEVICE
Faraday’s law requires that there be relative motion between a coil and a magnet. Thus we
intend to design the device to have two platforms, the upper platform and the lower
platform. Between the upper and lower platform, we intend to install a coil and inside the
coil, will lie a magnet. The length of the magnet needs to be lesser than the length of the
coil, so that relative motion of the platform is possible.
Consider the device to be placed on a busy road; the movement of vehicles will cause the
upper platform to be compressed. These in-turn causes the spring to be compressed which
results in relative motion between the coil (acting as a spring) and the magnet. The relative
motion causes a change in magnetic flux which causes a small current to flow in the coil
circuitry. The entire process is repeated every time a vehicle moves on the device and the
induced electromotive force will be used to charge a rechargeable battery.
ILLUSTRATION OF ITS WORKING
APPLICATION OF THIS DEVICE
There is an ever growing need for energy, mainly because the number of electronic
devices around us are increasing at an exponential rate. From the battery charged using
the Energy generation device, we intend to run LED street lights which will be a very
useful application because the device can be placed on the road and the movement of
vehicles will generate energy which can then be stored in the battery placed beside the
road, which can then be used to power street lights which can illuminate the road after
dusk.

Furthermore, the same device can be placed near the entrance of bus-stands. The
frequent movement of busses into and from the bus stand will ensure that the magnetic
flux lines are cut regularly and that energy is constantly generated. This energy can be
stored in a rechargeable battery which can be used to run a display board which can
display the arrival and departure time of busses, the platform number and so on, which
can be retrieved using a Global Positioning System placed on the busses. Since the
display board is run using self-generated energy, it becomes a very useful and
informative device which is also energy efficient and eco-friendly.
CONCLUSION
The thirst for energy in this day and age could be quenched with the extensive use of a
device like the one intended to be designed by us. Since the device is triggered by the
vehicular movement, the heavy traffic on the streets of India can be put to good use. Energy
generated from the above device can be stored in a rechargeable battery which can power a
variety of electronic devices and has innumerable applications.
To conclude, the need for an eco-friendly, safe and cheap form of energy for several
electronic applications is intensively needed in our country thus providing great scope for
our project.

6. GSM BASED LPG GAS CONTROLLER
COLLEGE: PROUDADEVARAYA INSTITUTE OF TECHNOLOGY,HOSPET, BELLARY.
GUIDE: SANDHYA DASS
COLLEGE STUDENTS: KARTHIK NAIDU, GOWRI S KAMMAR, SOUJANYA A
SCHOOL STUDENTS: SANCHITH SAVIO 8TH std, ANKITH SAVIO 7TH std; KENDRIYA VIDYALAYA, HOSPET.
OBJECTIVE:
This Project helps to maintain the security by checking the LPG Gas at our Homes for
Leakage and also efficiently can be used for advance booking when the percentage of gas in
the cylinder comes below 50%
INTRODUCTION:
This project is microcontroller based project. A Gas sensor is used to detect dangerous gas
leaks in the kitchen or near the gas heater. This unit detects 300 to 5000ppm of Natural Gas.
Ideal to detect dangerous gas leaks in the kitchen. Sensor can be easily configured as an
alarm unit. The sensor can also sense LPG and Coal Gas. Ideal sensor for use to detect the
presence of a dangerous LPG leak in your car or in a service station, storage tank
environment

Gas Sensor
This unit can be easily incorporated into an alarm unit, to sound an alarm or give a visual indication of the LPG concentration. The sensor has excellent sensitivity combined with a quick response time. Gas leakage detected is messaged to the authorized person using cellular network called GSM. In this project there are mainly two units, GSM modem and microcontroller unit. GSM modem can be configured by standard GSM AT command set for sending and receiving SMS and getting modem status. Depending upon the Gas sensor output microcontroller can send message to the authorized person and also depending upon the message received the microcontroller unit will control the devices and acknowledges the device status to the user as SMS. Another objective of this project is when Gas reaches the pre-defined level, with the help of GSM modem, LPG cylinder is registered via SMS to the Gas Agency and alert SMS to Authorized User. Block diagram of GSM based gas leakage detection system
HARDWARE USED:
Power Supply 9V&5V DC: 7809 and7805

Micro controller: AT89C51-Atmel
LCD : (Liquid crystal display) 2 x16
GSM Modem
Sensors
Driver circuits
APPLICATIONS
They are used in gas leakage detecting equipment’s in family and industry.
They are suitable for detecting of LPG, natural gas, town gas.
Avoid the noise of cooking fumes and cigarette smoke.
Alert SMS to Authorized user.
Pre-booking of LPG.
Percentage of gas in cylinder booking automatically through SMS alert
Contact less Optoelectronic switch, control and counter
ADVANTAGES
GSM providers are almost available almost in every countries
We can control the home appliances by sending an SMS to programmed home automation kit with coded instructions by the authenticated programmer simultaneously we will get a feedback and the status of the device. Since we have an option of roaming service provided by GSM service providers hence we can get SMS at any place on the earth.
We can switch on/off the devices by sending a SMS from any place in the world.
It is cheaper when compared to other type of automation system.
It is more effective when compared to other type of automation system.
It is easy to change to the systems action according to change in situation.
CONCLUSION This project is microcontroller based project. A Gas sensor is used to detect dangerous gas leaks in the kitchen or near the gas heater. Ideal to detect dangerous gas leaks in the kitchen. Sensor can be easily configured as an alarm unit. The sensor can also sense LPG and Coal Gas as well as Ideal sensor for use to detect the presence of a dangerous LPG leak in your car or in a service station, storage tank environment. This unit can be easily incorporated into an alarm unit, to sound an alarm or give a visual indication of the LPG concentration. The sensor has excellent sensitivity combined with a quick response time. When GAS leakage is detected and is messaged to the authorized person using cellular network called GSM. When Gas reaches the pre-defined level, with the help of GSM modem, LPG cylinder is registered via SMS to the Gas Agency and alert SMS to Authorized User.

7. IMPLEMENTATION OF MAXIUM POWER POINT TRACKING CONTROLLER
FOR SOLAR PANNEL
COLLEGE: NMAM INSTITUTE OF ENGINEERING, NITTE, UDUPI.
GUIDE: PRADEEP KUMAR
COLLEGE STUDENTS: PRABHAKAR KUMAR PANDE, MURALIDHAR MENDON, SOURABH ARAVIND RAO,NISHANTH K J
SCHOOL STUDENTS: SHASHANK 10TH std, RUCHIT KUMAR 10TH std, DR. N S A M HIGH SCHOOL, NITTE.
ABSTRACT
Maximum Power Point Tracker (MPPT) is a photovoltaic system that uses the photovoltaic array as a source of electrical power supply. Every photovoltaic (PV) array has an optimum operating point, called the maximum power point, which varies depending on cell temperature, the insolation level and array voltage. The function of MPPT is needed to operate the solar panel at its maximum power point. The design of a Maximum Peak Power Tracking (MPPT) is proposed utilizing a buck-converter topology. Solar panel voltage and current are continuously monitored by a closed-loop microprocessor based control system, and the duty cycle of the buck converter continuously adjusted to extract maximum power
INTRODUCTION
Energy has become an extremely hot topic over the last couple of years, with reasons for our energy concerns ranging from environmental to political to financial. Despite differing reasons, it is clear that the solution to our energy problems is to transition from traditional energy sources to renewable energy sources. Solar cells are great things. Unfortunately, they are not very smart. Neither are the batteries which are at the receiving end of a solar panel. Due to the poor matching between the two, most often the current delivered to the battery is far below the rated value of the solar panel. This is the reason for low efficiency of Solar panels and due to this price to performance ratio of solar panel is low. And the efficiency further decreases in cold weather, cloudy or hazy days In this project we aim to optimize the extraction of maximum power from the Photovoltaic solar panel. The voltage at which PV module can produce maximum power is called maximum power point.
DESIGN CONSIDERATION
1) Solar Panel
A solar panel is a set of solar photovoltaic modules electrically connected and mounted on a supporting structure. A photovoltaic module is a packaged, connected assembly of solar cells. The solar module can be used as a component of a larger photovoltaic system to generate and supply electricity in commercial and residential applications.
The Solar panel used for this project is a Tata BP TBP1210 with ratings as follows
Ratings:

Wattage =10 watts, Vmp =17 Volts, Imp =0.6 Amps, Voc =21.6 Volts, Isc = 0.7 Amps
Solar cells have a single operating point where the values of the current (I) and
Voltage (V) of the cell results in a maximum power output. These values correspond to a particular resistance, which is equal to V/I as specified by Ohm's Law. A Solar cell has an exponential relationship between current and voltage, and the maximum power point (MPP) occurs at the knee of the curve.
The characteristics of the solar panel used are measured under various load conditions and the characteristics are plotted using MATLAB simulation tool. The graph is shown in the figure below
2. Buck Convertor
A buck converter is a dc-dc converter which produces a lower average output Voltage than the dc input voltage. It is a switching mode regulator since it makes use of the switching action of a semiconductor device such as power BJTs or MOSFETs to manipulate the dc output voltage.
OPERATION: The topology of the buck converter is shown in figure below. The switch shown may implemented by using either a power BJT or MOSFET. The inductor and capacitor form a low pass filter which helps to diminish the output voltage fluctuations.
During the interval when the switch is on, the diode becomes reversed biased and the input provides energy to the load as well as to the inductor. During the interval when the switch is

off, the inductor current flows through the diode, transferring its stored energy to the load. The input to the low pass filter consists of a DC component of output voltage and the harmonics at the switching frequency and its multiples. The corner frequency of this low pass filter is selected to be much lower than the switching frequency, thus essentially eliminating the switching frequency ripple in the output voltage.
The principle of operation of Buck converter is using Pulse Width Modulation. Pulse-width modulation is a modulation technique that conforms the width of the pulse, formally the pulse duration, based on modulator signal information. The average value of voltage fed to the load is controlled by turning the switch between supply and load, on and off at a fast pace. Longer the switch is on compared to the off periods, higher the voltage at the output
The term duty cycle describes the proportion of 'on' time to the regular interval or 'period' of time; a low duty cycle corresponds to low power, because the power is off for most of the time. Duty cycle is expressed in percent, 100% being fully on.
Here we try to sense the output power of the solar panel and try to map it to the duty cycle to make sure that the output is constant at 12 volts

Necessary Parameters of the Buck convertor 1. Input Voltage: VIN = 17 volts 2. Nominal output voltage: VOUT = 12 volts 3. Input current: IIN = 0.6 amps 4. Maximum output current: IOUT(max) = 0.86 amps 5. Frequency of operation: f = 3.333 kHz
Circuit parameters: Inductor: 2.5 mH Capacitor: 5uF Diode : Schottky Diode The values of Inductor and capacitor are calculated from set of predetermined equations and the values used here are minimum. The values can be extended to meet our requirement. 3) Feedback Circuit: The purpose of Feedback circuit is to sense the values of voltage and current from the solar panel and to relay the information to the microcontroller. The feedback circuit here comprises of Voltage and Current sensing elements which provide the feedback
Voltage Sensing:
We have used a potential divider circuit for sensing the voltage and the information is delivered to the ADC of the microcontroller.
Current Sensing:
We try to measure the voltage drop across the inductor which is the proportional to the current flowing through the inductor and this is given to the opamp which amplifies this value and delivers the information to the microcontroller’
Microcontroller accepts the values and decides the duty cycle according to the algorithm.
4) Microcontroller:
The Arduino Mega 2560 is a microcontroller board based on the ATmega2560 .It has 54 digital input/output pins (of which 15 can be used as PWM outputs), 16 Analog inputs, 4 UARTs (hardware serial ports), a 16 MHz crystal oscillator, a USB connection, a power jack, an ICSP header, and a reset button. It contains everything needed to support the microcontroller; simply connect it to a computer with a USB cable or power it with a AC-to-DC adapter or battery to get started.

The Analog in port of the microcontroller can accept voltage of 3.3 volts. Hence the potential divider circuit has been provided to step down the voltage at any instant of time to 3.3 volts.
Parameters:
5) Algorithm:
The Algorithm for deciding the duty cycle is based on the concept of Incremental Conductance method. In Incremental conductance method, the controller measures incremental changes in array current and voltage to predict the effect of a voltage change. The incremental conductance method computes the maximum power point by comparison of the incremental conductance (IΔ / VΔ) to the array conductance (I / V). When these two are the same (I / V = IΔ / VΔ), the output voltage is the MPP voltage. The controller maintains this voltage until the irradiation changes and the process is repeated.
Microcontroller ATmega2560
Operating Voltage 5V
Input Voltage (recommended) 7-12V
Input Voltage (limits) 6-20V
Digital I/O Pins 54 (of which 15 provide PWM output)
Analog Input Pins 16
DC Current per I/O Pin 40 mA
DC Current for 3.3V Pin 50 mA
Flash Memory 256 KB of which 8 KB used by boot loader
SRAM 8 KB
EEPROM 4 KB
Clock Speed 16 MHz

IMPLEMENTATION
The Solar panel output is connected to the drain of the MOSFET and to the potential divider circuit for voltage sensing.
The MOSFET is driven by the driver circuit which is connected to the microcontroller through the optocoupler. The optocoupler is used to provide electrical isolation between MOSFET and microcontroller.
The MOSFET output is given to the buck convertor. The buck converter and load is connected to the source of the MOSFET.

The voltage drop across the inductor of the buck converter is found by using two voltage sensors in form of potential divider circuits and this is given to Op amp.
The Op amp amplifies the gain, reduces the noise and gives it to the Analog-in ports of the microcontroller. The voltage divider circuit input is also fed to the microcontroller and based on the algorithm, the duty cycle for the operation of buck is decided and the power is delivered to the load.
The microcontroller and the op amp are powered by 5V DC which is provided by the voltage regulator IC7805
Components Used
1) Microcontroller Arduino Mega 2560
2) Voltage regulator IC7805
3) Diode Schottky Diode
4) Resistor 220 ohm, 1.2kohm, 3.3kohm, 10kohm, 22kohm
5) Capacitor 0.1uF, 3.3uF, 100uF, 300uF
6) Inductor 5mH
7) Op amp LM321
8) MOSFET IRF530N
9) MOSFET driver IC IC TL494
10) Optocoupler
CONCLUSION
A renewable energy system as shown in this project is suitable for several applications in domestic or industrial level.
By developing an efficient algorithm to control and optimize the power delivered to the battery, we are able to minimize the losses and improve the efficiency of Solar panels.

8. LOW COST SOLAR LIGHTING SYSTEM FOR RURAL AREAS
COLLEGE: VIDYA VIKAS INSTITUTE OF ENGINEERING AND TECHNOLOGY, MYSORE.
GUIDE: SUREKHA MANOJ
COLLEGE STUDENTS: AKHIL K, ABHISHEK H N, ANTHONY THOMSON D
SCHOOL STUDENTS: MANOHARA 8TH std, SANJAY KUMAR H 9TH std, GHS KALLURNAGANAHALLI.
INTRODUCTION
The present efficiency of commercial solar panels is about 11% to 15%
The biggest challenge is to improve the efficiency of the solar panels which mainly depends upon individual cell junction, doping material, electronic drawbacks etc.
Storage of energy also plays a major role.
So the future developments will be on these core issues. But as of now the technology involving the efficiency improvement is not affordable and hence we need to manage the existing technology keeping in mind the economic aspects because we here are designing a prototype which suits rural areas and become a perfect alternative for harmful kerosene lamps.
There are mainly three aspects in energy sector –
Energy production
Energy Storage
Energy Transmission As this is an integrated system, Energy transmission is cancelled out. Let us observe one by one – Demand of energy in rural areas Supply of energy by prototype
Requirement for the rural household – ( 12ftx12ft)
4W Tube light 3W down light Total power needed for lighting it for 5 hours = (4 + 3) x 5 = 35Wh (approx.)
Battery ratings –
12V, 7.2Ah Total storage capacity of battery = 12 x 7.2 = 86.4Wh (approx.) But for long life and safety of battery, only 65% of battery should be used:-

= 0.65 x 86.4 = 56.16Wh (approx.) Requirement was only 35Wh and 56.16 – 35 = 21.6Wh of energy acts as reserve energy.
Let us now go to power supplied by solar panel –
Ratings of the panel - 21.7V x 0.57A = 12.084Wh
But when a load i.e. battery is connected it pulls down the voltage to 12.7V ( because we are using
simple charge controllers with regulators, cut-out circuits and not using MPPT just to bring down the
overall cost )
Therefore . . .
Energy produced by panel is = 12.7 x 0.57 = 7.239Wh
Approx. sunlight hour considered as per ISRO is 5hours a day.
7.239 x 5 hours = 36.95Wh
Demand of energy – 35Wh
Supply of energy - 36.95Wh
Therefore the kit has a balanced supply and demand chain and proves to be a promising and economical one.
HYDROGEN TECNOLOGY FOR STORAGE-
We saw that the power calculated was only for 5 hours. But we know that sunlight during the
summer season are up to 12 hours. So excess of 7 hours is being wasted.
This energy produced in 7 hours is stored as hydrogen in large container which could be used as
backup during rainy and winter season.
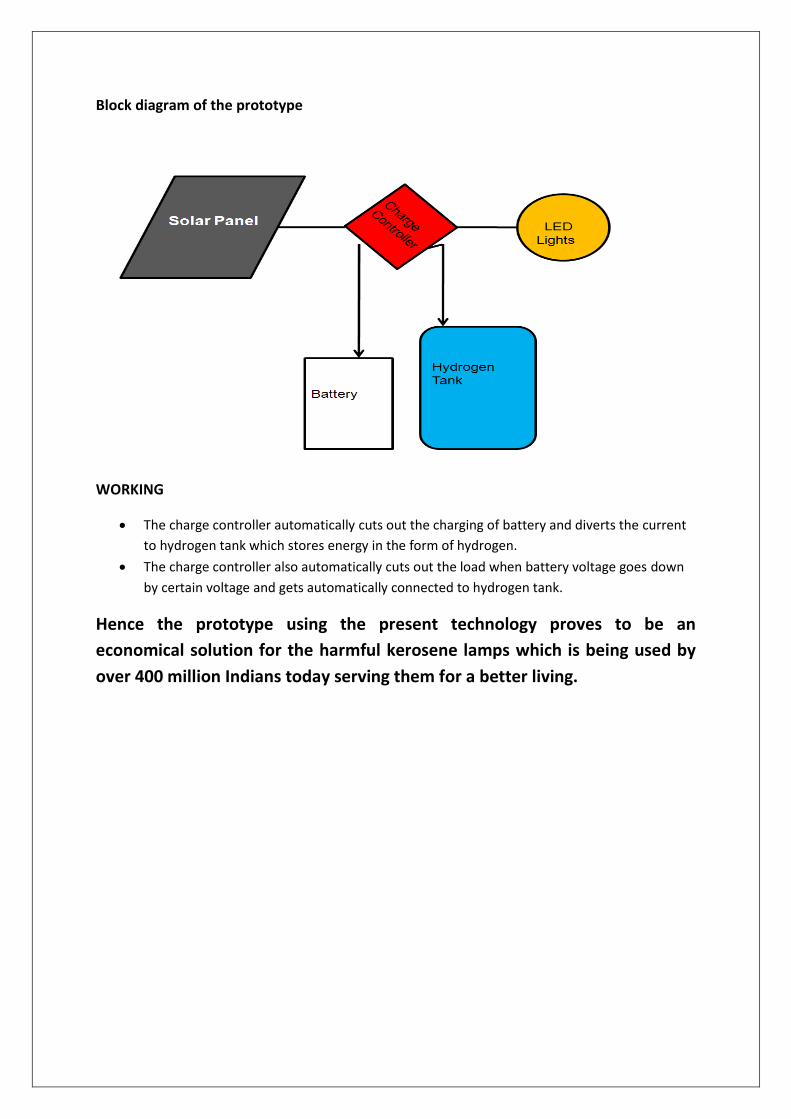
Block diagram of the prototype
WORKING
The charge controller automatically cuts out the charging of battery and diverts the current
to hydrogen tank which stores energy in the form of hydrogen.
The charge controller also automatically cuts out the load when battery voltage goes down
by certain voltage and gets automatically connected to hydrogen tank.
Hence the prototype using the present technology proves to be an
economical solution for the harmful kerosene lamps which is being used by
over 400 million Indians today serving them for a better living.

9. MODERN AUTOMATION SYSTEM FOR PROTECTION OF HIGH VOLTAGE
POWER TRANSFORMER WITH GSM TECHNOLOGY
COLLEGE: SHRIDEVI INSTITUTE OF ENGINEERING AND TECHNOLOGY, TUMKUR.
GUIDE: PROF B S SOMASHEKARAIH
COLLEGE STUDENTS: DARSHINI C, ANUSHA K, POOJA H K.
SCHOOL STUDENTS: HEMALATHA K 10TH std, RATHNA R V 10TH std, ARYAPUTRA HIGH SCHOOL, TUMKUR.
INTRODUCTION: Transformer is a vital part of transmission and distribution system. High voltage power transformer is widely used in all over the world as generation of Electrical Power in either voltage levels. In power-transformer lots of equipment working together like cooling fan, bucholz relay, differential relay, circuit breaker, breather, bushing, and so on. So it is necessary to find out problems occur in high voltage transformer and to eliminate them as early as possible so the high cost & high voltage power transformer does not get damage and have a longer life. Here we should concentrate on how to minimize internal fault and ensuring protection scheme for external faults and operate them in smarter way.
In this paper we have tried to extend the use of computer and modern automation system for protection and maximum use of High voltage power transformer, its advantages and cost effectiveness. Programmable logic controllers (PLC) can be used for control & automation of High voltage power Transformer. For isolated operation, communication with PLC can be performed.
For continuous monitoring purpose, a personal computer can be interfaced with PLC and continuous data can be recorded regularly. Here we are going to control transformer operation using Global System for Mobile Communications (GSM) technology. The main concept behind the project is every condition of substation transformer sent through SMS using GSM technology to receiving station .The sent SMS is further processed & required data is collected to perform several operations for protection. Power cut-off command can also be sent through by GSM technology.
Need for automatic control of high voltage transformer:
Overloading of high power transformer can cause rise in temperature of both transformer oil and windings, if this limit exceeds the transformer limits, the insulation will get damaged and fail permanently.
Over excitation results in excess flux , which causes transformer heating, Increasing excitation current, noise and vibration
For normal operation oil level should be maintained at required level , if it decreases by heating it will effect cooling and insulation hence it should be maintained.
Replace the high cost differential relay by using PLC logic circuit.
All information about transformer can reach in the control room through by SMS and can make a proper strategy for management.
Using GSM technology shutdown substation(PLC and GSM system connected transformer only)
OBJECTIVE:
By regularly monitoring health condition of transformer, it can be economical and increase reliability. During abnormal conditions exceeding its specified limits, information is immediately communicated through GSM technology to the operator and also to concerned authority for possible remedial action.
The main objective of this project is to gain the knowledge and experience in developing a real time application and save energy supplied by KPTCL. Apart from this, to gain the knowledge on PLC and GSM technology.
The goal of this project is to save man power, save electricity by using PLC, also using a SMS based method to monitoring the process which is useful for the digitalize the automated process.
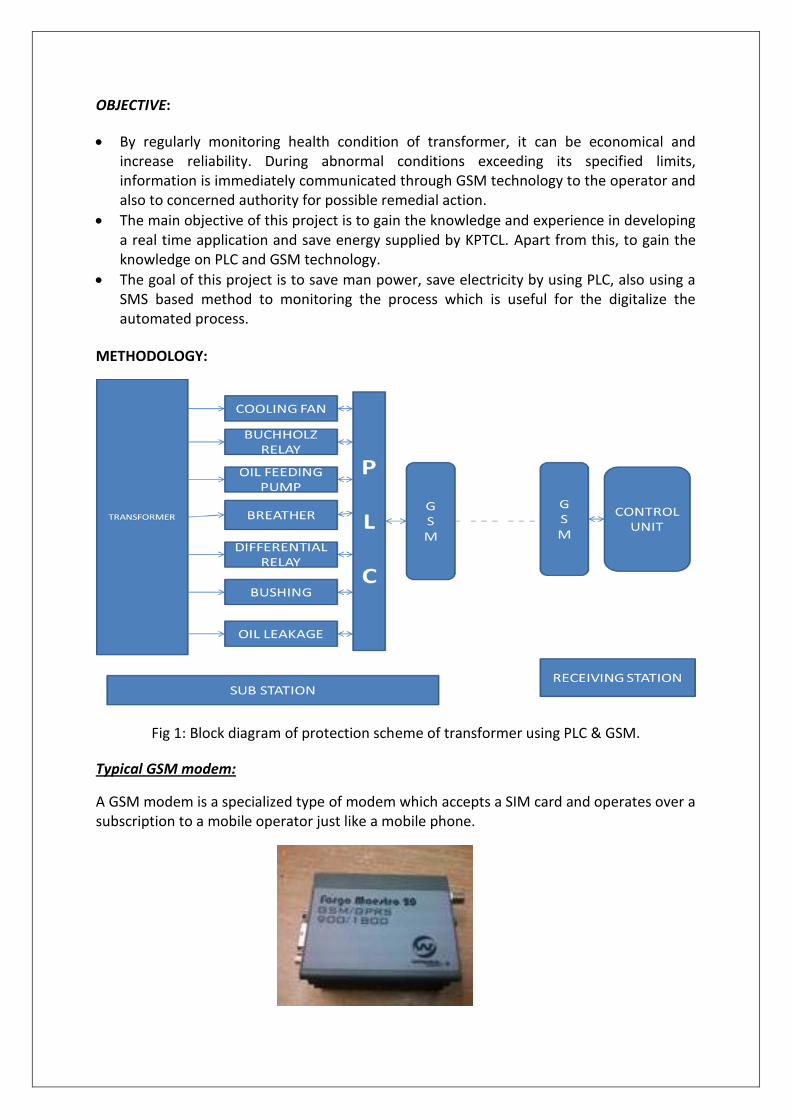
METHODOLOGY:
Fig 1: Block diagram of protection scheme of transformer using PLC & GSM.
Typical GSM modem:
A GSM modem is a specialized type of modem which accepts a SIM card and operates over a subscription to a mobile operator just like a mobile phone.

OPERATION:
The outer view of the methodology is shown in the block diagram. In substation, the transformer and protecting devices are connected to a pre-programmed PLC (programmable logic controller) which is further interconnected with a GSM (global system for mobile communication ).At the receiving station another GSM is connected to the control unit on receiving the SMS from the substation it isolates the fault or shuts down the transformer immediately.
They can be used for full plant automation including governing of auto-operation includes cooling fan, control, oil level control, automatic start/stop of pump, transformer oil leakage control, replacement of Buchholz relay by pressure sensor control, start/stop of auxiliary systems, and protection requirement etc. Functions other than control like continuous monitoring, data recording, instrumentation and protections can also be performed.
CONCLUSION:
In this paper we are using computer with PLC based logic for controlling whole component which are involved in a protection of transformer and also use the component only at the moment of need, so it reduce the wastage of power and unnecessary operation. Generally the high cost relay, timer, counter etc. are used for proper operation, in this situation by using PLC we can replaced all these to a single computer. Another benefit is that PLC sense the situation and gives information before the dangerous situation to the control room via GSM technology. So that we can take a necessary step for that situation. These strategy provide a best platform where protect and use optimum of high voltage power transformer.
10. OCEAN WAVE ENERGY EXTRACTOR
COLLEGE: SAMBRAM INSTITUTE OF TECHNOLOGY, BANGALORE.
GUIDE: SRIDHARA NAGARAJ
COLLEGE STUDENTS: LAKSHMIPRIYA, RAHUL SINGH, CHETHAN D V
SCHOOL STUDENTS: NIKITHA 9TH std, ANJALI SINGH 9TH std, SOUHARDA PUBLIC SCHOOL, M S PALYA.
OBJECTIVE: To demonstrate the concept of extracting energy from Ocean Sea Waves and propagate, popularize this source of unconventional source of energy. HYPOTHESIS Ocean waves containing huge amount of potential and kinetic energy heave up and down in a Simple Harmonic Motion (SHM) in a vertical direction. This Energy can be converted to Mechanical and Electrical Energy. METHOD The project focuses on generating power from ocean waves by using one of the many concepts and mechanism proposed but not implemented. The objective can be achieved by a simple demonstrable experimental model. The method involves converting the vertical motion of waves to rotary motion of a shaft by Float-Rack and Pinion arrangement. A generator connected to the pinion shaft through a gear box generates electricity. RESEARCH WORK Research work carried out by surveying books, articles, existing experimental and commercial ocean wave energy conversion plants shows that worldwide very few plants have been setup. Out of the many conceptual mechanism thought of, only very few mechanisms have been utilized. The commercial exploitation is still in infant stage. EXPERIMENT The experimental set up has a plastic 4’’ U tube with wave generating mechanism on one limb and wave energy utilization mechanisms on the other limb. The wave generating mechanism on one left limb has a hand crankable cam which moves a piston up and down in the plastic pipe. The cam imparts SHM to the water in the pipe. The SHM is transmitted hydraulically to the right side limb. In the right limb the SHM of water is imparted to a reciprocating piston on top which is mounted a rack and pinion arrangement. The rack and pinion arrangement converts the reciprocating motion to rotary motion. The shaft of the pinion is connected to a gear box to step up the speed. The output of the gear box is connected to a dynamo through a mechanical coupling. A colourful LED glows. DATA Output - 3v-3w Efficiency 75% Cost Rs. 10,500

OBSERVATION The mechanism can successfully extract energy from sea waves. The voltage and power output is not steady. For making the voltage steady the gear box output shaft speed requires to be governed with additional mechanisms and output voltage requires voltage regulators. CONCLUSION The experimental set up is successfully capable of demonstrating the concept and fulfils the objective.
11. OPTIMAL UTILIZATION OF AVAILABLE SOLAR ENERGY
COLLEGE: M S RAMAIAH INSTITUTE OF TECHNOLOGY, BANGALORE
GUIDE: ARCHANA DIWAKAR
COLLEGE STUDENTS: BALACHANDRA M HEGDE, B SUNNY AROKIA SWAMY,PAWAN RAMAKRISHNA MANVI
SCHOOL STUDENTS: SHOIAB PASHA, BABU SALEEM, 9TH std RAMAIAH HIGH SCHOOL.
ABSTRACT:
Technology is increasingly weaving its way into our daily lives. Due to this there is a large demand for Energy consumption. The power which is being generated is not sufficient to meet the required demand and finally this causes a deficiency in power in some economically backward sectors. Hence, saving the power has become one of the major objective of many people. This Project mainly focuses on these economically backward sector areas by developing a standalone photo voltaic system which is of affordable cost and secondly it uses total solar energy which is available on earth by converting solar energy into thermal as well as electric energy efficiently. The thermal energy is used to make water hot and electric energy is used very efficiently by varying the intensity of light as per the human requirement. Hence, this proposed model with light intensity variation can be used in huge buildings, hospitals etc. for saving of power.
INTRODUCTION:
Energy is basically defined as the capacity to do work. Energy is available in different forms like Kinetic Energy, Mechanical Energy, Chemical Energy, Heat Energy, and Electrical Energy etc… Energy resources are mainly classified into two forms on the basis of their availability i.e., Renewable (Non-Conventional) Energy resources and Non-Renewable (Conventional) Energy resources.
Non-Renewable Energy resources also known as finite resources are the resources that will not sustain for a long period of time for economic extraction. Some of the examples are Coal, petroleum, oil, gas and metal ores etc… The main disadvantage is these processes generally take from tens of thousands to millions of years and they leave behind harmful by-products upon combustion, thereby causing a lot of environmental pollution which has become a major concern in global warming.
Renewable Energy is generally defined as energy that comes from resources which are naturally replenished on a human timescale such as sunlight, wind, rain, tides, waves and geothermal heat. Renewable energy replaces conventional fuels in four distinct areas: electricity generation, hot water/space heating, motor fuels, and rural (off-grid) energy services. About 16% of global final energy consumption presently comes from renewable resources, with 10% of all energy from traditional biomass, mainly used for heating, and 3.4% from hydroelectricity. New renewable (small hydro, modern biomass, wind, solar, geothermal, and bio fuels) accounts for another 3% and are growing rapidly. The pie chart given below clearly depicts the total world energy consumption by source in the year 2010.

PRESENT SCENARIO
With growing urbanisation, industrialisation and modern lifestyle there has been an increasing demand towards energy. The modern technology is definitely aiding the energy demand but it is not fulfilling the demands. This leads to an unequal distribution of power among the different consumer sectors. Due to economic benefits power distributors, tend to divert the power from rural areas towards urban areas which lead to acute power shortage in the rural areas.
Based on the study on the Indian state of Karnataka we can substantiate the above statements.
From the above bar graph it is pretty evident that the demand and generation of power is increasing over the years, but there is an increasing mismatch in the same. As we see in the financial year 2005, the deficit was just 4% but it has increased around three times in the next 7 years. In rural areas, the deficit is met mainly by Bio-gas whose disadvantages over shadow their advantages, as those are expensive, harmful to environment, has a very low efficiency and requires more land. It also needs a regular supply of raw materials. Most of these can be overcome by solar energy which is economical over a long run and has abundant raw material in the form of sunlight.

Why renewable energy has great importance?
Minimal impact on environment
Less maintenance than traditional generators
Economic Benefits
Power available to the areas near the Grid
Reliable and Resilient energy system
Stable energy prices
Contribute to increasing energy independence and security of energy supply at National level
PROPOSED MODEL
After a literature survey on Energy utilisation and resources available mainly in the state of
Karnataka, We have come to a conclusion that solar energy is a better solution than other
renewable energy resources. Hence, this project mainly focuses on Optimal Utilisation of
available Solar Energy. The model has been proposed as a standalone PV system which can
be kept in each and every individual’s house. This model automatically varies the intensity of
light when it (light) is not required. While converting solar energy into electrical energy
there is a lot of thermal energy getting wasted in the form of heat. Hence this model uses
this thermal energy which is getting wasted to heat the water by placing water in pipes
behind the PV panel. This also helps the PV panel to keep the panel cool and increase its
durability and efficiency.
How the model works?
The block diagram of the proposed model is shown in the figure below. It clearly depicts the
working of the standalone PV power system. When the Sunlight falls on the PV panel there
is an electron hole pair generation which creates a potential difference, across the cell. As
each cell has very low voltage and current ratings hence, they are connected in series and
parallel combination to meet the required power requirement. The output voltage and
current of the PV panel is sensed by Voltmeter and Ammeter and their converted Analog
signals are sent to the microcontroller. The microcontroller (ATMEGA16) is programmed on
the basis of P&O algorithm which ensures the maximum power point at various solar
intensities. The generated control signal is sent to DC-DC converter (Buck Boost converter)
which matches the load and source impedance to satisfy the maximum power transfer
theorem. The Charge controller monitors the battery condition and also indicates the level
of the battery. As it is completely DC system, loads are connected directly from the charge
controller. LCD display is used to display the voltage, current and the battery level.

For lighting purpose LEDs are connected at the load point. A LED driver is designed to vary the intensity of light in order to achieve maximum utilisation efficiency. In the further sections we will see the different parts of the model.
Stand Alone Photovoltaic System Components
Photovoltaic Cell: A photovoltaic cell is a semiconductor device that converts light to
electrical energy by photovoltaic effect. If the energy of the photon of light is greater than
the band gap then the electron is emitted and the flow of electrons creates current.
PV Module: Usually, a number of PV modules are arranged in series and parallel to meet the
energy requirements. Series connections are responsible for increasing the voltage of the
model whereas the parallel connection is responsible for increasing the current in the array.
Sensors: The implementation of sensors is essential in order to achieve the desired functionality of the system. The sensors are the devices that are going to be in charge of

monitoring and communicating everything that was happening in the system to the microcontroller. Two of the sensors that were going to be needed in the design were a voltage and current sensor. Both of these sensors played a significant role in one of the main goals of the project which was achieving maximum power point tracking. As its name implies, these sensors keep the microcontroller updated with the voltage and current values being provided by the panel so that it can react to it accordingly.
Microcontroller: ATmega16 is a low power AVR 8 bit microcontroller. Some of the main features of this microcontroller are Two 8-bit Timer/Counters with Separate Prescalers and Compare Modes, One 16-bit Timer/Counter with Separate Prescaler, Compare Mode, and Capture Mode, Real Time Counter with Separate Oscillator, Four PWM Channels, 8-channel, 10-bit ADC, 2 Differential Channels with Programmable Gain at 1x, 10x, or 200x, Programmable Serial USART, On-chip Analog Comparator. The ADC and PWM of the microcontroller plays an important role in which ADC is used to take analog input i.e., from current and voltage sensor. PWM is used to generate a varying voltage level signals which is used to disturb the MPP point. Buck Booster Converter: The maximum PowerPoint tracking is basically a load matching problem. In order to change the input resistance of the panel to match the load resistance (by varying the duty cycle), a DC to DC converter is required. To obtain a stable voltage from an input supply (PV cells) that is higher and lower than the output, a high efficiency and minimum ripple DC-DC converter required in the system for residential power production. Buck-boost converters make it possible to efficiently convert a DC voltage to either a lower or higher voltage. Buck-boost converters are especially useful for PV maximum power tracking purposes.
Charge Controller: There are four possible states that the battery can be in that will determine what charging mechanism is going to be used. The quantitative value of each of the thresholds was determined by the battery and solar array that was ultimately implemented, but the software was able to check and react to the following conditions: Off State: When there is little or no power coming from the solar panel, the device should go into an off state to protect the battery from leaking back into the solar panel. On State: When there is minimal power coming from the solar panel, enough to power the system but not enough to move to the next state, the system turns on and attempts to deliver all of the power.
Bulk State: This is the main charging state where the MPPT algorithms were most relevant. Here the maximum power point was determined and the battery was charged accordingly. Float State: Once the battery reached a high enough voltage and was close to fully charged, the controller then moved into the float state. In this state, the goal was to maintain the voltage level and compensate for self-discharge. Battery: Battery is a small storage device which is used to store electrical energy. Technically, it is defined as a device that converts chemical energy contained in its active materials directly into electric energy by means of an electrochemical oxidation-reduction (redox) reaction. There are different types of batteries like Lithium ion, Lead acid, Nickel Cadmium etc. Lead acid battery is used for this project because of its features like
Nominal Voltage: 2.1V
Specific Energy: 33-42 W-h/kg
Moderate energy density of 60-110 W-h/L
Specific Power: 180 W/kg
Charging and discharging: 50-95% (Higher discharge rates result in considerable loss of
capacity)
Moderate rate of self-discharge of 3-20%
Cycle durability: 500-800 cycles
Moderately expensive.
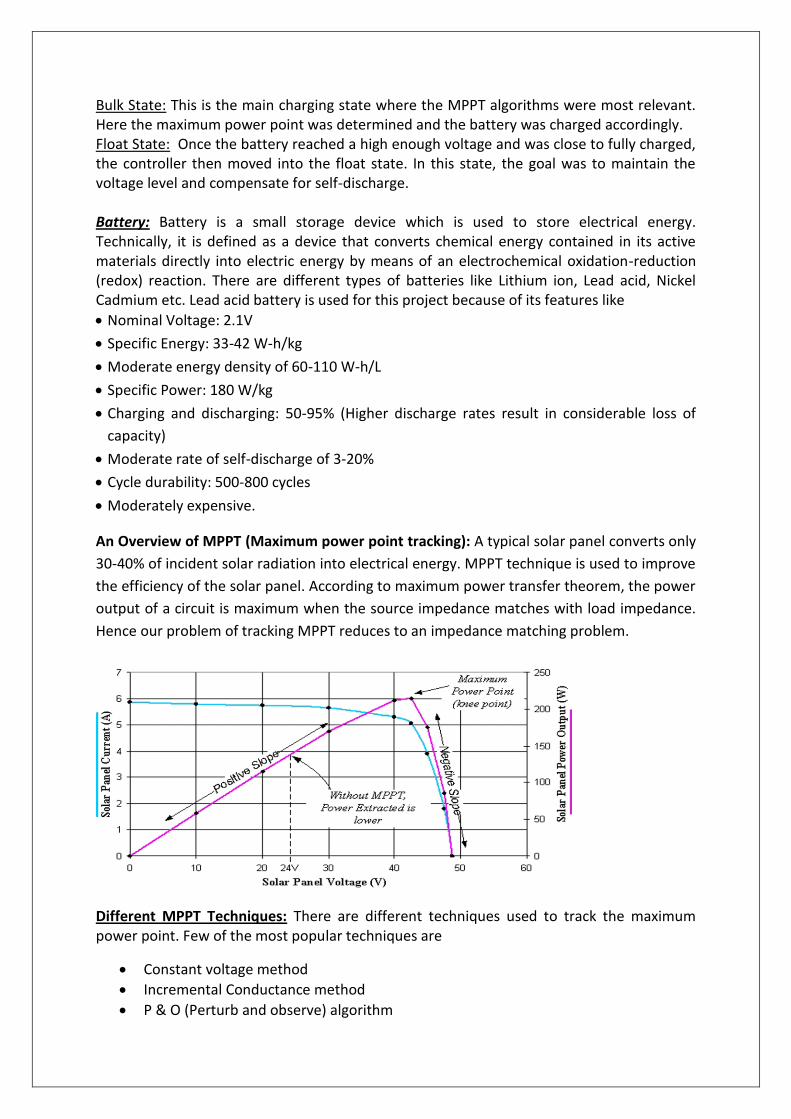
An Overview of MPPT (Maximum power point tracking): A typical solar panel converts only
30-40% of incident solar radiation into electrical energy. MPPT technique is used to improve
the efficiency of the solar panel. According to maximum power transfer theorem, the power
output of a circuit is maximum when the source impedance matches with load impedance.
Hence our problem of tracking MPPT reduces to an impedance matching problem.
Different MPPT Techniques: There are different techniques used to track the maximum power point. Few of the most popular techniques are
Constant voltage method
Incremental Conductance method
P & O (Perturb and observe) algorithm

We have used P & O (Perturb and observe) algorithm, it states that when the operating voltage of the PV panel is perturbed(disturbed) by a small increment, if the resulting change in power ΔP is positive, then we are going in the direction of MPP and we keep on Perturbing in the same direction. If ΔP is negative we are going away from the direction of MPP and the sign of Perturbation supplied has to be changed. The flowchart for the P&O algorithm is as shown in the figure,
CONCLUSION AND FUTURE WORK
The scope of this project was to create a working model of efficient standalone Photovoltaic system. Both Conversion and utilisation efficiency was improved. At conversion side MPPT technique was used. This system successfully uses the simple P&O algorithm to reach the Maximum power point (MPP). Reaching a stable, true MPP at steady state instead of oscillating around this point would improve the system's efficiency and increase reliability. Another extension of this project would be to directly power the microcontroller and other circuits from the solar panel instead from an external power supply.
To improve utilisation efficiency light intensity variation concept was used.

12. PEDAL OPERATED SOLAR PUMP
COLLEGE: JAWAHARLAL NEHRU NATIONAL COLLEGE OF NAVULE, SHIMOGA
GUIDE: ABDUL SALEEM S
COLLEGE STUDENTS: SOMASHEKAR M N, CHETHAN KUMAR G, BHARATH KUMAR NAIK B C.
SCHOOL STUDENTS: GIRISH P,DARSHAN M KAMBLE
ABSTRACT:
Many activities and processes in nature occur in cyclic manner and it now holds good in case
of the methodologies of energy conversion. Few decades ago man used his own body power
to get things done, later took help of animals and then with the advent of technology, used
non-renewable sources of energy. Now as a result of energy crisis, man is looking back
towards renewable sources of energy available in nature and also in man power. Most of
the farm lands have a necessity for the water lift and transportation. Also few of them will
be located in remote places up to which power supply may be uneconomical. Farmers of
such lands try to make a water transport medium which can be used for water lifting
purpose and the same are shown in literature section. All the models are to be installed in a
single location and are not portable. They are limited to an area of whole farm land. There is
a vast need for surface water lift for which the location of sources and destination are
distributed over a large farm lands. This demands a positive water lifting device which can
be carried to and installed in desired location. This issue motivated us to find a solution for
the above problem. Many designs and mechanism a have come into existence which were
economical but were huge and stationary.
On this context we have designed water lifter pump which is driven by pedaling action. This
pedaling action is converted into reciprocating motion of the piston inside the cylinder. This
makes our device a reciprocating water pump. Further for the need of portability which
again does not consume conventional energy for transportation, answer was the human
effort. Best suitable medium one could think would be a bicycle which already has some
required parts for our use. Since man power alone cannot be employed for hours together
for pumping the water which tiresome job for any individual, so we are making use of solar
energy and dynamo to substitute the man power in tiresome situations.
So that person need not pedal continuously for lifting water. Pump can be transported to
required place through bicycle and used at the spot effectively. Even bicycle can be used for
transportation for shorter distances by removing the link of pump so that cycle acts both as
pump and solar bike which saves the fuel (petrol/diesel). The solar panel and dynamo is
used to charge the battery and in-turn used to run motor. One of the dominant factors for
the portability is being light weight. To achieve this factor, all the parts made up of PVC,
Fiber, Plastic and least volume metal parts and solar panel, battery, motor. After the
fabrication, pump was tested for its overall performance and capabilities. The analysis

concludes with a result that the design model can be used for the shallow wells and with
further development s can also be made.
Fig:1 Fig:2
FABRICATION
Fig 3 : showing the step by step details of fabrication
PUMP
cylinder
piston
connecting rod
pump assembly
BICYCLE ALTERATIONS
crankshaft and bearing
yoke plate
pump fixture
assembly
SOALR PANNEL, DYNAMO
0.5*0.5 SQUARE PANNEL
MOTOR
DYNAMO
assembly

Fig:4
As we have shown in the above image (fig:1), we already designed the reciprocating pump
attached to the cycle which is portable. Since it is tiresome for an average human to pedal
continuously for hours together, we are designing to run the pump with the use solar
energy by attaching Solar Panel which generates electricity in-turn stored in battery shown
in fig:4. To compensate the full load capacity, we also using Dynamo which in-turn charges
the battery. Thus while raveling from place to place we can use solar energy to run cycle so
that fuel consumption can be reduced and eco-friendly.

13. POWERLINE CONTINUITY MONITORING
COLLEGE: JAWAHARLAL NEHRU NATIONAL COLLEGE OF NAVULE, SHIMOGA
GUIDE: CHANDRASHEKARA S
COLLEGE STUDENTS: AKASH D, MEGHANA M, SHARVARI H V, PRIYANKA H S
SCHOOL STUDENTS: POORNESH N, SHRINIDHI V R
INTRODUCTION In India we have overhead power transmission lines, as a result of this there are chances of occurrence of line to ground fault. The reasons may be
Natural calamities. Tree branches falling on these lines. Sagged lines cut by big vehicle and so on.
EFFECTS:
Common people and animals may come in contact and die.
Power loss may also occur.
It may damage nearby transformer due to 2 phase
SOLUTION: In the distribution phase as soon as the power line wires are cut or breaks, The ‘Current Transformer ‘is used to identify the wire cut . The current transformers works as a ‘Sensing device’. The mechanism works like this the current flowing through the transmission line is stepped down and given as input to the embedded micro controller, where it compares the input values and the set values. If in the transmission fault occurs the embedded controller detects and sends the signal to the output unit consisting of GSM module and Alarm unit using the GSM encoder technique an immediate message will be sent to BESCOMS OR MESCOMES depending on which ESCOMS is present in that city. These current transformers are inserted between 10-15 poles there by we can determine the actual place in which break down has occurred. This is how we can avoid the power loss as well as human death. CONCLUSION: By using this model we can avoid the power loss and death of human life so this model plays a major role in avoiding the wastage of power when power lines cuts or breaks. In the further part we can use this module for other continuity monitoring like cctv’s also………

14. SMART HIGHWAY INTEGRATED ENERGY PRODUCTION SYSTEM
COLLEGE: H M S INSTITUTE OF TECHNOLOGY, KYATHASANDRA, TUMKUR.
GUIDE: DR. VIJAYA VITTALA C B
COLLEGE STUDENTS: MD. AMINUL HASSAN, MD. ALAY MOHIUDDIN
SCHOOL STUDENTS: MODAMMED FAISAL 9TH std, SUHAIL SHARIFF 9TH std, H M S HIGH SCHOOL, TUMKUR.
ABSTRACT
The objective of the project is to design an ESM (Electro-solar Mechanical) highway energy
production system to capture wind energy from vehicles on the highways, solar energy from
the Sun and light energy from the beam of headlights of the vehicles at same time or
simultaneously. Wind energy is considered to be the fastest growing clean energy source
however; it is limited by variable natural wind. Highways can provide a considerable amount
of wind to drive an ESM (Electro-solar Mechanical) system due to high frequency vehicles
traffic. This energy is unused till now or used in little considerable amount. Extensive
research work on wind patterns is required to determine the average velocity of the wind
created by vehicles running on the highways/expressways and the angle of
impact/attack/strike on ESM system. With concern to this, we had tried to develop an ESM
system which works on the principle of these highway Wind energy and solar energy.
Additionally, energy generated is not constant, a storage system for the power generated
will be designed to distribute and maintain a constant source of power at the
delivery/application point. Conventional wind energy system is not possible directly as
threshold of the energy available is very small hence, there is a need of Smart Grid
management system to collect these produced energy at micro level. The proposed system
is also expected to reduce glaring/shinning effect of the incoming vehicles lights on the
outgoing vehicles.
As the automobiles moves from highways/expressways, there is a creation of front and back
pressure column on both sides of the road. This pressure column is created due to
imbalance of high pressure/low pressure energy band created by the automobiles. Due to
this pressure band, wind flow and create pressure thrust. This wind pressure thrust depends
on different factors as follows:-
a) The intensity/frequency of the traffic
b) The size of the automobiles
c) The speed of the automobiles
d) Distance between the ESM System and vehicles
e) Angle of impact
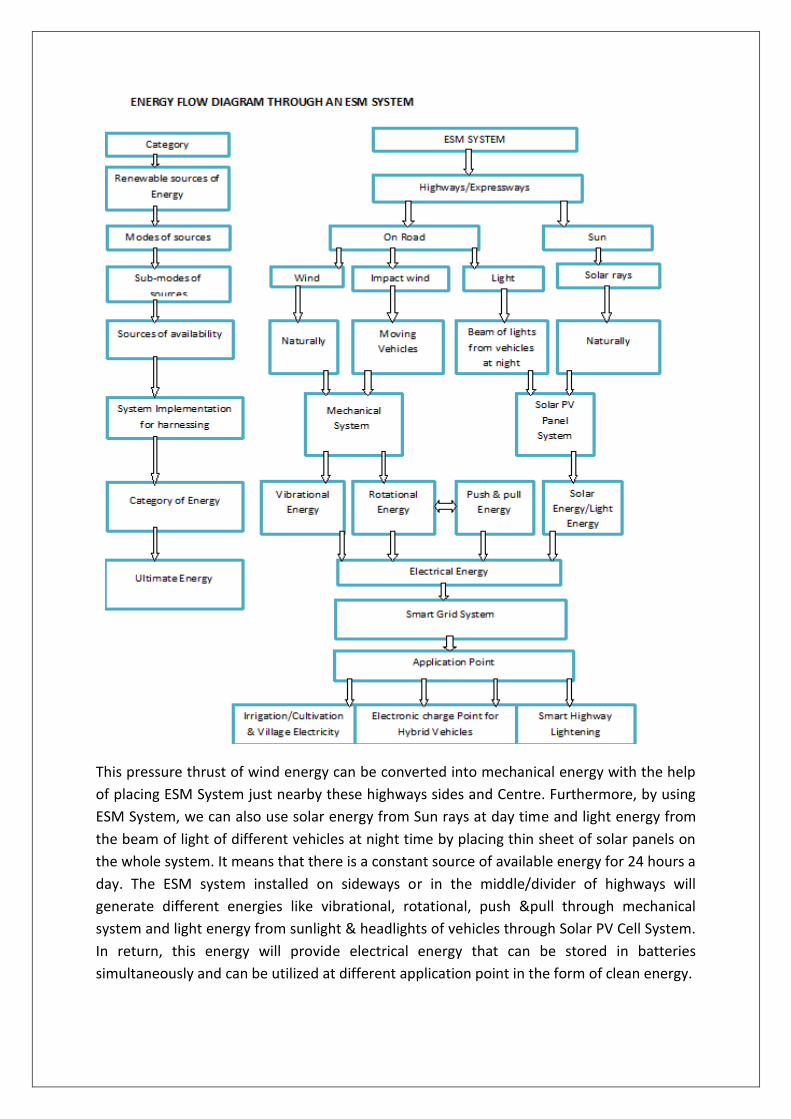
This pressure thrust of wind energy can be converted into mechanical energy with the help
of placing ESM System just nearby these highways sides and Centre. Furthermore, by using
ESM System, we can also use solar energy from Sun rays at day time and light energy from
the beam of light of different vehicles at night time by placing thin sheet of solar panels on
the whole system. It means that there is a constant source of available energy for 24 hours a
day. The ESM system installed on sideways or in the middle/divider of highways will
generate different energies like vibrational, rotational, push &pull through mechanical
system and light energy from sunlight & headlights of vehicles through Solar PV Cell System.
In return, this energy will provide electrical energy that can be stored in batteries
simultaneously and can be utilized at different application point in the form of clean energy.

WORKING PRINCIPLE
A.)Capturing Impact wind pressure induced by moving vehicles and natural wind.
The moving vehicles may be of all types of light or heavy vehicles running on road such as
two, three, four wheelers or even bigger vehicles. The moving vehicles could be railway train
running on railway track. The vehicles could also be aircraft moving on the runway. These
induce fast winds in all direction of propagation. When the moving vehicle passes through
the ESM System, then two types of pressure is induced in the ESM System. One is front
pressure and the other one is back pressure. The pressure induced strikes the different sub-
system of an ESM System, which results as follows:-
1. Vibrational Energy 2. Rotational Energy 3. Push & pull Energy
1) Vibrational Energy:-When the pressure induced strikes the vibrational sub-system, the
wind pressure stimulates the flexible belt (magnets are fixed at the end points) for the to &
fro motion or to move in the diametric direction of the circular cup (proper insulated
copper winding is done around the circumference)present at top and bottom of the system.
2) Rotational Energy:-The pressure induced strikes the curved fins of the rotational sub-
system of ESM, this results in rotation of fins about an axis of the hollow cylinder(central
axis of ESM).Inside the hollow cylinder, a proper power generating system is developed by
using motors and gear arrangement.
3) Push& pull Energy:-when the wind pressure strikes the rectangular/square flat plate,
then the flat plate goes inside the box (Coiling of copper and magnets is done inside the
box). After releasing the energy, it is forced to its initial position by a spring system inside
the box. This push and pull motion of the plate leads to the generation of power.
B) Capturing Solar Energy from Sun & Light Energy from beam of lights of vehicles.
Different designs of solar panels with different inclination angle will be installed on the top-
most part of an ESM; we will generate power by using solar panels at daytime. Addition to
this, we will capture the energy emitted by light energy from the beam of light coming from
the vehicles at night time by using more sensitive solar sheet that is placed throughout the
fins, which will generate little amount of power but effective.
DIAGRAMS OF ESM SYSTEM

ESM SYSTEM ON HIGHWAY
DATA
Our experimental investigation/analysis is still in the process, but we have done a practical
experiment by using a partial ESM set-up to measure the front and back pressure induced
on the ESM System. Following is the data profile
SL NO
TYPES OF VEHICLES DISTANCE in ft. INDUCED PRESSURE in gm.
INDUCED PRESSURE in N
1. Light motor vehicles(LMV)[4-wheeler]
4 to 5 30 to 70 0.3 to 0.7
2. Mini-truck[4-wheeler] 4 to 6 100 1
3. Heavy vehicles[6-wheeler] 7 to 8 150 1.5
4. Heavy vehicles[10-wheeler] 7 to 8 200 2
5. Heavy vehicles[14-wheeler] 7 to 8 250 2.5
The design can be used in any city around the world. It should be environmentally friendly. Labels in various languages and manuals will be provided for each specific city. Figure 2 as below shows a dramatic increase in the employment of wind energy. Wind power increased by nearly 20% in 2012 reaching a new peak of 282 GW. Various sources such as the Global Wind Energy Council show China as the leading country in the employment of wind energy.

ADVANTAGES
The energy produced is environmentally pollution free and does not cause any harm to environment.
Till now the energy which was waste, can be utilized in developmental work.
The flat thin sheet will intercept the focusing light coming from the oncoming Vehicles on the highway.
Accident that occurs regularly on the highways due to glaring of light from the oncoming vehicles will get to nil.
Not harmful for living beings.
Can be used for the highway lightning.
Can be used to develop nearby villages and make it prosperous.
Can be used to maintain a biodiversity, wild life sanctuary or national park.
There is no damage to birds and animals.
Installation and maintenance charge is no too much high.

COST ESTIMATION AND PROJECT TIMELINE
CONCLUSION Wind has a lot of potential in it and if properly harnessed then it can help solve the energy crisis in the world. The study of ESM System and its characteristics showed that how it can be properly designed and used to get the maximum output. The power electronic circuitries have helped the concept of wind power a lot. Without them this concept would have been too expensive and farfetched.
S.N ACTIVITY COST in Rs NO.OF DAYS FINAL DATE
1 Literature Survey ------- Completed
2 Brainstorming and
Concept development
------- Completed
3 Prototype
development
25,000 15 Completed
4 Testing of Component 1,500 5 Ongoing
5 Refinement of
Prototype
5,000 20 20th
November
6 Development of
alternate arrangement
and design
5,000 20 10th
December
7 Testing of Prototype 10,000 20 31st
December
8 Smart Grid System 20,000 10 10th
January
9 Development of Final
Prototype
40,000 10 20th January
10 Testing and Analysis 5,000 10 30th January
Total Rs 1,11,500 110 Days

15. SMART WHEELS
COLLEGE: S D M COLLEGE OF ENGINEERING AND TECHNOLOGY, DHARWAD
GUIDE: SUNIL KUMAR S HONNUNGAR
COLLEGE STUDENTS: NIHAL REVANKAR, RADHAKRISHNA AEKBOTE
SCHOOL STUDENTS: VIKAS KULKARNI 9TH std, VINAY D MELAVANKI 9TH std, BASSEL MISSION SCHOOL.
INTRODUCTION
Now-a-days we are facing lot of energy crisis. The hunt for renewable sources of energy is
everywhere. People are finding ways to overcome this problem. Due to upcoming depletion
of fossil fuels, the Mother Nature has made us to think about the alternative sources of
energy.
Smart wheels, the name gives an idea about a vehicle which is different from other. That’s
right; this idea has been generated by considering the future perspective. As innovation
leads to evolution, this idea is somewhat related to that.
PROJECT DESCRIPTION:
Our idea is a conceptual one. The project consists of a normal bus fitted with a wind turbine
on top of it. This wind turbine along with a rotor is coupled to a generator or a dynamo. The
generator in turn is connected to the batteries which stores the energy produced. The top of
the bus is designed in such a way that the air converges into the turbine. Normally, buses
move at an average speed of 50-60 km/hr, so the wind rushing towards the bus converges
into the duct giving the turbine a rotation. As the turbine rotates, the generator rotates
producing energy(Direct current).This energy is stored in batteries.
Based on the equation of continuity, Area * Velocity = constant
Hence, if area increases velocity decreases and vice versa. Thus the speed of the rotor that is
rpm depends on the area of cross section. Lesser the area, higher the velocity
The energy produced can be used to charge electric vehicles which in turn he will pay to the
bus owner. Thus, this might be a portable source of energy.
This is just a concept. It can be made better by design the bus and air ducts aerodynamically
such that it offers least resistance to the stream flow of the air and providing frictionless
bearings to the rotors.

16. SOLAR POWERED HOUSE & TRANSMITTING EXTRA POWER TO THE
GOVERNMENT MAINS
COLLEGE: GOVERNMENT ENGINEERING COLLEGE, HASSAN
GUIDE: PRAKASH M B
COLLEGE STUDENTS: MANASA C R, VEDAVATHI C M,SHILPA A, PRUTHVI RAJ B N
SCHOOL STUDENTS: PUNITH K N 9TH std, RAGHAVENDRA A 9TH std, GOVERNMENT BOYS SCHOOL, HASSAN.
ABSTRACT
In this project we are going to conduct experiment on solar power. We consider a solar powered house and extra generated power is transmitted to government mains. The solar panel absorbs the energy from sun; the battery is used to store the energy. In this project we use inverters to convert the dc power to ac. the ac signal is used in house and as well as the extra energy is transmitted to the government mains.
INTRODUCTION
Green energy includes solar energy, wind energy, tidal energy, hydro etc., which is widely used and developed in recent years. Especially, Taiwan, which possesses subtropical climate, is very suitable for the development of solar energy system.
Application of solar energy is more universal in daily now. In general, the solar power generation and solar illumination system are more popular for people. SOLAR energy is one of the renewable energy which is avail abundant from nature in order to use it efficiently we have come up with the project POWER PRODUCTION USING SOLAR.
DESCRIPTION
In this project solar energy is used to charge the battery. Sometimes solar panel will not provide enough voltage to charge battery due to insufficient sun light. So here a Buck Boost circuit is used to boost the voltage to required level. The boosted energy is used to charge

the battery, intern the inverter is connected to battery. There are two voltage dividers from solar panels and battery outputs respectively to measure voltage levels. The ADC is connected to the voltage dividers through microcontroller were the voltage levels are displayed on LCD. Here the micro controller is connected to the relay which operates when we will NOT use solar energy. The energy meter and opto coupler are also connected to the microcontroller .The relay will trigger the energy meter ,the option is made such a way that if we are not using this solar energy, The stored energy will be supplied back to MAINS , the energy meter will calculate how much energy is given back to MAINS.
The figure above shows how the connections are carried out. In figure it shows solar panel is used to convert solar energy into voltage. Voltage generated at panel output will depend on the intensity of solar light. As the solar light is unpredictable so the output at solar panel will vary. With this variation it is not possible to charge the battery so the output of panel is fed to Buck Boost block where this block will supply constant required voltage to battery.
COMPONENTS LIST
P89V51RD2
Buck Boost
Baterry-12V
Voltage divider
Solar Panel
ALCD
inverter
energy meter
bulb
optocoupler
SOFTWARES USED
1. Embedded C 2. Keil Compiler 3. Flash Magic
Circuit
Before wiring the LCD screen to your Arduino we suggest to solder a pin header strip to the 14 (or 16) pin count connector of the LCD screen, as you can see in the image above. To wire your LCD screen to your Arduino, connect the following pins:
LCD RS pin to digital pin 12 LCD Enable pin to digital pin 11 LCD D4 pin to digital pin 5 LCD D5 pin to digital pin 4 LCD D6 pin to digital pin 3 LCD D7 pin to digital pin 2
Additionally, wire a 10K pot to +5V and GND, with it's wiper (output) to LCD screens VO pin (pin3).

Fig1.4: Image developed using Fritzing
Fig1.5: Interfacing of alcd display
Energy meter
An electricity meter or energy meter is a device that measures the amount of electric energy consumed by a residence, business, or an electrically powered device. Electricity meters are typically calibrated in billing units, the most common one being the kilowatt hour [kWh]. Periodic readings of electric meters establish billing cycles and energy used during a cycle.
In settings when energy savings during certain periods are desired, meters may measure demand, the maximum use of power in some interval. "Time of day" metering allows electric rates to be changed during a day, to record usage during peak high-cost periods and off-peak, lower-cost, periods. Also, in some areas meters have relays for demand response load shedding during peak load periods.
Philips P89V51RD2 Microcontroller
We are using Philips P89V51RD2 as 8051 Microcontroller Unit (MCU). And I have been developing my code with Open source C Compiler SDCC. Please visit my Tools page for software preparation guides.
The P89V51RD2 is a 80C51 microcontroller with 64 kB Flash and 1024 bytes of data RAM. A key feature of the P89V51RD2 is its X2 mode option. The design engineer can choose to run

the application with the conventional 80C51 clock rate (12 clocks per machine cycle) or select the X2 mode (6 clocks per machine cycle) to achieve twice the throughput at the same clock frequency. Another way to benefit from this feature is to keep the same performance by reducing the clock frequency by half, thus dramatically reducing the EMI.
The Flash program memory supports both parallel programming and in serial In-System Programming (ISP). Parallel programming mode offers gang-programming at high speed, reducing programming costs and time to market. ISP allows a device to be reprogrammed in the end product under software control. The capability to field/update the application firmware makes a wide range of applications possible.
APPLICATIONS
Utilization of the solar energy is more efficient.
Can be implemented in houses
ADVANTAGES
Efficient use of natural resources.
Other resources of energy can conserve.
Energy can be sold to GOVEMENT & Pollution can be minimized.
CONCLUSION
From this project utilization of the solar energy is more efficient. Other resources of energy can conserve. It also reduces the cost and utilization of electrical energy. Application of solar energy is more universal in daily now. In general, the solar power generation and solar illumination system are more popular for people for this reason the project is widely used in future.
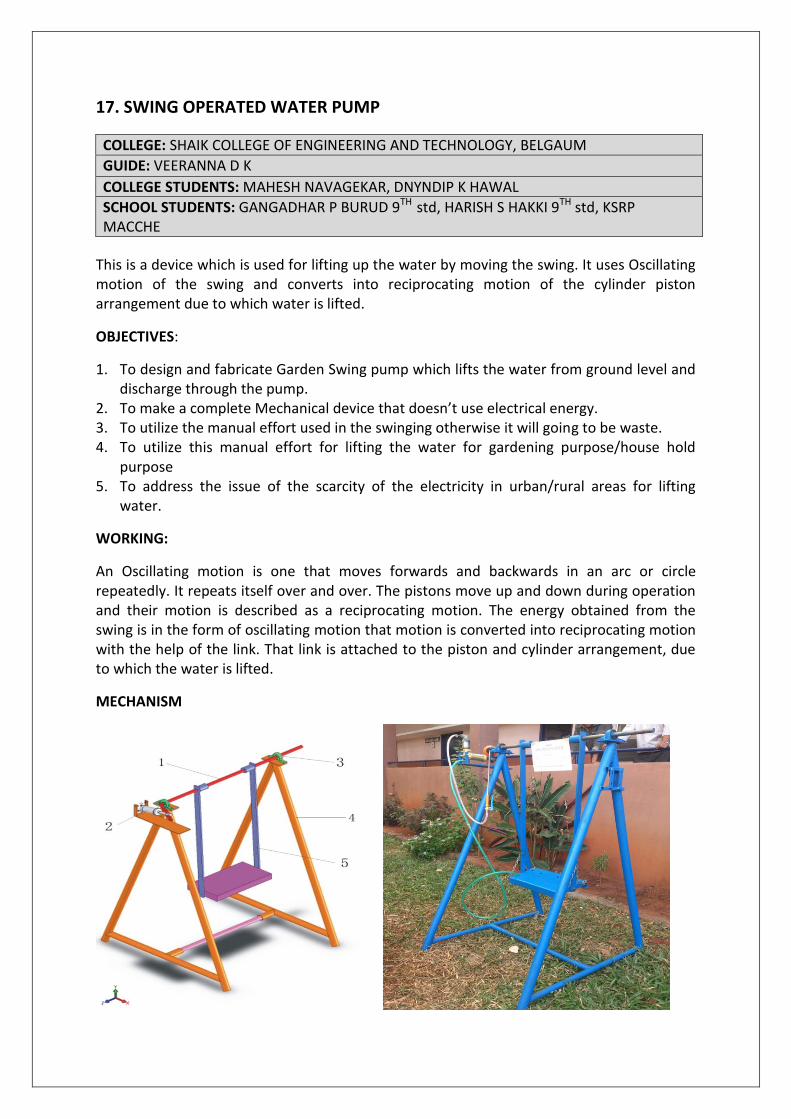
17. SWING OPERATED WATER PUMP
COLLEGE: SHAIK COLLEGE OF ENGINEERING AND TECHNOLOGY, BELGAUM
GUIDE: VEERANNA D K
COLLEGE STUDENTS: MAHESH NAVAGEKAR, DNYNDIP K HAWAL
SCHOOL STUDENTS: GANGADHAR P BURUD 9TH std, HARISH S HAKKI 9TH std, KSRP MACCHE
This is a device which is used for lifting up the water by moving the swing. It uses Oscillating motion of the swing and converts into reciprocating motion of the cylinder piston arrangement due to which water is lifted.
OBJECTIVES:
1. To design and fabricate Garden Swing pump which lifts the water from ground level and discharge through the pump.
2. To make a complete Mechanical device that doesn’t use electrical energy. 3. To utilize the manual effort used in the swinging otherwise it will going to be waste. 4. To utilize this manual effort for lifting the water for gardening purpose/house hold
purpose 5. To address the issue of the scarcity of the electricity in urban/rural areas for lifting
water.
WORKING:
An Oscillating motion is one that moves forwards and backwards in an arc or circle repeatedly. It repeats itself over and over. The pistons move up and down during operation and their motion is described as a reciprocating motion. The energy obtained from the swing is in the form of oscillating motion that motion is converted into reciprocating motion with the help of the link. That link is attached to the piston and cylinder arrangement, due to which the water is lifted.
MECHANISM

1. Shaft 2. Pump 3. Bearings (Plumber Block) 4. Frame 5. Swing Links
ADVANTAGES:
Easy in operation, Low cost, Simple construction, Adaptable
Environmental friendly
Can also generate power
Effortless supply of water
Easy maintenance
Kid’s energy is utilized to run the pump
No operators required
Pump can be used in, especially when electricity is not available

18. TRANSFORMER FAULT DETECTION FOR OVERTEMPERATURE NO OIL AND
OVER CURRENT WITH GSM
COLLEGE: SMT KAMALA AND VENKAPPA M AGADI COLLEGE OF ENGINEERING AND TECHNOLOGY, LAKSHMISHWAR
GUIDE: SHIVARAJ HIREMATH
COLLEGE STUDENTS: SHREYA S TANDUR, RAVI CHANDRA GOWDA
SCHOOL STUDENTS: ARVIND REDDY 9TH std, INDRAJITH 9TH std, UMA VIDYALAYA, LAKSHMISHWAR
INTRODUCTION The modern electrical distribution system requires lot of automation for the proper and safe distribution. The existing method of distribution suffers from problems like indicating the particular transformer fault is possible only after a lot of delay or after some observation and power cut off will takes place unless the transformer gets ready. The system shown below solves the problem with a real time indication of the transformer problems by using sensors.

Depending upon the sensing action immediate actions are taken to avoid damage to transformers.
The signal is sent to control room and here we are using a GSM technique interfaced with 8051 controller. When the power is cut due to faults in transformer1 then load sharing is done, Thus from the control room they send the signal to microcontroller to switch for transformer 2 for time being unless the transformer 1 is ready.
The signals from all the sensors are fed to microcontroller which is inbuilt 4K flash memory (89C51) the predefined text messages are stored in internal memory and each message is representation of the particular abnormality. When any of the sensor gets activated this data reads through controller port and push the stack pointer to fetch the text message and send serially from serial port with RS232 interface with GSM modem. With the help of AT commands the text message now sends to the engineer mobile unit and control room mobile unit.
As soon as the message appears in user mobile depending upon need user can send a coded message from his mobile to a SIM number where this is fixed in the GSM modem itself. Once the message which is picked up and further this will be interfaced with RS 232 port of modem to serial port of the microcontroller. The communication build up with the modem is through a AT commands with microcontroller and the message has been decoded and with general I/O ports of microcontroller interfaced to electromagnetic relays (switching unit) to enable disable the process or particular parameter or to switch from one transformer to other to prevent further accidents and provide load sharing.
This unit provides the full user and the transformer faults and microcontroller interaction with GSM technique so a higher end security can be achieved. The transformer may suffer with problems because of excess temp, over load with excess current or because of no oil or less oil reasons. The sensors which are connected sense the parameter and indicate in the panel. The temperature increase in the windings of the transformers is with so many reasons the input excess voltage may lead to increase the temp. The temp variation can be sensed by the thermistor or LM 35 integrated sensor which converts the temp variation in to resistance variations and further this converts in to potential difference (voltage). The voltage now compare with standard values (reference voltage) which are consider as standard values or safe temp values. As the temp variation takes place the circuit breaker stops the further working of transformer and prevents the further damages to the transformer. To indicate the status of the transformer controller is pre-defined with particular message of transformer. Message data from one transformer to other is not

same. Data is now passed through GSM, thus the control room mobile unit and engineer mobile unit get the message about the faults and they can take immediate further action and also load sharing signal will be send from their mobile if the power cut has occurred in particular area.
The controller used here is 89c51 which is having inbuilt 4k of ROM, the message data is stored in the ROM the programme execute the particular data as per the i/p means the data is different for different transformers so every time any of the transformer fault will indicates with the different name and number, the data is sent through GSM and the message is displayed to particular authorised person in his mobile unit.
For the sensing of oil level in the transformer can be possible with contact type sensor which goes to detects the level of the oil and also indicate the leakage conditions also. The copper conducting probe detects the level of the oil by providing the number of sensors at different intervals. When the oil level falls below the safe limit the circuit breaker stops the functioning of the transformers and prevents the damages to the transformer. Further the same process takes place as of for temp and in the control room the particular transformer details has been displayed. The particular fault has been indicated in the panel.
The over current can be detected with transistorised circuit which goes to detect the excess current flow. As the transistor base circuit detects the excess current the circuit breaker breaks and stop the working of transformer which prevents the damages. And of the procedure of sending the coding towards the control room. As the temperature of the oil varies that is exceed the limit then automatically cooling fan turns on to avoid the further damage to the transformer. The supply for the cooling fan is taken from the battery; the electric energy stored in the battery is from solar panel. We are using here the solar panels which generate a electrical energy from natural resources like solar light. The energy generated from solar panel cannot be used directly to drive the motor, the energy has to be stored in the battery and then used. The solar panel is connected to the charge control unit in which the o/p DC voltage is flows in one direction for the purpose of charging the battery. It is also possible that the required amount of the voltage can be detected through this circuit and then connects to the battery. The battery used here is either a lead acid type or maintenance free sealed lead acid battery or even a tubular battery can also be possible to use.
To get the maximum peak power o/p from the battery it is essential that the panel has to get a direct interaction angle with sun tracking. In the oldest method getting power from solar panel is , it is fixed on some angle but as the sun tracking takes place the panel won’t receive the maximum radiation from the sun so the power available from the panel is not at maximum at all the time. The method what we used here is a solution for that in which the panel goes to track as per the sun direction. The sensing method used here is for the detection of direction of the sun and here we are using the LDR or photodiode as light detectors which going to detect the sun light. The motor driving circuit drives the motor in such a way that the panel which is placed on the motor platform goes track with particular angle. The angle of the tracking with the help pulse generator circuit which controls the action of the motor. The tracking angle is indirectly decides the tracking of sun only. The user interaction switches are useful for the purpose of fixing angle at one end without tracking.

Relay is an electromechanical switch & it works on the principle of energizing an electromagnet. It consists of primary coil, 2 contacts one is normally open contact “NO” & the other is normally closed contact “NC”& pole normally identified a common. The input for the relay coil can be connected to the required DC coil energizing voltage from its COM, N/O and N/C terminal any device of any voltage can be connected for switching actions. The relays are acting as switching device depending upon the signal sent by microcontroller either to switch to transformer 1 or transformer 2.
Applications/Advantages of proposed system
Transformers can be operating always in safe condition.
Suitable for electric grid transmission.
Suitable for industrial distribution system.
The method of sensing parameter is through sensors because of this accuracy can be achieved
Immediate repair and alert can be possible.
Losses can be avoided.
The user gets a perfect interaction between sensors so a higher
End security is achieved
The GSM modem works on messaging technique so the cost is very less
The sensing system is through electronic method so the Accuracy is more
Because of using solar there is running Cost
Load sharing is done
Cooling fan is used for over temperature of oil.

19. VIDYUTH VIA JALANALAM
COLLEGE: JAWAHARLAL NEHRU NATIONAL COLLEGE OF NAVULE, SHIMOGA
GUIDE: DR MANJUNATHA P
COLLEGE STUDENTS: T PAWANDAS, SACHIN GUJJAR U, PRASHANTH KUMAR U S, VINAY D S.
SCHOOL STUDENTS: NIKHIL KUMAR S 9TH std, MOHAN KUMAR H P 9TH std, DVS COMPOSITE PU COLLEGE.
ABSTRACT:
Energy is one of the main needs of the society which makes human life easy. It may be in
any form- electrical energy, fuel energy, wind energy etc. It has been used in various fields
to serve the respective purposes. But presently we are facing one of the major problems
called as Energy crisis. Research has shown that energy crisis is not due to non-availability of
energy but due to inefficient use of it and improper methods used to harness it. It is
possible to decrease this crisis by utilizing the energy efficiently. One of the possible
solutions regarding this is- ‘Utilization of energy in many ways’ which is proposed here.
Except very few people, all have water tap in their houses. The water coming out of tap will
be coming forcefully. Hence it will be having kinetic energy. This energy is just wasted
without any useful work. So we had a question ‘Why can’t we store this energy and use that
later to serve for any other purpose?’
METHODOLOGY:
Our system mainly consists of a mini-portable turbine, a motor, a rechargeable battery and
accessories. Using all we have built a mini- product which can be fitted to tap. The water
coming out of tap will pass through this system comprising of mini-turbine which is
interconnected to shaft of the electric motor. Water impinges on rotor blades which makes
turbine to rotate and hence generates the current. The electrical energy produced is then
stored in the battery. In the later stage this can be used to charge our mobiles or power the
LED flashlights which are the further extension of this project.
CONCLUSION:
The system works on the principle of “Law of conservation of energy” and converts the
kinetic energy of water to electrical energy. Using this system we can produce the electricity
without any extra investment. So this will be very useful for village peoples and also for
cities where power cut is a frequent problem.

Fig1. Front View
Fig2. Back View
20. WIND TURBINE ANALYSIS
COLLEGE: H M S INSTITUTE OF TECHNOLOGY, KYATHASANDRA, TUMKUR.
GUIDE: DR. VIJAYA VITTALA C B
COLLEGE STUDENTS: SURENDRA SAPKOTA, SYED NEYAZ IMAM.
SCHOOL STUDENTS: MOHAMMED SALHUDDIN 8TH std, SYED ARBAZ, 9TH std H M S HIGH SCHOOL.
ABSTRACT
The blade profiles and the arrangement of blades play an important role in wind turbine efficiency. In the present research work, four different blades profiles namely DNA shape, Concave & convex shape, rectangular shape and helical shape etc. will be studied under low wind velocities. The models will be prepared by using locally available materials and their performance studies will be studied under the above mentioned condition. The same profiles will be used to study the generation of electrical energy by using wind shafts, produced by the impact of wind due to the moving vehicles on the highways/expressways.
INTRODUCTION
In this study, blades profiles namely DNA shape, concave & convex shape, rectangular shape and helical shape etc. are studied with respect to the available wind pressure energy in the highway/expressway. The effect of number of blades and the shape and the output of the energy will be studied. The experimental set-up will be fabricated on which blades profiles can be changed and is placed near the road or highways/expressways. By using the instrument anemometer, we can measure the available wind velocity at different depth and width of the road and blades profiles.
TYPE OF BLADES
The setup, which we are testing by placing different blades on works on the principle of vertical axis wind turbine. Vertical axis wind turbine is a type of wind turbine where the main rotor shaft is set vertically and the required components are located at the base of the turbine. This type of wind turbine rotates about an axis that is perpendicular to the oncoming wind flow; hence, it can take wind from any direction.
SETUP
The experimental set-up will be fabricated on which blades profiles can be changed and is placed near the road or highways/expressways. Construction is based on a rotating drum mounted on a vertical axis. The turbine uses blades in a cylindrical array. As the wind speed increases centrifugal forces act on inside of the blades and force them to swing to the outside. The weight on the central axis is holding all the blades. With increasing wind speed, the weight will be lifted and eventually close the turbine to a complete cylinder.
ANALYSIS OF BLADE
There are different types of blades which are used in the wind turbine. Various types of blade give different rotation of rotor to their contact of area of wind. Here we are analysing

different shape of blades in our project that which type of blade is suitable for low wind velocity stream.
Number of blades
If there are more then 3 blade,each blade disturb the air for the following blade.Three blades give a good balance, not too much air disturbance for the following blade. Also three blades provide a natural balance and it is less noisy then other. Here we are analyzing in this project for various number of blade. ANALYSIS OF BLADE PROFILE

With the help of anemometer, here we are analyzing for different blade profile. General layout of blade profile
1) Blade having 8 wings with half cut section at some angle
Placing of meter Distance
Straight(parallel to blade)
Parallel to the rotor shaft(left)
Parallel to the rotor shaft(right)
Slope at 45 (left)
Slope at 45 (right)
10 cm .797m/s 1.849 m/s 2.265 m/s 0.373 m/s 0.239 m/s
20 cm .165 m/s 1.123 m/s 1.077 m/s 0 m/s 0 m/s
30 cm 0 m/s .507 m/s .229 m/s
40 cm .374 m/s 0.009 m/s
50 cm .285 m/s 0 m/s
60 cm 0 m/s
2) Blade having 12 wings
Placing of meter Distance
Straight(parallel to blade)
Parallel to the rotor shaft(left)
Parallel to the rotor shaft(right)
Slope at 45 (left)
Slope at 45 (right)
10 cm .644m/s 1.479 m/s 1.234 m/s 0.122 m/s 0.109m/s
20 cm 0 m/s 0.746 m/s .727 m/s 0 m/s 0 m/s
30 cm 0.346m/s 0 m/s
40 cm 0 m/s
50 cm
60 cm

3) Blade having 3 wings with DNA shape
Placing of meter Distance
Straight(parallel to blade)
Parallel to the rotor shaft(left)
Parallel to the rotor shaft(right)
Slope at 45 (left)
Slope at 45 (right)
10 cm 2.187m/s 0 m/s 0m/s 0.512 m/s 0.430 m/s
20 cm 2.091m/s 0 m/s 0 m/s
30 cm 1.721 m/s
40 cm 1.350 m/s
50 cm 1.201 m/s
60 cm 0.967 m/s
70 cm 0.800 m/s
80 cm 0.355 m/s
Some snap short of air profile analysis doing by student
Student them self-analyse different blade profile at different direction

Fig: different types of blade profile using for analysis RESULT Analysis of different blade profile shows different variation of wind speed. Here from the table we observe that the wind speed is achieve aggregate from the 8 wings half cut section. But when we use 12 wings blade, then it is lesser wind speed then 8 wings half cut section. Also in the 3 wings blade there is better wind speeding more than other .Thus we analysis that lesser wings are more effective then more wings blade. And also 3 wings blade are rotate at lesser wind stream also.

21. LITHIUM ION BATTERIES FROM PURPURIN
COLLEGE: BASAVESHWARA ENGINEERING COLLEGE, BAGALKOT.
GUIDE: DR BHARATHI S METI
COLLEGE STUDENTS: SHWETHA B PATIL, ANKITA S PURANIK.
SCHOOL STUDENTS: BHAGYASHREE B GADED 9TH std, SHREELAKSHMI KULKARNI 9TH std, ST. ANNE`S CONVENT HIGH SCHOOL, BAGALKOT.
INTRODUCTION:
Lithium ion batteries are in high demand. They are used in mobile phones and now in electric cars. Currently, lithium ion batteries require the mining of metal ores such as cobalt. However, mining the cobalt and combining it with the lithium at high temperature to form cathode is an expensive and energy intensive process.
Purpurin is a dye that is found in roots of plants such as Rubia tinctorum(madder plant), Rubia cordifolia. It is chemically known as 1,2,4-trihydroxyantraquinone. It offers great potential as a more environmentally friendly alternative.
a)1,2,4-trihydroxyantraquinone b) Madder plant
OBJECTIVES:
To extract purpurin from the plant.
To quantify the purpurin.
To use the purpurin in cathode electrode preparation.
METHODS:
Extraction of purpurin:
Powdered roots of madder plant are mixed with the 40 times as much as water. It is boiled
till the water gets evaporated. This is filtered while hot to obtain the extracted stuff.
Extracts were left till the temperature had dropped sufficiently and then filtered through
filter paper.
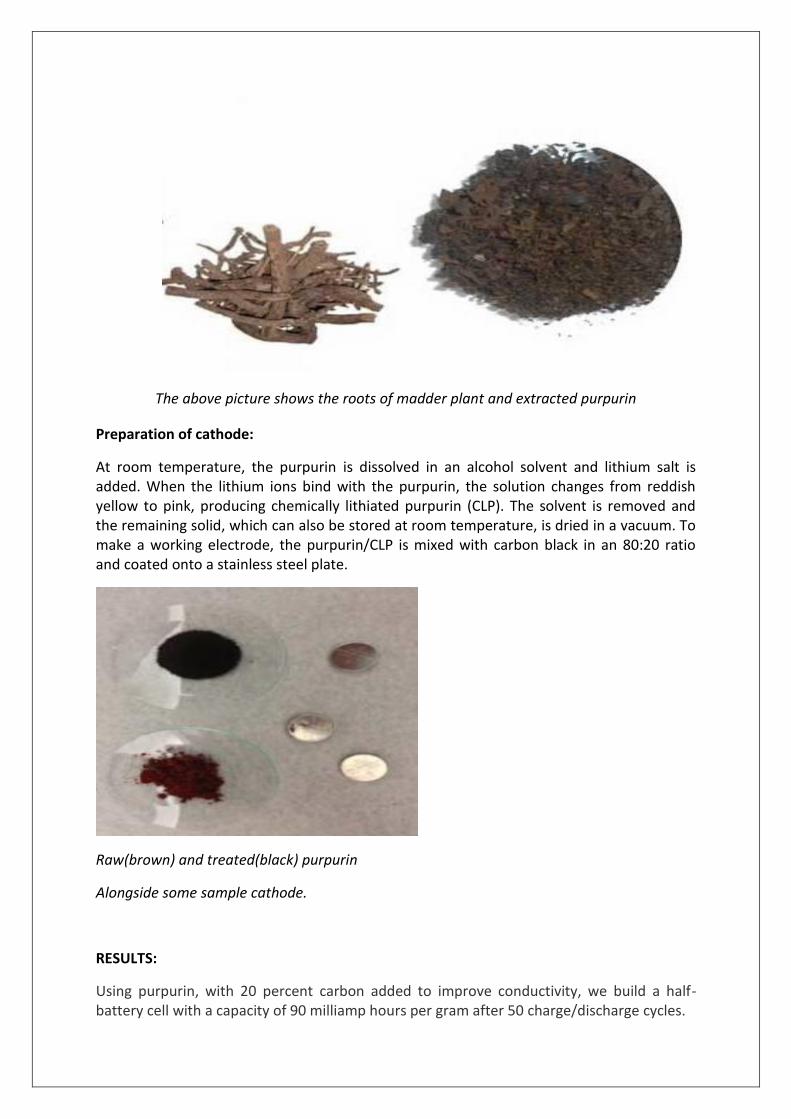
The above picture shows the roots of madder plant and extracted purpurin
Preparation of cathode:
At room temperature, the purpurin is dissolved in an alcohol solvent and lithium salt is added. When the lithium ions bind with the purpurin, the solution changes from reddish yellow to pink, producing chemically lithiated purpurin (CLP). The solvent is removed and the remaining solid, which can also be stored at room temperature, is dried in a vacuum. To make a working electrode, the purpurin/CLP is mixed with carbon black in an 80:20 ratio and coated onto a stainless steel plate.
Raw(brown) and treated(black) purpurin
Alongside some sample cathode.
RESULTS:
Using purpurin, with 20 percent carbon added to improve conductivity, we build a half-battery cell with a capacity of 90 milliamp hours per gram after 50 charge/discharge cycles.

ADVANTAGES:
The resulting batteries would also be non-toxic, making them easier to dispose of.
These are environmentally friendly.
These are not much expensive than lithium cobalt batteries.
These can be manufactured at room temperature whereas lithium cobalt batteries require high temperature environment.
SUMMARY:
We can estimate that a commercial green lithium ion battery may be only a few years away counting the time needed to ramp up purpurin’s efficiency or hunt down and synthesize similar molecules.
Agriculture waste may be a source of purpurin as may other suitable molecules which make the process even more economical.

22. TALKING ENERGY METER
COLLEGE: JAWAHARLAL NEHRU NATIONAL COLLEGE OF NAVULE, SHIMOGA
GUIDE: CHANDRASHEKARA S
COLLEGE STUDENTS: PREMKUMAR B N, MADHU H R, NAGARAJA RAO B G.
SCHOOL STUDENTS: SRITULASI P, SRINATH REDDY, BGS CENTRAL SCHOOL, BHADRAVATHI, SHIMOGA.
INTRODUCTION: The purpose of this project is to build a KWH (Kilo Watt Hour) meter that can alert the users with voice messages. An Energy meter or KWH meter is a device that measures the amount of electrical energy supplied to or produced by a residence, business or machine. Electricity is a clean, convenient way to deliver energy. The electricity meter is how electricity providers measure billable services. The most common type of meter measures kilowatt-hours. When used in electricity retailing, the utilities record the values measured by these meters to generate an invoice for the electricity. They may also record other variables including the time when the electricity was used. The idea behind this project is to construct the Energy Meter that is useful for illiterates and the busy people who cannot concentrate on the energy meter readings because of their busy schedule. This system helps the users by alerting them about the peak loads (max energy consumption), power status (ON/OFF), billing status etc. The voice alerts could be in any local language. Hence this system can be used across the world. The typical voice alerts are “Over load”, “Pay electricity bill”, “Turn off the lights” etc. This system also consists of a LCD display that continuously displays the energy meter readings in real-time. This consists of Real-time clock for calculating the average, max and minimum readings with respect to time. This information is display on a LCD display. This can be achieved by the use of microcontroller unit that continuously monitors and records the Energy Meter readings in its permanent (non-volatile EEPROM) memory location. Microcontroller also drives the voice module to play the voice messages based on the energy meter readings. This system also implemented for a single push button based load control for turning ON or OFF the loads. The major building blocks of this project are: 1. Microcontroller based control system with regulated power supply. 2. Voice Module for storing and playback of messages. 3. LCD display to display the Energy meter readings. 4. Real-time clock for display of time. 5. Digital Energy Meter.

6. Electromagnetic Relay to disconnect the power supply with single push button. 7. Relay driver. Advantages of talking energy meter:
This energy meter alerts the user in case of over usage of electricity.
Announces the power supply status. This is very useful for blind people too.
Announces about the bill payments.
This can be customized to any language. As we need to store the voice message before using this.
Very helpful for illiterate people. They can know the bill and meter reading-using announcement without taking help from literates.
Block Diagram:

23. GENERATION OF ELECTRICITY AND WASTE WATER TREATMENT USING
MICRO-ORGANISMS
COLLEGE: SHRIDEVI INSTITUTE OF ENGINEERING AND TECHNOLOGY, TUMKUR.
GUIDE: Dr. M GOVINDAPPA
COLLEGE STUDENTS: SHREYA VARGHESE, KUMAR PATEL, BENSON BABUDANIE
SCHOOL STUDENTS: SRUSHTI B R 9TH std, BHARATHI M 9TH std; SHRIDEVI VIDYA MANDIRA, TUMKUR.
ABSTRACT:
Microbial Fuel Cell (MFC) is a device that can use bacteria as catalyst for converting chemical energy into electrical energy. Presently, we used four different bacterial species in generation of power, in that the Agrobacterium tumafaciens showed highest current, voltage and power compared to other bacteria, followed by E. coli, Pseudomonas syringae and Xanthomonas oryzae.In our present work, we generated power of 0.4W and treatment of urban wastewater by reducing COD and BOD. By using suitable amplifier and inverter design, we have used generated power to operate LED’s, CFL’s.
INTRODUCTION:
Energy is the prime indicator of economic growth and is vital substance of a modern economy.
Further economy growth depends on the long term availability of energy from sources which are affordable, accessible and environmental friendly.
World total power supply is 11,741Mtoe (million tons of oil equivalent) and India contributes to 4.8% (i.e. 565.43Mtoe) of world’s supply.
Energy at peak and annual demand in Karnataka is as shown in Table-1
Table 1: Energy crisis in Karnataka
(Source: 16th Annual Power Survey, CEA)
Karnataka needs gross power of 7,784 MW, but maximum demand met was 5,811 MW per month.
To generate 440MW of power 3,500 crores of Rupees is required to construct new power plant in Western Ghats of Karnataka. For this purpose, around 1900 acres of land needs to be destroyed (Vijay Karnataka, 2009).
Year 2006-07 2011-12 2016-17
Peak Demand (MW) 7,740 10,460 14,071
Annual Energy Requirement (MW) 44,748 60,478 81,354

As electrical engineers, we have to think to generate power by using different waste, like wood, food; plastic etc. Among all these wastes, urban wastewater is more abundant.
In the present investigation, we have used Microbial Fuel Cell (MFC) to generate electricity from wastewater; apart from reducing COD (Chemical Oxygen Demand) and BOD (Biological Oxygen Demand) level of wastewater.
MFC (Fig 1) is a device that converts chemical energy to electrical energy by the catalytic reaction of microorganisms.
Fig 1 - Schematic diagram of Microbial Fuel Cell (MFC)
1. Salt bridge
2. Electrolytic solution
3. Bacteria with wastewater
4. Graphite rod
OBJECTIVE:
Power generation by utilizing wastewater (urban wastewater) by MFC.
Water treatment to reduce COD and BOD level.
Generate power for LED’s and CFL’s.
MATERIALS AND METHODS:
MFC consists of two chambers (anode and cathode), electrodes, salt bridge (Agar) and multimeter.
Anode: wastewater from Wastewater Treatment Plant Tumkur, Karnataka India and bacteria, Cathode: electrolyte (KOH) solution.
Different bacterial species (Xanthomonas oryzae, Agrobacterium tumafecians, Pseudamons syringae and Escherichia coli) were collected from soil and plants.
Nutrient broth was prepared for bacterial culture and mass multiplication.
Individual bacterial species (30 ml) were inoculated to anode chamber of MFC and during lag initiation, the current generated was recorded using multimeter for every two hrs (upto 48 hrs).

Anodic Reaction: C12H22O11 + 13H2O 12C2 + 48H+ 48e-
Cathodic Reaction: O2 + 4e- + 4H+ 2H2O
RESULTS AND DISCUSSION:
Table 2 clearly indicates the comparison of earlier work.
We have generated 1.1volts from 200ml of wastewater using Agrobacterium tumafaciens, 0.65 volts from E. coli, 0.73 volts from Pseudomonas syringae and 0.144 volts from Xanthomonas oryzae.
After amplification, generated 11.8volts from Agrobacterium tumafaciens(Fig 8), 33.4mA of current from same bacteria (Fig 6) and 0.112W of power, using this we have glow LED.
All the bacteria significantly generated the power, the Agrobacterium tumafaciens showed highest current, voltage and power compared to other bacteria, followed by E. coli, Pseudomonas syringae and Xanthomonas oryzae.
Our MFC treated the wastewater by reducing COD and BOD up to 68% (9 to 10), shows the wastewater color before and after treatment of wastewater respectively.
Fig 2. Highest voltage from A. tumafaciens Fig 3. Current after amplification
Fig 4. LED glowing Fig 5. Voltage after amplification

Table. 2
Micro-organisms Voltage Author
Escherichia coli 0.39v M.Rahimnejad et al., (2009)
E coli 0.598v XI Mingyue et al., (2008)
E coli 0.06v Zhuwei et al., (2007)
Bacillius subtilis 0.64v Nevin Longnecker, et al.,
Pseudomonas methanica 0.55v Nevin Longnecker, et al
Proteus vulgaris 0.35v Nevin Longnecker, et al
Fig (6). Fig (7).
The below tabular column and graph shows current, voltage and power for four different micro-organisms.
Fig 8. Generation of voltage, current and power from E. coli bacteria at different interval of
time

Fig 9. Generation of voltage, current and power from Agrobacrium tumafaciens bacteria at different interval of time
Fig 10. Generation of voltage, current and power from Pseudomonas fluorescens bacteria at different interval of time
PS
0
1
2
3
4
5
6
7
8
0 4 8 12 16 20 24 28 32 36
Time
Vol
tage
,Cur
rent
,Pow
er
voltage
current
power

Fig 11. Generation of voltage, current and power from Pseudomonas fluorescens bacteria at different interval of time
CONCLUSION:
The used all different bacterial species are generated highest current as compared to other previous findings.
Microbial fuel cells were proven to be able to generate electricity directly from wastewater via naturally occurring microorganisms in the wastewater.
COD & BOD results indicate that MFC’s are potentially effective in treating wastewater.
FUTURE WORK:
Test and Characterization of different bacterial species to know their efficiency in generation of current.
Evaluation of COD, BOD and total hardness of the water in treated and untreated urban wastewater.
Circuit will design to increase voltage, current and converting DC to AC.
Charging Calculator, Mobil Phone and Serial set etc.
Alternative Power system to use in the village when Power Cuts for small scale use.
X.o
0
0.2
0.4
0.6
0.8
1
1.2
1.4
1.6
0 4 8 12 16 20 24 28 32 36
time
volta
ge,c
urre
nt,p
ower
voltage
current
power
power
24. PRODUCTION OF BIO ELECTRICITY FROM PAPER AND PULP INDUSTRIAL
WASTE
COLLEGE: SIR M VISHVESHWARAIAH INSTITUTE OF TECHNOLOGY,BANGALORE
GUIDE: DR.CHANDRASHEKAR NAIK
COLLEGE STUDENTS: ROOPA ASHWATH,APARNA SAHAJAN,NAVYALEKHA,REKHA
SCHOOL STUDENTS: HARSHITHA 9TH std, PUSHPALATHA 9TH std GOVERNMENT HIGH SCHOOL, HUNISEMARANAHALLI, BANGALORE.
ABSTRACT
Microbial fuel cell is a bio-electrochemical device that converts microbial metabolic energy into electricity by using conventional electrochemical technology. Bacteria when feeds on sugar acts as a catalyst for converting chemical energy into electrical energy by oxidation and reduction process. The microbial fuel cell consists of two chambers, having anode and cathode which act as electrodes. Anode is filled with paper industry waste and cathode with an electrolyte.
The Global paper production is 340 million tons, and India accounts for nearly 1.6% of the world’s consumption. About 39,000 tons of sulphite waste liquor is produced per annum in India. Experts opine that nearly 85% of water used (of the 70 cubic meters of water on an average consumed per day) in the paper and pulp industry results in released in the form of contaminated sludge and waste water, and needs onsite solutions and efficient treatment plants. This industry waste containing lignin, cellulose and other sugars can be effectively utilized by the microorganisms and the wastes may be degraded under aerobic and anaerobic conditions.
We intend to generate power by the degradation of this waste from paper and pulp industry, by developing consortium of microorganisms. Additionally the reduction in the Biological Oxygen Demand (BOD) and Chemical Oxygen Demand (COD) in the industrial waste is also proposed, which otherwise creates toxic components and causes environment hazards. Further, certain industrially important enzymes like celluloses may also be produced by this process as well. Interestingly, tweaking the protocols, this technology can be used to produce bio-ethanol too.
Though the presently achieved power output in conventional biofuel cell is just about 2W, this system can be modified for a continuous flow mode, to target higher power production. Augmented by a suitable amplifier and charge storage arrangement, the hope of the project would be to generate and maintain enough power output to make it potential for operating low power devices and home lighting purposes.
MATERIALS AND METHODS
Pseudomonas fluorescens, Escherichia coli, Agrobactrium tumafaciens were isolated from soil, mass multiplied anaerobically in nutrient broth for 24 hrs at 36+20C in a 100 conical flask. After the mass growth these were mixed with agricultural waste collected from various factories. A microbial fuel cell was setup using this mixture.

MFC Construction
A dual chambered MFC was designed and fabricated in the laboratory in aspiratory bottles (Borosil®; 100ml capacity). The bottles were joined by a glass bridge containing a salt bridge with KCl between the flattened ends of two glass tubes filled with rubber gaskets. Anode and cathode chambers were made both with graphite plates and kept at a distance of 8 cm in between. The anode chamber was filed with agricultural waste mixed with 30 ml of bacterial culture mixture individually and maintained in anaerobic conditions. Cathode chamber (aerobic chamber, where oxygen was used as the electron acceptor for the electrode) filled with KCl buffer, pH to 7 by 0.5 N NaOH. The cathode chamber was provided
with air that was passed through a 0.45 m pore size filters. All the experiments were carried out at a temperature 35+20 C. the current and voltage were measured with digital multi meter every 2hours.
CONCLUSION
Microbial fuel cells were proven to be able to generate electricity directly from agricultural waste via naturally occurring microorganisms in soil.

25. SHIPPING CONTAINER ECO-HOME-ENVIRONMENTAL & ECONOMICAL
BENEFITS
COLLEGE: BLDEA`S DR PG HALAKATTI COLLEGE OF ENGINEERING AND TECHNOLOGY, BIJAPUR
GUIDE: PROF. A S TANKSALI
COLLEGE STUDENTS: PAVAN NIMBAL, NAVEEN KATAVI, SUMIT BIDARI, DEEPESH RUNWAL
SCHOOL STUDENTS: BHAGYASHREE NIMBAL, ANAGA TANKSALI, B M PATIL PUBLIC SCHOOL, BIJAPUR.
INTRODUCTION
The prolonged summers, the minimal rain, the erratic increase in extinct (or vulnerable) spices of animals and plants and the rapid increase in global warming! All these strike to only one conclusion – the end of earth in near future – if measures are not taken.
As the sons of this planet, it appealed to us so much that we were determined to help the mother planet in the ways we can. We, as also being the future civil engineers, have thought of presenting this eco-friendly model in front of you. It concerns with the use of alternative (eco-friendly) materials instead of the conventional materials in buildings. The alternative materials used will definitely make a huge difference in environment, but (if used effectively) may make a huge difference in cost too!
The manual gives the details of the materials on which we are hoping on for a better, brighter and greener future.
OVERVIEW
We are presenting a model of Shipping container residential building scaled down to 1:30. In this
project, we are attempting to make this house as eco –friendly and sustainable as we can. We are
using environmentally less impactful materials as shown in pictures and also we will be calculating its
cost, carbon emissions, embodied energy in materials used in our project and compare them with
conventional building materials.
We are confident of getting positive results and also that this type of new concept building will be
more helpful to earth’s environment and also from economy aspect. The detailed calculations and
analysis will be done in further stages of project.
Though there are some practical difficulties in this type of construction as methods are new and
labourers are not used to such methods, but every new thing has some difficulties and we are sure
that this won’t stop development of new methodologies and new techniques can be adopted in a
very short period of time.
Some of the pictures of materials used in our project are as follows, technical calculations will be
done and added in later stages.

COMPONENTS
WALLS Conventional
materials
Alternative materials used
as part of project other than project
Bricks, stones, cement mortar Shipping containers Represented by
Recycled metals, certified wood, bamboos, rammed earth, straw bale, clay blocks, gypsum based wall
FLOORING Conventional
materials
Alternative materials used
as part of project other than project
Cement, vitrified tiles, marble, granite
Bamboo, Shahabad tiles Represented by
Cork, hard wood, marmoleum, wool carpet, recycled rubber, salvaged wood planks, linoleum

ROOF Conventional
materials
Alternative materials used
as part of project other than project
RCC Shipping containers, bamboo Represented by
Straw bale, living roof, slate tile
WINDOWS Conventional
materials
Alternative materials used
as part of project other than project
Aluminum, fiber glass, wood, mirrored glass, laminated glass, tinted glass
Argon glass Represented by
Fibrex, vinyl

FURNITURES Conventional
materials
Alternative materials used
as part of project other than project
Leather, hard plastic, artificial fabric, steel, wood
Bamboo, coir Represented by
Resin, natural latex, natural fabric
ELECTRICAL APPLIANCES Conventional
materials
Alternative materials used
as part of project other than project
Conventional bulbs and tubes, air conditioners, electrical water heaters
LED lights, natural ventilation, solar water heaters Represented by
CFL bulbs, optical fiber lighting, sensor controlled energy saving devices and installment of power management devices

PLUMBING Conventional
materials
Alternative materials used
as part of project other than project
Conventional showers, flushes Low water consuming components Represented by
Centralized plumbing, low flow faucets, water saving dual flush tanks
COMPARISION OF COSTS

Green homes do not have to cost more than conventional homes to construct, and if done wisely it can cost less. On average, a green home costs approximately 2 percent to 5 percent more than a conventionally built home, and at times 10 percent more when premium materials are used. However, when you compare your monthly utility bills with the cost of your green features from your mortgage payment, you can see the immediate savings. Also: The initial costs and operating costs can vary for innovative technologies. Costing and rating of materials are not effectively determined by the performance
during the entire life cycle. Energy efficient measures such as lighting and other passive systems are dependent on
site location. Additional time is required for crew to sort construction and demolition materials to be
recycled. The longer learning process for professionals could become a result from the lack of
available information on green building design, management, and technologies. Developers, architects, and other designers may be unaware of how to apply or keep up
to date with green technologies. Significant cost may be spent on the design and construction process, which includes
educating the public on relatively new green practices. Nation-wide rating systems do not give consideration to climactic and regional
difference, which may make it difficult to apply green initiatives. Cities that are trying to apply green building regulations can find resistance due to the
lack of public understanding of “green” issues.
SUMMARY CONVENTIONAL BUILDINGS:
Produce a third of the carbon dioxide emissions Have increased transportation, sprawl, cultural, and historical impact Generate waste during construction, operation and demolition processes Account for 60% of all the raw materials used in the U.S., and 40% of non-industrial solid
waste. Consume approximately 37% of the total global energy consumption, and 40% of raw
materials used globally. Use building materials that require an extensive infrastructure in order to extract,
process, and transport.
IF BUILT WITH ALTERNATIVE MATERIALS:
Reduces the impact of natural resource consumption and habitat destruction. Lowers utility costs. Applies more efficient operating costs through the entire life-cycle of the building. Improves risk management. Decreases vacancies and improves business retention. Enhances indoor environment through restrictions on toxic building chemicals and
materials.

Minimizes strain on infrastructure through effective land use management. Cost-effective material recovery through construction, operational, and demolition
recycling and reuse methods. Minimize the impact of extracting resources from distant regions and communities. Increase the availability of jobs that are related to the green building field, which may
include: maintenance, installation, and sustainability education and design careers. Utilize the materials, technologies, and service from business that are local.
CONCLUSION
Going through the listed details and the effect they have on our planet, we suggest that all the future buildings components and interiors should be built from alternative materials. This will help us reduce our carbon foot prints and contribute towards a greener planet.
We understand that there are few problems associated with use of alternative materials such as
A few alternative materials (like straw bale for roof for multistoried building) may not be viable.
And few materials may not be cost effective.
Taking into consideration of all the pros and cons, and the practical problems, we conclude the following:
Alternative building materials should be used as part of every future building, even if the cost of construction goes up by 2-5%. You will definitely save the cost in future.
Alternative building materials provide us an easy and guaranteed way of securing our environment and planet.
Alternative building materials are visibly better than the conventional materials in terms of the impact they have on environment.
A few other steps (for example, use of natural ventilation as highlighted in the project model) will help the cause a great deal.
We assure that we will try our best to work towards the contribution of greener planet. With better future planet for your children and the reduced cost of construction, we hope that you too will agree with us, won’t you??

26. A NOVEL APPROACH TOWARDS TRACKING, CHECKING FUEL PILFRAGE &
FUEL LEVEL MONITORING FOR RENTED VEHICLES AND FLEET MANAGEMENT
COLLEGE: SHRIDEVI INSTITUTE OF ENGINEERING AND TECHNOLOGY, TUMKUR
GUIDE: ASHA R
COLLEGE STUDENTS: DIVYASHREE R, RAMYA G V, RAMYA T R
SCHOOL STUDENTS: MADHU H 9TH std, MADHU KUMAR S 9TH std; KALIDASA HIGH SCHOOL, TUMKUR.
ABSTRACT:
At a time when fuel prices are rising globally the most urgent task is fuel monitoring. Many times the fuel pilferage in big cities has also made people inconvenient in cargo and transport business. Fuel monitoring systems are developing, and GPS vehicle tracking systems too and now appeared to the synthesis of both systems. Application of techniques of fuel monitoring allows to fuel monitoring systems to receive the information remotely and in relation to the coordinates and time. Application of techniques of fuel monitoring allows vehicle tracking systems to dramatically increase the functionality, providing the user with information not only about the location and speed of the vehicle. Many transport companies in big cities are engaged in offering cargo Services on hiring and rental basis. Transportation system being one of the major occupations in India needs to be checked and flaws are to be resolved. Normally truck transportation companies are facing major loss due to fuel pilferage or misuse. A representative or the driver is the one who looks after the fuel filling and managing the fuel tanks. But there are many cases where in the owner doesn’t notice the exact amount of fuel filled and the amount spent on it. Also fuel pilferage leads causes loss for the company. This project aims at providing a sound mechanism to prevent the pilferage in the fuel containers or tanks by implying a fuel level and discharge monitoring system. The system consists of PIC micro-controller interfaced to a float sensor through the inbuilt ADC that monitors the fuel level and fuel discharge. It also consists of speed detecting sensor for speed sensing and a temperature sensor for overheat detection. If the values of the same cross the threshold value a SMS is sent to the user. The micro-controller is interface to a 16x2 LCD which displays the temperature and fuel level. An EEPROM 24c04 or an internal EEPROM if available is also interfaced to store the values of fuel level at different intervals to take care of the fuel discharge. When the vehicle is switched on the fuel discharge is normal. But when abnormal discharge is detected the device sends a message to the base station using a GSM modem interfaced to the microcontroller informing the same. The user can reply back to the message and the ignition system can be cut off. Also when the lid of the tank is opened for fuel filling the device stores the reading of the fuel level in the EEPROM and compares it with the reading after closing the lid for checking the amount of fuel filled and sends it to the base station as a data to be recorded. This prevents the cause of distrust among the employees. The system also has a GPS fixed on it which helps in tracking the exact location of the vehicle. Thus any activity of pilferage in between the journey can be tracked by sending the GPS coordinates and activation of alarm immediately.

This project will facilitate the understanding of the following topics: PIC18 Hardware Designing Coding in C Interfacing GPS with microcontroller Interfacing EEPROM with microcontroller Interfacing GSM with microcontroller. Interfacing GSM with PC. PCB designing and concepts. UART Maintaining of database using Microsoft Access. Android for front end. Keypad interfacing. Interfacing sensors for voltage, fuel level and temperature using ADC LCD
I2C:
The Inter-Integrated Circuit Bus (I2C) is a multi-master serial data communication bus. Devices communicate in a master/slave environment where the master devices initiate the communication. A slave device is controlled through addressing. Here the EEPROM (24C04) is a slave device that is connected to the 8051 microcontroller (Master device) using I2C bus. The EEPROM stores all the readings of the fuel level.
Android Interface:
An Android application on a smart phone will be written to accomplish the task of Reading and writing the information from the Control system on the vehicle through GSM technology. This interface will be able to arrange the information read from the various vehicles in a tabular form and store the information.
BLOCK DIAGRAM
BASE STATION or the User
PC
GSM Module

ADVANTAGES
PREVENTS FRAUD OF FUEL; PREVENTS UNAUTHORIZED USE OF FUEL; PROVIDES HIGH-PRECISION MEASUREMENT OF FUEL LEVEL IN A FUEL TANK; GIVES DETAILED INFORMATION ABOUT FUEL TANK FUELLING AND DRAINING; GIVES DETAILED INFORMATION ABOUT FUEL CONSUMPTION; COLLECTS AND STORES INFORMATION ABOUT FUEL IN TANK FOR DETAILED ANALYSING; GIVES DETAILED FUEL USAGE WHERE YOUR VEHICLES HAVE BEEN; REAL VISITED POINTS; VEHICLE TRIP AND LOCATION;
CONCLUSION:
To achieve our final result that is a system which have capability to track vehicle, and check the fuel pilferage. We are used android front end for interfacing.
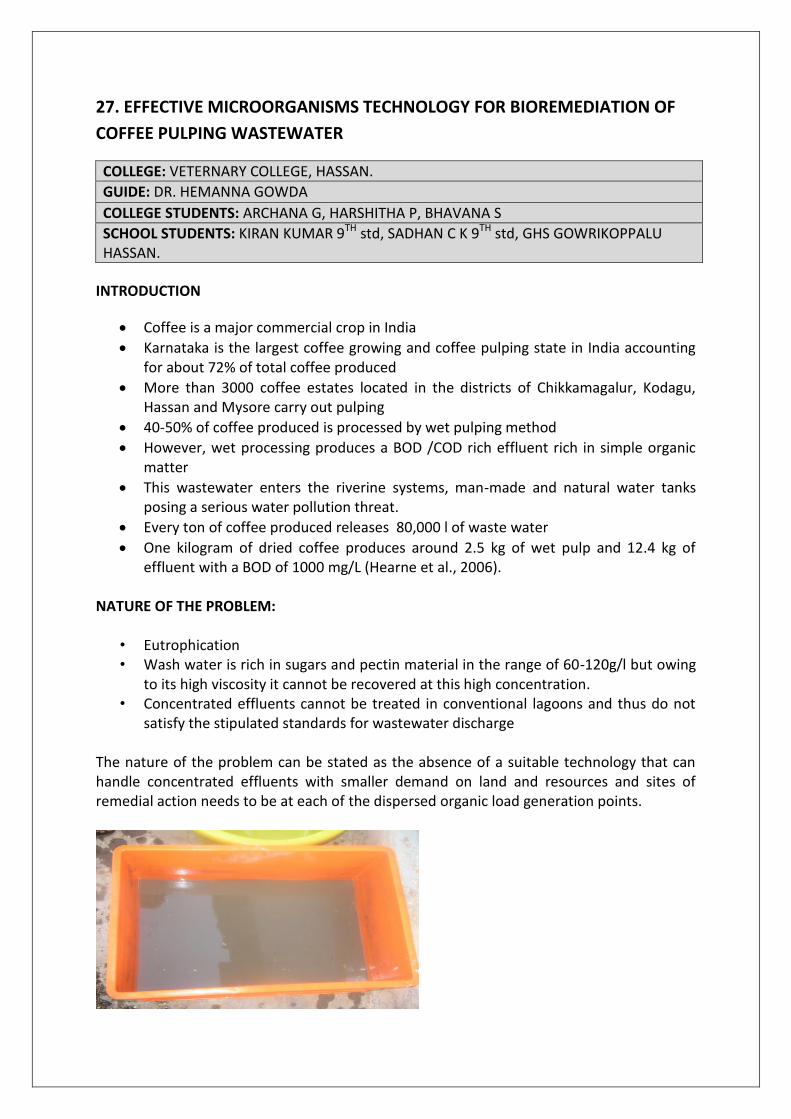
27. EFFECTIVE MICROORGANISMS TECHNOLOGY FOR BIOREMEDIATION OF
COFFEE PULPING WASTEWATER
COLLEGE: VETERNARY COLLEGE, HASSAN.
GUIDE: DR. HEMANNA GOWDA
COLLEGE STUDENTS: ARCHANA G, HARSHITHA P, BHAVANA S
SCHOOL STUDENTS: KIRAN KUMAR 9TH std, SADHAN C K 9TH std, GHS GOWRIKOPPALU HASSAN.
INTRODUCTION
Coffee is a major commercial crop in India
Karnataka is the largest coffee growing and coffee pulping state in India accounting for about 72% of total coffee produced
More than 3000 coffee estates located in the districts of Chikkamagalur, Kodagu, Hassan and Mysore carry out pulping
40-50% of coffee produced is processed by wet pulping method
However, wet processing produces a BOD /COD rich effluent rich in simple organic matter
This wastewater enters the riverine systems, man-made and natural water tanks posing a serious water pollution threat.
Every ton of coffee produced releases 80,000 l of waste water
One kilogram of dried coffee produces around 2.5 kg of wet pulp and 12.4 kg of effluent with a BOD of 1000 mg/L (Hearne et al., 2006).
NATURE OF THE PROBLEM:
• Eutrophication • Wash water is rich in sugars and pectin material in the range of 60-120g/l but owing
to its high viscosity it cannot be recovered at this high concentration. • Concentrated effluents cannot be treated in conventional lagoons and thus do not
satisfy the stipulated standards for wastewater discharge The nature of the problem can be stated as the absence of a suitable technology that can handle concentrated effluents with smaller demand on land and resources and sites of remedial action needs to be at each of the dispersed organic load generation points.

OBJECTIVES:
To develop appropriate technology interventions and remediation strategies for coffee processing systems for minimizing ecological damage in receiving water bodies.
Reduce BOD of coffee pulping wastewater and increase the DO level.
To make the coffee pulping wastewater suitable for let out in to river systems with the
use of Effective Microorganisms and Macrophytes.
The concept of the treatment is a conglomeration of our own.
STEPS IN COFFEE PULPING WASTEWATER TREATMENT:
Acidification
Neutralization
Primary Treatment
Secondary and Tertiary Treatment
Effective microorganisms in an up flow aerobic sludge tank
Secondary treatment with macrophytes for secondary treatment

Tertiary treatment with water hyacinth
PRINCIPLE / SCIENTIFIC BACKGROUND IN COFFEE PULPING WASTEWATER TREATMENT:
IN THE ACIDIFICATION POND:
Effluents containing water is allowed to rest at shallow depths for at least 6 hours. During
this time, raw mucilage comes out of solution and will float on top.
NEUTRALIZATION TANK
The acidity is lifted to at least pH 6 by addition of natural limestone (CaCO3)
250 milligrams of limestone is needed to buffer 1 litre of acid water (Treagust, 1999).
Radical change in solution pH from 3.8 up to 6. 2CH3COOH + CaCO3 = Ca (CH3 CO2)2 + CO2 + H2O
PRIMARY TREATMENT
The bacteria are active at a pH of 6 and carry out aerobic decomposition
Metabolize dissociated acetate ions which is the reaction product of Calcium Carbonate (CaCO3) and acetic acids in the neutralized waste water.
The oxygen supplied speeds up the aerobic decomposition
During aerobic operation, a reduction of 70 to 90% of BOD content can be achieved in as little as 4-6 hours retention time
2 CH3 COOH = 2CH4 + 2 CO2
The microbial course of actions
suppression of pathogens and disease-causing microorganisms,
conservation of energy
solubilization of minerals
microbial-ecological balance
Increased photosynthetic efficiency and biological nitrification.
Production of various low-molecular organic compounds, such as amino acids, sugars, vitamins, enzymes, and other bioactive substance (Higa and Wididana, 2compose organic 007).
The unique property of EM technology is that all the microorganisms work together to devour toxic compounds caused by human pollution.
SECONDARY TREATMENT
• Secondary treatment is a macrophyte treatment system with subsurface flow (Vymzal et al., 1998).
• Dissolved oxygen levels in the water are increased through diffusion of oxygen in the root zone of the macrophytes growing in the flooded gravel bed.
• The additional oxygen speeds up the aerobic decomposition of remaining organic matter.
• In addition, construction of wetland is able to remove between 49 and 81% BOD loadings and lower the amount of suspended solids between 36 and 70% depending on initial BOD loadings and retention time (Biddlestone et al., 1991).
TERTIARY TREATMENT
Tertiary treatment and final cleanup is done by water hyacinth (Eichornia crassipes) ponds. Water Hyacinth is particularly active in the removal of both bacteria and heavy metals. Finally treated water can be let into water bodies or reused for pulping process or used for irrigating the plantations.
MERITS OF PROPOSED TREATMENT METHOD
1. Low cost lime is cheaply available for neutralization. 2. Cost of construction for Aerobic sludge tank is relatively cheap, depending on
plantation 3. Natural wet lands within the plantations can be made use. 4. Odour problem is not evincible because the process is aerobic. 5. Effective microorganism culture is obtained from previous retention tanks. 6. Can be commercialized at large scale. 7. Already the research has been carried out at Bagane Heddal Estate, Chickmagalur.
The samples have been analyzed at KSPCB, Hassan for BOD, COD, pH, TDS, TSS. The results are justifying our concept in achieving the low BOD water.
DISCUSSION:
• The review of the literature suggests that anaerobic digestion of coffee pulping wastewater is possible but long term stability is an operational problem.
• Anaerobic digestion in multi feed bioreactor (Chankya et al., 2004) • Decolorization of synthetic coffee effluent (Tokumara, 2006), using solar Photo-
Fenton reaction. • Decolorization of UV assisted Photo Fenton for model coffee effluent (Martinez,
2003).
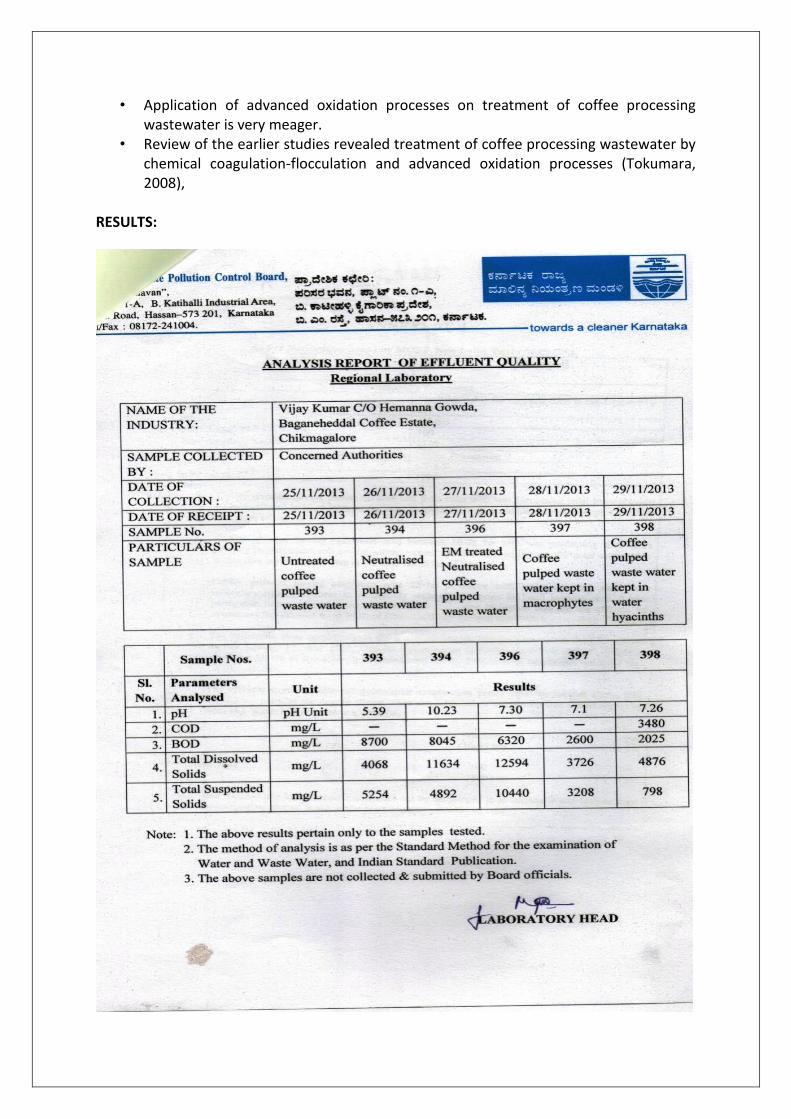
• Application of advanced oxidation processes on treatment of coffee processing wastewater is very meager.
• Review of the earlier studies revealed treatment of coffee processing wastewater by chemical coagulation-flocculation and advanced oxidation processes (Tokumara, 2008),
RESULTS:

The BOD level was found to have reduced to 2025mg/l of wastewater from 8700mg/l.
The COD level decreased to 3480mg/l.
The suspended solids level decreased from 5254mg/l to 728mg/l.
The pH was raised from 5.39 to 7.26.
CONCLUSION
The Effective Microorganisms technology is central in the treatment process of treating wastewater from coffee pulping units as the highest reduction of BOD levels in relatively short time is achieved.
Eventually, water is safe to enter natural waterways or for reuse for irrigation purposes.
The BOD level decreased to 2025mg/l.
But the recommended optimum level of BOD in effluents let out to fresh water bodies or reservoirs according to the Pollution Control Board is 1000mg/l.
FURTHER RECOMMENDATIONS
The BOD could be further reduced by
• Increasing the microorganism load • Increasing the holding time in the macrophyte tank by another day. • Also, pure cultures of the effective microorganisms could be isolated to enhance the
efficiency of bioremediation.

28. PORTABEL DEVICE TO DETECT HEAVY METAL AND HEAVY MICROBIAL
CONTAMINATIONS IN DRINKING WATER
COLLEGE: SIR M VISHVESHWARAIAH INSTITUTE OF TECHNOLOGY, BANGALORE.
GUIDE: DR H G NAGENDRA
COLLEGE STUDENTS: JOEL P JOSEPH, GOWRAV P BARADWAJ, SANTHOSH, MAROOS MD FURUK
SCHOOL STUDENTS: ARIF 9TH std, MOUNESH 9TH std, GOVERNMENT HIGH SCHOOL, HEBBAL.
ABSTRACT:
The Problem:
Water is one of the most essential components of a living system, and all the physiological processes need water. The deterioration in its quality due to pathogens, heavy metals, deleterious chemicals etc., causes impairment in the regulatory agents associated with cellular functions, thus leading to diseased conditions. Because of these reasons, quality assessment of potable water has all time significance.
The either presence of heavy metals like Arsenic, Lead, etc., or chemicals like Fluoride, sulphides etc., or pathogenic microbes is always great peril. Their presence in potable water beyond the safe/threshold limits, are known to cause dreadful ailments like Arsenic poisoning, Skin cancer, Lead poisoning, Fluorosis, Diarrhoea, Dysentery etc.
Lead poisoning is a major cause of ‘slow deaths’ of children globally. According to WHO reports, Lead poisoning is one of the most common and best-recognized childhood diseases of toxic environmental origin. Children around the world today are at risk of exposure to lead from multiple sources. Lead poisoning accounts for about 0.6% of the global burden of disease (WHO, 2009).i The Deccan Chronicle, on August 26, 2013, voiced an expert’s concern that India is on the verge of becoming lead poisoning capital.ii
Arsenic poisoning is another slow killer daunting the human race. Exposure to Arsenic can cause Arsenic poisoning and also skin cancer in the long run!
Fluorosis caused by the exposure to Fluoride is also a potential danger! Ingestion of excess fluoride, most commonly in drinking-water, can cause fluorosis which affects the teeth and bones. Moderate amounts lead to dental effects, but long-term ingestion of large amounts can lead to potentially severe skeletal problems.iii
Microbiological contamination of drinking water has long been a concern to the public. Pathogens like bacteria, viruses and protozoa cause series of water borne diseases as well. Poor water quality, sanitation and hygiene account for some 1.7 million deaths a year world-wide (3.1% of all deaths), mainly through infectious diarrhoea.
The devices currently available in the market for the rapid detection of these metals are rare and costly. For instance, the water safe lead test kit costs about $10.15 i.e., about 700 INR. Fluoride detection test papers cost about $41.15 i.e., about 2550 INR.iv SenSafe Arsenic Mini
Test Kit costs $12.99 i.e., about 805 INR.v Similarly Water safe Bacteria test strip costs $19.95 i.e., about 1240 INR.vi
We are attempting to develop a device that not only is cost effective but also can be used for the detection of lead, arsenic and fluoride, in addition to the microbes, all in a single instrument. Also, we aim to keep the detection method simple that a common man can handle it with ease.
Towards the Solution:
An All-in-one device :- The above proposed device would be a low cost, easy to handle, portable instrument which can detect levels of microorganisms, lead, fluorides and arsenic, thus making it a highly comprehensive device.
A device was developed for the detection of microbial contamination in water based on dye reduction. We have tried to extend the work by attempting to detect the presence of Arsenic, Lead and Fluoride via similar dye based strategies.
Lead Detection: A spectrophotometric method for determination of trace lead in water after pre-concentration using mercaptosephadex is adopted. Under optimal condition, lead reacts with the reagent to form a yellow complex in presence of TritonX-100, which has a maximum absorption peak at 479 nm. The limit of quantification, the limit of detection and relative standard deviations are 4.3, 1.4 ng ml−1 and 1.0%, respectively.vii The U.S. EPA maximum containment level of lead allowed in drinking water is 15 ppb.
Arsenic detection: Similar spectrophotometric method for determination of Arsenic in water (at ppm levels) is done based on the color bleaching of methylene blue (MB), whose absorbance is 609 nm, in anionic micellar medium. The acceptable level as defined by WHO for maximum concentrations of arsenic in safe drinking water is 0.01 ppm.viii Different calibration graphs at the three different ranges of arsenic concentration such as 0–8.63, 0–1.11 and 0–0.11 ppm were constructed and limit of detection (LODs) were found to be 1.3, 0.53 and 0.03 ppm, respectively.ix
Fluoride detection: Classical spectrophotometric method for determination of Fluorides in water can be done by a cyanine dye which has an absorption maximum at 600 nm. Under optimized conditions, absorbance at 600 nm is proportional to fluoride concentration up to about 1 × 10⁻⁴ mol/L with a detection limit of 1.0 × 10⁻⁷ mol/L.x
ADVANTAGES:
The methods are simple, cost effective and reproducible (relative standard deviations lies within ±5 %.)
Detection is rapid and eco-friendly.
It is free from phosphate and silicate interferences and applicable for real sample analysis.
PRINCIPLE AND CONSTRUCTION OF THE DEVICE: PRINCIPLE:

The amount of light passing through the medium is obtained by BEER-LAMBERT’s law. “The law states that there is a logarithmic dependence between the transmission (or transmissivity), T, of light through a substance and the product of the absorption coefficient of the substance, α, and the distance the light travels through the material (i.e., the path length), ℓ “.
The transmission (or transmissivity) is expressed in terms of an absorbance. A simplified version can be given by the equation . Hence we can calculate the absorbance if we can find the absorption coefficient of the substance (α), and the distance the light travels through the material (ℓ).
The distance travelled through the medium (ℓ) can be designed as required, absorption coefficient of the substance (α) can be calculated or obtained by the using microcontroller.
CONSTRUCTION:
The basic block diagram is as shown in the below figure. LED’s are used for the detection; it is made to pass through the test sample. LDR accepts the transmitted light and converts it into equivalent electrical signal, this is given to the amplifier to amplify the signal and this signal is measured using measuring instruments.
The measurement can be done using a voltmeter or a better method is to use microcontroller to take the values and calculate the absorption value as obtained in a standard spectrophotometer.
Components used:
1. LED (Emitter). 2. LDR (Receiver). 3. IC L7805-5v regulator 4. Capacitors 100μf, 40 μf 5. Resistors 100, 10k 6. IC 741-comparator 7. Microcontroller calculations. 8. 16*2 LCD Display for easy interpretation of the results.
DYES USED:
Methylene Blue Dibromohydroxylphenylporphyrin + Triton X-100 Cyanine

29. REMOVAL OF HEAVY METALS FROM WATER BY ADSORPTION USING
CORIANDU SATIVUM
COLLEGE: GOVERNMENT ENGINEERING COLLEGE, HASSAN.
GUIDE:
COLLEGE STUDENTS: NAVEEN KUMAR D T,CHANDRASHEKARA,PRAVEEN P S,RAKSHA M N
SCHOOL STUDENTS: CHETHAN KUMAR P 9TH std, UMESH 9TH std; KALVIR HIGH SCHOOL, HASSAN.
INTRODUCTION "Heavy metals" are chemical elements with a specific gravity at least 5 times that of water. The specific gravity of water is 1 at 4°C (39°F). Specific gravity is a measure of density of a given amount of a solid substance when it is compared to an equal amount of water. Some well-known toxic metals with a specific gravity 5 or more times that of water are
Metals Specific gravity
Arsenic 5.7
Cadmium 8.65
Iron 11.34
Mercury 13.546
Lead 11.34
Copper 8.93
Zinc 7.10
Chromium 7.18
BENEFICIAL HEAVY METALS
In small quantities, certain heavy metals are nutritionally essential for a healthy life. Some of these are trace elements (eg, iron, copper, manganese, and zinc). These elements, or some form of them, are commonly found naturally in foodstuffs, fruits and vegetables, and in commercially available multivitamin products (CIS 1999). Diagnostic medical applications include direct injection of gallium during radiological procedures, dosing with chromium in parenteral nutrition mixtures, and the use of lead as a radiation shield around x-ray equipment (Roberts 1999). Heavy metals are also common in industrial applications such as the manufacture of pesticides, batteries, alloys, electroplated metal parts, textile dyes, steel, and so forth (CIS 1999). Many of these products are in our homes and add to quality of life when properly used.

Toxic heavy metals can cause the following health problems
Long term exposure to cadmium is associated with renal dysfunction. Cadmium is biopersistent and once absorbed remains resident for many years. High exposure can lead to obstructive lung diseases and has been linked to lung cancer. Cadmium may also cause bone defects in humans and animals. The average daily intake for humans is estimated as 0.15µg from air and 1µg from water;
Low exposure to chromium can irritate the skin and cause ulceration. Long term exposure can cause kidney and liver damage. It can also cause damage to circulatory and nerve tissues;
High doses of copper can cause anaemia, liver and kidney damage, and stomach and intestinal irritation. People with Wilson's disease are at greater risk for health effects from overexposure to copper;
Exposure to lead can lead to a wide range of biological defects in human depending on duration and level of exposure. The developing foetus and infants are far more sensitive than adults. High exposure can cause problems in the synthesis of haemoglobins, damage to the kidneys, gastrointestinal tract, joints, reproductive system and the nervous system. Studies have suggested that exposure to lead can cause up to a loss of 2 IQ points;
Inorganic mercury poisoning is associated with tremors, gingivitis and/or minor psychological changes together with spontaneous abortion and congenital malformation. Monomethylmercury causes damage to the brain and the central nervous system while fetal and post-natal exposure have given rise to abortion, congenital malformation and development changes in young children;
Excessive amounts of nickel can be mildly toxic. Long term exposure can cause decreased body weight, heart and liver damage and skin irritation;
Exposure to high levels of arsenic can cause death. All types of arsenic exposure can cause kidney and liver damage and in the most severe exposure there is erythrocyte hemolysis;
METHODS OF REMOVAL
REMOVAL BY ADSORBTION TECHNIQUE USING ‘CORIANDRUM SATIVUM’
Measure the required quantity of water which is to be treated. Pour it into the empty container.

Make some kind of ‘teabag’ of CORIANDRUM SATIVUM and introduce to the water which is to be free from heavy metals.
Simultaneously note down the time. Allow the teabag for 15 min for reaction known as detention period.
After desired time intervals pass the sample to the filter containing IS sieve and sand filter column. Collect the sample and test it for metal content.

30. WATER PRODUCED FROM AIR
COLLEGE: MAHARAJA INSTITUTE OF TECHNOLOGY, MYSORE.
GUIDE: DR.B C NAGENDRA PRASAD
COLLEGE STUDENTS: S KARTHIK, AKASH JAIN, MAYUR VERMA R V, NISHANTH K J
SCHOOL STUDENTS: SANDESH S 9TH std, RAKESH 9TH std, GHS KALLURNAGANAHALLI
ABSTRACT:
The project deals with collection of moisture content to turn it into drinking water in a three stage process. Air filtration through membrane filters or fiber filters to remove dust and suspended particles in air. The next step is to condense the moisture using a surface condenser simplified for the same purpose and run by 0.48kW of power installed through billboards. The final step involves carbon filtration with the use of activated charcoal. Finally, the storage can be done in earthen pots to keep the water cool. The maintenance required for the whole setup is relatively low and simple. A once in 6 month change of activated carbon filters and once in 3 months change of air filters. Alternatively, the power source for the condenser can be derived from solar energy for lower maintenance and will be economical in the long run.
INTRODUCTION:
The renewable source of water through the atmospheric moisture of about 80% that can be collected feasibly using our proposal through water collecting billboards that can be installed through remote parts, arid regions and cities with water scarcity. Even in Bangalore with atmospheric moisture of 85%, this is an indigenous solution.
Schematic Process and layout of Billboard:
NEED AND SCOPE:
The availability of potable drinking water is still at a great hindrance in rural and remote parts in India. This will be an initiative step towards helping solve the raging problem with relatively simple setup.

CONCLUSION:
The proposed project can be extensively used under our tropical conditions at a nominal initial cost of instalment and with low cost maintenance for a longer run. This will be a sustainable approach to our water crisis.

31. WIND POWERED WATER PURIFICATION SYSTEM
COLLEGE: JAWAHARLAL NEHRU NATIONAL COLLEGE OF NAVULE, SHIMOGA
GUIDE: DR D S RAMAKRISHNA
COLLEGE STUDENTS: MANOJ H U, DARSHAN KUMAR V, SUDHANVA T R, RANJAN A S.
SCHOOL STUDENTS: PURUSHOTHAM D V 9TH std, ANIL KUMAR A N, DVS COMPOSITE PU COLLEGE, SHIMOGA.
ABSTRACT
The Wind powered water filtration project is intended to provide clean drinking water to
anyone in need. The lack of clean water supplies could save countless lives every year. A
small scale water filtration system could be brought into remote areas and provide the
means of purifying previously contaminated water. Filtering local sources of water would
eliminate the need to import large quantities from elsewhere, saving relief funds for
alternate uses. The purpose of this project is to design and manufacture a small scale water
purification system which requires minimal maintenance and is cost efficient. To power this
system, Human and wind power systems will be explored
Windmill is used as the renewable energy power source for this water purifying system by which wind mill converts mechanical energy into electrical energy. The windmill is corrosion resistant and has an internal safety regulator that will shut the windmill off in dangerous wind conditions. The produced electrical energy used for converts contaminated water into potable water by using boiler and heat exchanger. The electrical power generated by the windmill will be transformed into heat that will boil water. The electrical wires will be connected to the heating element inside of the boiler and heat exchanger system. A boiler is constructed to house the heating element and enclose the evaporation process. Contaminated water enters the boiler from the bottom through a pipe from the heat-exchanger. The heating element then heats the water until it vaporizes and the vapour then leaves the system through a pipe at the top of the boiler. Nichrome resistance wire can be used as the heating element inside of the boiler and heat exchanger system. The resistance wire will receive the electricity produced by the windmill and convert it into heat.

32. ARTIFICIAL NEURAL NETWORK BASED VEGETABLE CLASSIFIER
COLLEGE: JAWAHARLAL NEHRU NATIONAL COLLEGE OF NAVULE, SHIMOGA
GUIDE: SANDEEP KUMAR E
COLLEGE STUDENTS: SPOORTHI M N, SHREEKANTHA A N, SOUJANYA S R, SUSHMA J S.
SCHOOL STUDENTS: ABHISHEK S S, PRATHEEK M.
ABSTRACT There has been a concern in recent years regarding the efficiency of marketing of fruits and vegetables. If we go to the market (APMC yard) early in the morning we can see the vegetable vendors struggling to buy the best load which can get them more money. Getting the best of the loads is nothing but getting more ripe vegetables. For which the less ripened and rotten ones should be separated from the good ones. If manually done, it needs more time and patience and also it is prone to human errors. In this context we propose a more efficient and quick way of separating the vegetables depending on their level of ripeness. Automation of quality control is highly significant because saving time and expenses is always a necessity. Here the concept of image processing is employed to differentiate between fully ripe, less ripe and rotten vegetables. We use a camera to get the input and MATLAB for image processing. Features like color, shape and surface contour are processed and analysed to classify vegetables. Using a microcontroller we employ a mechanism to separate the rotten ones from ripened ones. By using MATLAB we have advantage of a very large (and growing) database of built-in algorithms for image processing and computer vision applications. This approach is less complex and faster. It not only will help vegetable vendors to get the best vegetable in a more efficient and error free manner but also fetch those better profits and it reduces human effort. INTRODUCTION Vegetables are edible plants or an edible part of a plant. It is intended for cooking or eating raw. The word vegetable comes from the Latin word “vegetabilis” which means plant cultivated for food. These vegetables can be consumed raw or in a cooked form. To get the best of the vegetables, one has to separate the vegetables into raw, half ripe, fully ripe and rotten ones. Let us consider TOMATO as an example. Tomato undergoes significant color change through its stages of ripening. We propose a methodology in order to separate the tomatoes in market into the above mentioned categories. The methodology consists of two parts-Machine vision and machine intelligence. The machine vision part uses image processing where the features such as red color histogram and cosine transform are extracted. These parameters are fed to the machine intelligence part which uses artificial neural networks as the tool for the classification.

METHODOLOGY This section involves use of various steps and techniques in the process of separation of tomatoes. Image acquisition The images of tomatoes were taken from the 5MP camera keeping minimum of 15cm distance between tomato and camera. All the images were taken from top view. An arrangement is made to acquire images of the tomatoes as shown in Figure-2(a). The box arrangement is made so that no much noise is added while images are captured. A set of 15 LEDs are used in order to illuminate inside the box as shown in Figure-2(b). This set up maintains same lighting condition all the time.
Figure-2: (a) Box arrangement (b) Set of 15 LEDs.
Image samples In this work, tomatoes were grouped into fully ripe, half ripe, raw and rotten tomatoes. From all these groups, images were taken out of which some were used for training and remaining half images for testing. The images of these tomatoes from each group are shown in Figure-3. The groups were made based on the color appearance of the tomato. The tomato was judged as fully ripe if it is fully red in color; 50%-60% red was put in half ripe category, fully green was put in raw and rotten based on its color degradation.

Figure-3: (a) Fully ripe tomato (b) Half ripe tomato (c) Raw tomato (d) Rotten tomato
Devised Methodology In this process, four different classes of tomatoes are taken: Fully ripe, half ripe, raw and rotten tomatoes. The image is captured from a 5 MP camera. This image is later resized for 640X480 in the pre-processing stage. Also the image is pre-processed for de-noising and contrast. Later this image is used for the feature extraction where the red color information of the tomato is extracted. The plot of red color histogram of all these cases is shown in Figure-4. Discrete Cosine Transform (DCT) is another important tool used to classify good ones with rotten ones. The reason for choosing this concept is the color of rotten and fully ripe tomatoes are almost same.
Figure-4: (a) Fully ripe tomato red histogram. (b) Half ripe tomato red histogram (c) Raw
tomato red histogram (d) Rotten tomato red histogram

This information is used to train a classifier which is an artificial neural network and the tomatoes are classified.
BLOCK DIAGRAM:
FUTURE ENHANCEMENT The proposed methodology can be made to work with better efficiency. The following are some of the ways to enhance the classification process
Using pressure sensors to classify good tomatoes with that of rotten ones along with the features extracted.
Multiple stages of classification to ensure double filtering of tomatoes. CONCLUSION This work carried out contains image processing which gives a sense of filtering and sorting process. The stages comprises of a blend of machine vision using image processing and machine intelligence using Artificial Neural Networks. This classifier reduces human effort, time and it is a one-time investment.

33. BIODEGRADABLE FIBRE MAT FOR AGRICULTURAL APPLICATIONS TO
PREVENT SOIL EROSION AND IMPROVE ITS FERTILITY
COLLEGE: SIR M VISHVESHWARAIH INSTITUTE OF TECHNOLOGY, BANGALORE
GUIDE:SRINIVAS B
COLLEGE STUDENTS: NAVEEN C S,SANTHOSH B K, DEEPAK BAJANTHRI
SCHOOL STUDENTS: DEEPTHI 9TH std, RAJAMANI 9TH std, DEEPA ACADEMY FOR THE DIFFERENTLY ABLED, SUBRAMANYA NAGAR, BANGALORE.
ABSTRACT This project presents a systematic framework for optimal utilization of palm fiber which is generated during crude palm oil refining process. These wastes can be used to produce valuable products which can be used for agricultural applications. The products developed by this process will not only help in waste management but also help in generating revenue for the farmers by developing value-added products. The oil palm fibers are not currently in vogue for the preparation of palm mats as it is not very conducive for the preparation of these mats due the presence of oil. The current project aims at bio-modification of these fibers to make it a valuable raw-material for the preparation of palm fiber mats.
INTRODUCTION
Industrial waste management is a global problem. Growing waste-disposal costs and stringent environmental regulations have led to widespread waste management efforts through transformation of industrial wastes and by-products into valuable products. The palm oil generates lot of by-products which can be used effectively for developing added-value products.
Figure1: Depiction of various processes involved in oil palm industry.

DESCRIPTION Oil palm fiber can be classified into FFB fiber (Fresh Fruit Bunch), EFB fiber (Empty Fruit Bunch), shredded EFB fiber, oil palm fruit mesocarp fiber as well as oil palm trunk fiber, each category have their own property that serve for difference purpose. EFB fiber is one of the major part of palm fiber. India produces 50000 MTs of crude palm oil per year, which is expected to increase by 3 lakh metric tons/year, in next five years. It is estimated that a palm oil mill approximately generates one ton of empty fruit bunches for every ton of crude oil produced. These fruit bunches are being cheaply utilized for boiler fuels, shipper boxes, coir, hard boards etc. These Empty fruit bunches can be used to produce Palm Fiber Mat which is biodegradable and is made up of 100% organic fiber from a renewable source i.e, Empty Fruit Bunch (EFB) obtained after the removal of palm fruit. The mats thus obtained would be hard and strong enough so that it can be spun and woven into rolls. They also have the right strength and durability to protect the slopes from erosion, while allowing vegetation to flourish. The mat’s nature allows for free flow of water to the ground whilst also acting as a protective layer, preventing erosion of the top soil. OBJECTIVE:
o Effective utilization of large amount of Biomass viz., mesocarp fibers, kernel shells, and empty fruit bunches to develop alternative fuels.
Mulching is a method for soil conditioning which helps with moisture retention in the soil, thereby enhancing quality for healthier plant growth particularly in hot countries with long periods of dry weather. Additionally, it retards growth of undesirable weeds, detrimental to plants. Palm Fiber Roll is best for the Erosion Control and improving the soil quality. It is naturally resistant to fungal and bacterial decomposition and is cheaper and eco-friendly when compared to the usual synthetic geo-textiles which are currently in vogue. They hold soil in place and prevent its erosion, dissipating the force of heavy rains and run-off water. It provides good soil support for several months, allowing natural vegetation to be established. Palm Fiber Roll promotes the growth of new vegetation by absorbing water and preventing the top-soil from drying out. As it has strength and durability, it protects slopes and help natural vegetation to take root. Over a period of time the eco-friendly and biodegradable coir disintegrates completely, leaving only humus.

Figure 2: Mats that can be formed by oil palm fibers.
Advantages of using Palm Fiber Roll:
Figure 3:
1) Promotes vegetative growth
2) Easy to install/maintain
3) Adds organic material to soil
4) Tough and durable, Hygroscopic in nature (absorbing or attracting moisture from the air
allowing re-vegetation in low rain areas)
5) 100% Bio-degradable and eco-friendly
6) Can absorb water, dissipate the energy of flowing water and absorb the excess solar
radiation.
7) Can be successfully utilized in controlling even the steepest of slopes from erosion.

Advantages of Palm Fiber Roll for Mulching:
Labour cost reduction, i.e. weeding and up keeping of plants; handling of EFB.
Lower usage of chemicals, e.g. weed-killers and insecticides for beetles, etc.
Reduction of transportation effort and cost as the rolls are easy to handle, i.e.
compact and lighter.
Less & more efficient utilization of fertilizer
Fertilizer concentration on rolls and gradual release into soil improves optimal
absorption for plants. Losses of fertilizer in the surrounding areas away from plants
are minimized.
Easier recovery of loose fruits on the rolls
Health and safety of staff are not unnecessarily compromised as there is less need to
handle weed-killers that can endanger their health and well-being.
Figure 4: Palm Fiber Mats used for Mulching.
Applications:
Desert Area (Reduce floating sand and dust)
Lake, pond, river, irrigation and drainage channel banks
Roadway, highway, pathway and railway embankments
Residential Area (Beautification and Landscaping)
Exposed or newly developed slopes with risk of erosion.
Advantages of Palm Fiber Roll for Erosion Control:
Installation process is easy
Sufficient sunlight can pass through
Highly permeable to air and water
Water retaining capacity is high
The seeds and saplings are held in place
It can serve as a media for quick vegetation
It naturally degrades over the years
Facilitates deep rooting of plants and nutrient provision
Higher binding rate of soil

Figure 5: Palm Fiber Mats used for controlling Soil Erosion.
CONCLUSION
The major goal of this project is to utilize oil palm fiber in order to develop value added
products for the prevention of soil erosion. The efficiency of the palm fibers will be
improved with biotechnological approaches. It also attempts to create additional revenue to
the farmers by producing cost-effective products from agro-wastes and thereby developing
a zero-waste discharge strategy for the oil palm industry.

34. DESIGN AND FABRICATION OF PEDAL OPERATED MULTICROP THRESHER
COLLEGE: SIR M VISHVESHWARAIH INSTITUTE OF TECHNOLOGY, BANGALORE
GUIDE:SRINIVAS B
COLLEGE STUDENTS: NAVEEN C S,SANTHOSH B K, DEEPAK BAJANTHRI
SCHOOL STUDENTS: DEEPTHI 9TH std, RAJAMANI 9TH std, DEEPA ACADEMY FOR THE DIFFERENTLY ABLED, SUBRAMANYA NAGAR, BANGALORE.
ABSTRACT
Threshing is the process of loosening the edible grains of crops from scaly inedible chaff. Even though there are modern automated threshing machines in the market, they are not within the reach of farmers having less income, due to its high cost. Also these automated heavy machines are not portable to hilly areas where the lands are usually fragmented. On the other hand, the traditional threshing operations require lot of labour.
Now the objective of the project is to develop a low cost & portable multi crop thresher which consumes only human effort and which can be carried over a bicycle. With this design the problems associated with labour availability can also be reduced.
Machine consists of welded vertical members called Pegs, which are been welded on to a shaft. This is enclosed by a cylinder casing. The entire assembly is mounted on a bicycle & it is operated by mere pedalling of the bicycle. When the operator begins to pedal, the shaft having the pegs starts to rotate. Now the other operator feeds the crops into the machine by holding the small bundle of crops in the hands, positioning and twisting the bundle against the rotary shaft. The threshing is accomplished by the impact of fast moving members on the shaft called pegs. Finally the threshed grains slide along the carriage and can be collected.
Main parts of the machine
Cylinder casing: Casing is made up of 16 gauge Mild Steel.. It covers the threshing area and does not allow the threshed paddy to splash out. A hopper is provided at the top of the drum to feed the paddy for threshing operation.
Pegs: Pegs are made up of Mild Steel sheets.. When the paddy bundle is held in the hands & ear head portion of the crop is pushed inside the drum, the rectangular pegs strike the ear heads & grain gets detached from rest of the crop.
Shaft: Shaft is a rotating machine element, circular in cross section, which supports power transmission elements like gears, pulleys, sprockets & transmits power. The pegs are welded onto the shaft. The diameter of the shaft is designed to sustain all the loads of the pegs and sprocket.
Bearings: Bearings are the mechanical members which are used to reduce the friction between rotating & stationary members. Since the loading condition is perpendicular to axis of rotation, simple Plummer block bearings serve the purpose. Each bearing is fixed in the center of the frame at appropriate position.
Chains & Sprockets: Sprockets are useful in order to transmit power from one shaft to another by means of chain drives, which are assembled on the sprockets mounted on

the two shafts. When the force is applied on the pedal, the force is transmitted to the driven shaft through these chains & sprockets.
TESTING AND ANALYSIS Procedure:
1. Initially in order to test the efficiency, the pedal operated portable paddy thresher and the paddy crops were kept ready.
2. Now, the operator started pedalling the bicycle & another operator started feeding the crops from the hopper.
3. Due to the impact of fast moving pegs on the grains, the paddy crop was threshed and was collected from the tray provided at the bottom.
4. Experiment was conducted for 1 minute at 72 rpm. 5. The threshed paddy was weighed and the output capacity for 1 hour was calculated.
OBSERVATIONS:
To find the amount of paddy grains threshed per hour the following observations were made:
Duration of experimentation or testing = 1 minute.
Speed of threshing shaft = 72 rpm.
Number of operators = 2 persons.
Table of observations and result:
After performing testing, the output capacity was compared with the other existing threshing machines along with various other parameters as shown below:
Table 5.1 Table of observations and result
Different threshers
Parameters Machine Pedal operated Portable
Weight (KG) 1025 50 35
Cost (RS) 50,000 20,000 6200
Power source Motor/engine Human effort Human effort
Operating mode Standing standing Sitting

RESULT:
Total amount of paddy threshed per hour = 36 kg
Though the capacity of this machine is relatively less, it will be compensated by its additional portability feature.
SURVEY ANALYSIS
In the initial phase of the project, we visited certain villages near Nanjangud to enquire farmers about the problems that are currently being faced by them.
As a result, we came to know about the problems which include 1. Labour unavailability. 2. Cost associated problems. 3. Portability problems.
In the second phase, we started the design procedure by having a conceptual design of the machine which can thresh the crops with minimum human effort and which is portable on a bicycle.
ADVANTAGES AND APPLICATIONS
Farmers in hilly regions require a machine which is portable as the road conditions are improper, hence it serves the purpose.
It eliminates the problem of labour availability as it can be operated by only two persons.
It eliminates the use of electric power or any other non-conventional source of energy as m the machine is compact, durable & portable as the entire machine can be carried on a bicycle.
Operating & maintenance of machine does not require any special skills.
It can be operated in rainy seasons without drenching the crops, as the machine is compact.
It can be used to thresh crops like Ragi, paddy, Jowar & ground nut.
Machine is simple in construction, hence easy to design and fabricate.
Machine is operated manually & it is easy to operate.
The transportation of paddy from field to processing areas is performed mainly by humans and animals and sometimes using mechanical powers. These traditional methods of transport result in grain losses. Since this machine is portable grain losses can be reduced.
Farmers with small fragmented land holdings can effectively use the machine as it is portable.
The machine is within the reach of small & medium scale farmers as it is relatively less costly and less weight (35 kg) when compared to other threshing machines.
LIMITATION
Capacity is relatively less when compared to modern threshing machines, but it is compensated by the portability feature.
Thresh capacity (KG/HR)
1800 450 -650 36

CONCLUSION
In this project, an effort is being made to improve the already existing threshing machine without using any electrical power and to reduce the pedalling effort.
In order to compensate these problems faced by farmers, we have designed this multi crop thresher; as such it can be operated by a bicycle and carried behind the same.
With this machine, we can overcome the problem of labour unavailability as it requires only two operators to effectively operate the machine.
Although the capacity of this machine is relatively less, it will be compensated by its portability feature & reduced operating cost.
As a scope for future work, installation blower to the assembly will assist winnowing of grains.
Design can be further optimised by implementing Kinetic Energy Recovery System (KERS) technology, as it reduces human effort.
Modification of cylinder casing can be done by providing opening using hinges for the ease of accessibility for cleaning operation.

35. EMBEDDED FLOATING AUTO FISH FEADER FOR SMART POND
MANAGEMENT SYSTEM
COLLEGE: SHRIDEVI INSTITUTE OF ENGINEERING AND TECHNOLOGY, TUMKUR
GUIDE: HARISH B
COLLEGE STUDENTS: SALAM SIBANANDA SINGH, ANURADHA S MADABHAVI, MANASA K R, RATHNA HUNASIKATTI
SCHOOL STUDENTS: DARSHAN GOWDA 8TH std, HARSHA PATEL 8TH std; TUMKUR.
OBJECTIVE:
The new proposed “Embedded floating auto fish feeder for smart pond management system” implements advanced technology for best pond management system.
ABSTRACT:
Floating auto fish feeder for smart pond based on embedded application. To manage smart pond system is PIC16F887 microcontroller chip is used. Sensors are used to measure pH value and temperature. Another main part is Zigbee with a UART protocol is used for wireless communication and LCD monitor display the pH and temperature. Here we use Aerator to separate the oxygen present in upper layer to lower layer which reduces the harmful gases content in water therefore by using floating auto fish feeder for smart pond can improve the feed efficiency and labour cost, and it is used to measure the water quality.
MOTIVATION:
Today is the world of new scientific invention. Each day there are some new inventions in almost every field in the world. World is becoming very fast and automatic because of these inventions day by day. So we have decided very cheap alternative to make the process of maintaining fish feeding, temperature and ph. value checking of water fully automatic.
PROBLEM STATEMENT:
Indian fisheries and aquaculture industry provides nutritional security and 5.3% of Agriculture exports and providing employment for 14 million people. Our country stands as third largest in fisheries production and second largest in Aquaculture production. Existing manual pond management system does not the standards and also our average annual production per person is less when compared with European and North American countries.
INTRODUCTION:
The features of new system are as follows:

Floating structure for best mobility
Auto fish/aqua feeder based on time intervals.
Water quality measurement (PH, temperature, etc...) and intimation
Self-diagnostic feature: feed, battery, memory status alert.
Pc based remote operation employing Zigbee Operates on 12V rechargeable battery
ADVANTAGES:
1. Improves feed efficiency and reduces labor cost. 2. Feed rate and feed time can be adjustable. 3. Measures water quality.
EXPECTED OUTCOME OF THE PROJECT:
Main expected outcome is to make our model efficiency and reliable for automatic feeding mechanism, checking temperature and pH level and aeration process.
APPLICATIONS OF THE PROJECT:
Aquaculture/Fish pond automation and quality monitoring system.
In waste water treatment plants as water quality monitoring equipment.
Applicable for remote parameter monitoring of civil body lakes and ponds.

36. INSILICO STUDIES OF PROTEIN BASED DRUG FOR HIV & CANCER
[ENDOPHYTIC FUNGI AS DRUGS FOR HIV & CANCER]
COLLEGE: SRIDEVI INSTITUTE OF ENGINEERING AND TECHNOLOGY, TUMKUR.
GUIDE: Dr. M GOVINDAPPA
COLLEGE STUDENTS: VINAY DUTTA, BHAWNA BHAT, PRAHLAD BAISHYA
SCHOOL STUDENTS: ABHILASH H S 9TH std, SANJAY S 9TH std, SRIDEVI VIDYA MANDIR, TUMKUR.
INTRODUCTION
Cancer is a group of diseases in which cells are aggressive (grow and divide without respect to normal limits), invasive (invade and destroy adjacent tissues), and sometimes metastatic (spread to other locations in the body). Cancer may affect people at all ages, even fetuses, but risk for the more common varieties tends to increase with age (Cancer Research, 2007). Cancer causes about 13% of all deaths ( WHO , 2006 ). According to the American Cancer Society, 7.6 million people died from cancer in the world during 2007 (American Cancer Society, 2007). Report sees 7.6 million global 2007 cancer deaths. Nearly all cancers are caused by abnormalities in the genetic material of the transformed cells. These abnormalities may be due to the effects of carcinogens, such as tobacco smoke, radiation, chemicals, or infectious agents. Other cancer-promoting genetic abnormalities may be randomly acquired through errors in DNA replication, or are inherited, and thus present in all cells from birth. Complex interactions between carcinogens and the host genome may explain why only some develop cancer after exposure to a known carcinogen. New aspects of the genetics of cancer pathogenesis, such as DNA methylation, and microRNAs are increasingly being recognized as important.

Another deadly diseases affecting is the AIDS. Since the beginning of the epidemic, almost 70 million people have been infected with the HIV virus and about 35 million people have died of AIDS. Globally, 34.0 million [31.4–35.9 million] people were living with HIV at the end of 2011. An estimated 0.8% of adults aged 15-49 years worldwide are living with HIV, although the burden of the epidemic continues to vary considerably between countries and regions. Drug Discovery
Drug discovery started a century ago. Throughout these years there is a rise in the discovery of molecular targets that can be used in the drug discovery with advancement in genomics and Proteomics filed. The drug discovery and development process are mainly derived from natural or synthetically derived compounds. The significance of drug discovery is to find new drugs that have fewer side effects and reduce the occurrence of drug resistance therefore drug discovery is essential in finding drugs that exert maximal therapeutic level with low toxicity (Breinbauer, 2002)
Lectin
Lectins or glycoproteins are a class of multivalent carbohydrate binging proteins of non-immune origin which recognize diverse sugar structure with high degree of specificity in non-catalytic manner. They have been implicated in cellular signalling, malignancy, host pathogen interactions, scavenging of glycoprotein from the circulatory system, cell-cell interactions in the immune system, differentiation and immune responses and protein targeting to cellular compartments (Sharon, 1989).
Objective
Isolation of endophytic fungi
Isolation, identification and characterization of lectins.
Structural elucidation of lectin.
Insilico studies of lectin interaction with possible target sites.
Materials and methods
Chapter: 1
Collection of plant and Isolation, identification of endophytes from Viscum album a) Collection of Plant Material
Hemi-parasitic Plant material Viscum album growing on Pongamia was collected from D.C Bungalow, Sira Gate, Tumkur, Karnataka, India during January 2011.The collected plant was authenticated
b) Isolation of endophytic fungi Endophytic fungi isolation was carried out under aseptic condition by the method of (Santos et al., 2003) with minor modification.
c) Identification of endophytic fungi

Isolated endophytic fungi was identified and characterization on the basis of morphology and microscopic studies, from the endophytic fungal isolates (Barnett 1972, Subramanian 1971).
Chapter: 2 Isolation, purification and partial characterization of endophytic fungal and plant lectin
a. Mass production of identified fungi
Identified fugal species were cultured on czapek dox broth for large scale cultivation which was then incubated at room temperature 300 C for 7 days.
b. Extraction of lectin from Viscum album The leaves of the Viscum album plant were grinded to powder for the extraction of lectin (Olsnes et al., 1994).
c. Extraction of lectin from endophytic fungus Identified endophytic fungus was cultured in a 500 ml erlenmeyer flasks containing 150 ml czapadox broth and incubated at room temperature 26 ±20 C under stationary conditions. After 10 days, the mycelial mat was harvested for the extraction of lectin (Cao et al., 2010).
d. Protein determination The protein concentrations of the dialyzed protein sample from plant and endophytic sample was determined by the method of Lowry’s (1951).
e. Assay of hemagglutinating activity a. Collection of blood samples
Blood groups of A, B, AB and O are collected from healthy individuals in the Department of Biotechnology, S.I.E.T College, Tumkur, Karnataka, India.
b. Assay for lectin activity In the assay for lectin (hemagglutinating) activity according to (Bing et al., 1967)
Chapter: 3 Proteomic analysis Identification of protein (Lectin) from endophytic fungi Aspergillus flavus & Fusarium oxysporum by MALDI-TOF Mass Spectrometry
a. Lectin sample
Purified endophytic fungi Aspergillus flavus lectin sample was used for the identification of protein using MALDI-TOF-MS (At Molecular Biophysical Unit, IISC,Bangalore).
b. In-gel digestion of protein spots Protein digestion was performed as described previously (Natarajan et al., 2005).
Chapter: 4 a. Insilico docking studies:
Lectin docked with potential targets sites and E. value will be analyzed.

CONCLUSION
Alternative source for the lectin, may be the potential therapaeutic application for the treatment for cancer and HIV.
37. LOW COST SEED FEEDING UNIT
COLLEGE: BGS INSTITUTE OF TECHNOLOGY, B G NAGAR, BELLUR, MANDYA
GUIDE: RAJARAM
COLLEGE STUDENTS: VINAY KLUMAR C V, PRAKRUTHI N
SCHOOL STUDENTS: NIHARIKA H R 9TH std, SRI BHATHANATHESHWARA HIGH SCHOOL.
Introduction Seed feeder is a device that sows seed into rows in the soil, before covering them up. Seed feeding can only be done when the weather and soil conditions are right as the seeds have to be sown at the correct depth and immediately covered. This will not be possible if the ground is too wet or the soil is too cloddy. Often feeding is followed by rolling which consolidates the soil and improves germination. Seed feeder also called Seed drill are available in two forms, in a first type a Seed feeder is a separate device which is built only to serve that purpose. Another type is built to serve the same purpose along with tractor. The first type is mainly used in western and other developed countries where the farmers are having large farms. But in India and other south Asian countries most of the farmers are having small farms. This restricts to go with the first type because of lot of investments. The second type is most suitable for our farmers’ conditions. In older methods of planting, a field is initially prepared with a plough to a series of linear cuts known as furrows. The field is then seeded by throwing the seeds over the field, a method known as manual broadcasting. Seeds that landed in the furrows had better

protection from the elements, and natural erosion or manual raking would preferentially cover them while leaving some exposed. The result was a field planted roughly in rows, but having a large number of plants outside the furrow lanes. There are several downsides to this approach. The most obvious is that seeds that land outside the furrows will not have the growth shown by the plants sown in the furrow, since they are too shallow on the soil. Because of this, they are lost to the elements. Since the furrows represent only a portion of the field’s area, and broadcasting distributes seeds fairly evenly, this results in considerable wastage of seeds. Less obvious are the effects of over seeding; all crops grow best at a certain density, which varies depending on the soil and weather conditions. Additional seeding above this limit will actually reduce crop yields, in spite of more plants being sown, as there will be competition among the plants for the minerals, water and the soil available. Another reason is that the mineral resources of the soil will also deplete at a much faster rate, thereby directly affecting the growth of the plants. The solution to above drawback is to feed the seeds on the furrows manually with proper spacing. But this method is more time consuming, requires more manual workers and also costlier. The following are the steps involved in traditional (manual) seeds feeding.
Create path on the land by using plough.
Feeding the seeds into this path with a appropriate distance between the seeds manually.
Spreading the fertilizer along the path manually
Fill the path with sand by using cultivator. The process is very lengthy, time consuming and also it requires more labour.
OBJECTIVES The project aims at developing a highly cost effective equipment, to demonstrate the application of seeds feeder in agriculture land by combining all the above four activities into a single activity. And the equipment should accomplish both the objectives i.e. cultivating the land with seeds feeding at the same time. And also, project aims to help and encourage farmers, where the farmers suffer lot from labour problems and higher investment. The main objectives of the design are as follows:
It should feed the seeds in a furrow at a proper distance
It should occupy as small space as possible and be economical.
It should reduce time, cost and number of labours for seeds feeding.
It should be user friendly.

Following are the main constraints for the design:
Durability: The equipment has to be constructed strong enough so that it could with stand variable loads without failure over long period.
To match the rotational speed of feeding unit with the tractor linear speed
Space requirement: It should be as compact as possible to fit in a cultivator.
Flexibility: The equipment has to be flexible to adjust distance between each seed. Working Procedure The underlying principle is a phenomenon of making grooves on a periphery of disc which pick the seed from seeds hopper and drop into the furrows created by cultivator blades. To fulfil the above procedure the disc shaft has to rotate at a required speed, this can be achieved by converting linear speed of the tractor into rotational speed of the cultivator using power wheel. This power wheel is used to rotate the disc shaft through chain drive and the rotated shaft will pick and drop the seeds. The “Seed Feeder” consists of following 1. Seeds hopper and its assembly. 2. Seed pick and drop unit. 3. Power wheel. Proposed Design for Seed Feeder Unit The design of seed feeder consists of two phases. The first phase deals with the process i.e. how the equipment should be designed to fit for the purpose. The second phases deals with the strength and other mechanical properties of the equipment to withstand the different forces encountering during working. Process design The process designed by considering the tractor speed at 5km/hr and 10km/hr. It is better to run the tractor at 5km/hr or between 5 to 10 km/hr for the better output. Here liner speed of the tractor or cultivator is converted rotational speed of the seed feeder. Hence it is possible to vary the rotational speed of the speed feeder without varying the tractor linear speed by varying the power wheel diameter. The process is designed based on the requirement of the distance between each seed is to be feeded on the ground .The different seeds requires different distance between each seed. For example:
The maize which is grown for commercial purpose requires approximately 10 to 15 cm between each. The distance is based on the fertility of the land the farmer
The maize which is grown to animal requires spreading on the furrow.
The groundnut, beans and other requires 8to 10 cm between each.
The ragi requires simply spreading on the furrow. 3.1.1 Design of Power Wheel The power wheel is designed to have two different diameters to vary the rotational speed. The two different diameters are: (1) 30 cm (2) 45cm Design of Seed Collector And Drop Disc The seed collector and drop disc is designed to fit for the several seeds. The disc is having 12 grooves (each grooves at an angular spacing of 30º) on its periphery. The advantage of having grooves at an angular spacing of 30º is to vary the number of grooves on a periphery without disturbing equal angular spacing. It is done by fill up the grooves by some form adhesive like metal parts etc. Seed feeder metal frame assembly The metal frame assembly is supporting, covering and load carrying members. All the mechanism and assemblies are aligned to each other and rigidly fixed to metal frame. The structure is subjected to various forces and it is essential that it does not deform or vibrate beyond the permissible limits under the action of these forces. All components of the device must remain in correct relative position with the metal frame to maintain geometric accuracy, regardless of magnitude and direction of the forces. The metal frame assembly consists of the following parts.
Seed Feeder Frame and Other Parts The mechanical core of a seed feeder, the frame provides points of attachment for the various components that make up the machine. The metal frame is made up of sheet metal having thickness equal to 3 mm and an L-angle plate of thickness 4 mm. Both sheet metal and L-angle plates are made up of mild steel. The other part of frame includes power wheel, power wheel supporting column, seed hopper etc. Base Base is mild steel rectangular box having size of 1660x180x140 mm. A flat sheet of thickness 3 mm is taken and is bending to the above dimensions. The disc is placed inside the box. All the parts are rigidly fixed to the box. This box is rigidly fixed to the cultivator.

Column It is a part of a structural frame which is used to support the power wheel one side of the column is filled to the base and other side power wheel is fitted.
Chain Drive
A chain-drive system uses one or more roller chains to transmit power. Bush roller chain is used to transmit the rotary motion of the crank produced by pedalling to rotary motion of free wheel. The power is conveyed by a roller chain, known as the drive chain or transmission chain, passing over a sprocket (crank), with the teeth of the free wheel meshing with the holes in the links of the chain. The crank is turned, and this pulls the chain putting mechanical force into the system. Crank with pedals and crank arm are supported on bicycle frame. The free wheel is mounted on the axle of the rear wheel. Advantages of chain drive:
No slip takes place; hence perfect velocity ratio is obtained.
It gives fewer loads on the system.
It gives high transmission efficiency.
Suited for short centre distance
It can be operated at adverse temperature and atmospheric condition. CONCLUSION

Time taken for seeds feeder to cover this land is equal to two hours.
Compared to manual working time saving is 6 hours that is 75% of time saving.
Compared to manual working cost saved Rs. 200 / hectare
It is possible to quadruple the manual work by this unit Seeds feeder can be used on land only when moisture content land is not so high. If the moisture content is too high the heavy weight of the tractor becomes big problem. The use puff seeds feeder may also disturb the Indian cultivation methods. In some places it may create unemployment problem. Benefits
Energy: No external energy is used to drive the equipment.
Time: Lot of time saving compared to traditional method.
Cost: Reduction in expenditure.
A good solution where agricultural work saving labour problems. Limitations
Disturbs the traditional agriculture methods.
Use is limited to persons having tractor with them.
Not possible to use when the land is too wet. Scope of Improvement Use of variable speed motor instead of power wheel makes the application more flexible.
38. USE OF FENUGREEK SEED AND TURMERIC RHIZOME IN DIET AS
HYPOLIPIDEMIC SUPPLEMENTS
COLLEGE: VETERNARY COLLEGE, HASSAN.
GUIDE: Dr. HEMANTH GOWDA K, Dr. RAVIKUMAR P,
COLLEGE STUDENTS: BENDRE M SUMANTH, SHYLESH P
SCHOOL STUDENTS: HARSHITH M N 9TH std, SWAROOPA M 9TH std, GHS MALALI, HASSAN.
ABSTARCT

An experimental study was conducted to evaluate the hypolipidemic effects of fenugreek seeds and turmeric rhizome powder and their combination in dyslipidemia induced Wistar albino rats. After an acclimitization period of four weeks, rats were randomly divided into four groups of twelve rats in each group. All the four groups were fed with the normal diet in addition to gavaging of high fat diet (HFD) made up of dalda and coconut oil at the rate of 10 ml/kg body weight per day for four weeks. After four weeks, Group I was fed with the normal diet during the next four weeks of experimental period that served as dyslipidemic control group. The Group II, III and IV received fenugreek, turmeric and their combination by gavaging in addition to normal diet for subsequent four weeks. Group II was maintained on fenugreek seed powder (4g/kg body weight per day), Group III was maintained on turmeric (400mg/kg body weight per day) and Group IV was maintained on fenugreek (2g/kg body weight per day) and turmeric (200mg/kg body weight per day) combination.
The groups that received fenugreek and turmeric showed a significant (P<0.05) decrease in total cholesterol concentration by 2nd week of supplementation when compared to dyslipidemic control. The group that received the combination of fenugreek and turmeric showed significant (P<0.05) reduction in total cholesterol by 4th week compared to dyslipidemic group. Further, by 4th week of herbal supplementation, the fenugreek received group and the group that received both fenugreek and turmeric showed significantly reduced total cholesterol compared to the previous observation on 2nd week of supplementation indicating fenugreek and the combination of fenugreek and turmeric were more hypocholesterolemic compared to turmeric alone.
The HDL cholesterol concentration in the group that received both fenugreek and turmeric was significantly (P<0.05) increased by 2nd week of supplementation itself and the trend continued by 4th week of supplementation also. The study suggested that either fenugreek or turmeric alone did not improve the levels of serum HDL-C but the increased levels of HDL-C could be attained by combination of fenugreek and turmeric which is a physiological benefit.
The serum triglyceride concentration was significantly (P<0.05) lower in fenugreek supplemented group and fenugreek and turmeric received group by 2nd week of supplementation. Whereas, all the three herbals received groups showed significantly (P<0.05) reduced serum triglycerides by 4th week of observation. From this it was evident that fenugreek was more hypotriglyceridemic compared to turmeric supplememtation.
The serum LDL Cholesterol concentration was significantly (P<0.05) lower in turmeric supplemented group by 2nd week of supplementation compared to dyslipidemic control. Whereas, all the three groups that received herbals showed significantly (P<0.05) reduced serum LDL-C by 4th week of observation. From this it was evident that turmeric was more hypolipidemic with respect to LDL-C compared to fenugreek supplementation.
The serum VLDL Cholesterol concentration was significantly (P<0.05) lower in all the herbal supplemented groups on 2nd week of herbal supplementation compared to previous week observation but was non-significant (P>0.05) compared to dyslipidemic control group. These herbal supplemented groups showed significantly (P<0.05) reduced VLDL cholesterol on 4th week of supplementation compared to control.
The histopathological observations of the sections of aorta, liver and kidney after four weeks of fenugreek, turmeric and their combination supplementation were physiologically recovery from some of the changes such as accumulation of lipid droplets, inflammatory cells, lipid plaque formation, mild fatty changes, congestion, degeneration and necrosis when compared to

dyslipidemic rats in respective groups which was prior to initiation of the herbal remedies. This suggested that the fenugreek, turmeric and their combination act as antiatherogenic agents and hepatoprotective as well as nephroprotective.
In conclusion, the supplementation of fenugreek seed powder, turmeric rhizome powder and their combination exhibited antihyperlipidemic and antiatherogenic properties and could be used as herbal remedies during altered conditions and also for physiological wellbeing.
Pic 1 Pic 2
Pic 1: Hyperlipidemic rats showing oily or glassy appearance in different visceral organs. Pic 2: Hyperlipidemic rats showing congestion and necrotic changes in liver.
Hyperlipidemic rats showing accumulation Hyperlipidemic rats showing accumulation of fat around the kidney. of fat around the heart.

Fenugreek seeds powder Turmeric rhizome powder
Wistar Albino Rats Gavaging Rats
39. POTHOLE REPAIRING
COLLEGE: GOVERNMENT ENGINEERING COLLEGE, HASSAN.
GUIDE: CHETHAN B A
COLLEGE STUDENTS: SAHANA SURESH, SACHIN K C, SOWMYASHREE, SIDDHALINGA SWAMI G H
SCHOOL STUDENTS: AJAY T P 9TH std, SUMANTH K R 9TH std; GOVT BOYS HIGH SCHOOL.
ABSTRACT:
Highway forms a major mode of road transportation. Each and every individuals use road either for travelling or for transportation of goods etc. Thus for safe and comfortable

journey on road it is important to have good and sound roads. At the same time, time to time maintenance is very much essential for the proper working and functioning of the road.
Maintenance of bitumen pavement surface includes filling of pot holes, correcting the cracks, repairing and replacing of a part entire pavement surface. Pot holes are one of the major issues of bitumen pavements. Pot holes if not rectified and corrected when it is small it may lead for some serious accidents resulting in huge loss of life.
As asphalt pavements age and deteriorate the need for corrective measures to restore safety and ride ability increases. Thus the need for developing effective and economical method of overcoming the pot hole problems is very much needed. The present methods of pot hole filling are either not strong enough or it is a costly affair or it is not employed because of complex operation methods.
In this report various methods have been proposed for filling of pot holes. The methods adopted are easy effective, economical and provides homogeneity of the finished surface. The main intention is to provide a patch of same mix as of existing pavement surface and fused to make it a single entity. Even the method is adopted for repairing of small alligator cracks.
INTRODUCTION: Pot holes problem is commonly seen in all roads all over the world and are inevitable. These are the holes or pits created in the roads due to many reasons such as action of water, insufficient compaction, and heavy traffic load; it is more rapid during rainy seasons etc…
Thus to maintain the roads in a good and safe condition for the road users it is very much necessary to carry out the regular monitoring and repairing of pot holes. Pot holes treated in an initial stage is much needed in order to make it economical as if it grows bigger it becomes unsafe of road users and also costly affair as the worst condition may demand for complete replacement of the pavement.
There are many methods available for filling of pot holes from a common method as throw and go method to a superior method such as using of infrared technology. But use of inferior method is inefficient in serving the purpose and superior methods are expensive. This makes the need of developing some techniques which can repair potholes permanently and are cost effective.
Need for Pothole Repair The decision to patch potholes is influenced by many factors:
1. The level of traffic. 2. The time until scheduled rehabilitation or overlay. 3. The availability of personnel, equipment, and materials. 4. The tolerance of the traveling public.
Necessity of filling pot holes:
1. To ensure proper safety for road users

2. To avoid further damage to the pavement surface. 3. To avoid damage to the sub base and sub grade soil. 4. To avoid any accidents of vehicles. 5. To provide comfort for the road users. 6. To maintain good aesthetics of the road. 7. To decrease the travelling time and thereby decreasing the traffic density on the
road.
OBJECTIVES: Following are the main objectives of the project:
1. To develop the new, easy and economical technique of pot hole repairing. 2. To develop technique which can give a nearly permanent solution for pothole
repairing? 3. To achieve the homogeneity of the finished pavement surface after the patch work. 4. To suggest the different economical compaction equipment to compact the filling. 5. To develop the pre cast bitumen pavement surface to repair pothole instantaneously.
SCOPE: This report describes materials and procedures for the repair of potholes in asphalt-surfaced pavements. The materials and procedures for different methods of pot hole filling are discussed briefly. New techniques are introduced for filling of pot holes and are compared with the existing conventional methods such as throw and go method, throw and roll method, semi-permanent method and cold mix. The methods which are superior demands for expensive machines such as python etc… Therefore new cost effective methods of repairing pot hole are proposed. Old repair Techniques:
1. Throw and go method 2. Throw and roll method 3. Semi-permanent method 4. Spray injection method 5. Edge seal method 6. Cold mix application
NEW PROPOSALS:
From the previously mentioned draw backs it is clear that the patch work is inefficient due to insufficient bonding between the old and new materials. To overcome these problems fusion of the materials can be done. This can be achieved by heating the circumference of the old bitumen surface and then filling the pot hole with new hot mix of bitumen and fusing it under pressure so that the proper bonding between new and old materials are achieved and the homogeneity of the surface becomes possible.
The two main methods are proposed for filling of pot holes:
1) Fusion method

2) Pre casted sheet method
1) FUSION METHOD:
It has been observed that the patch work becomes weak or it strips off easily from its edges because of poor bonding between the existing pavement surface and the new fill which give rises to the deterioration of the pavement surface on the same place again and again and also the pavement will have the uneven surface by having the projection of the filled mix.
This problem can be avoided by the introduction of fusion technique is in order to give the proper bonding to both the materials. This is based on the simple principle that the bitumen melts with the increase in the temperature. The bitumen surface is heated at certain temperature so that it starts to become soft and then the new mix is placed and compacted together. This makes the materials to fuse together and the existing materials can hold the new materials effectively. Once the filled material hardens together the heated existing materials the surface behaves monotonously giving near to homogeny appearance.
Cheaper heating techniques:
Following methods are proposed for heating of existing surface are:
a) Crude method b) Electrical heating method c) Heat transfer method d) Using gas burners
a) Crude method:
In this method the road surface is heated directly by sprinkling ignitable liquids such as spirit or alcohol on the edge surface of the pot holes and ignited directly.
It is crude, cheap and quick method, as the pot-hole can be ignited by using cheap alcohols such as methalene or spirit. This can be adopted for small works and in remote places where the other heating equipments are not readily available. The pot-hole is ignited directly; hence the heat transfer is maximum.
Steps:
1. Clean the surface of pot hole and remove all the loose materials from it. 2. Now sprinkle a small amount of the spirit circumferentially on the edge surface of
the pot hole and ignite it until the existing surface softens. 3. Now place the new mix of bitumen not more than 40mm for one layer and compact
it well with any compacting methods such as rollers, vibrators truck tires etc… 4. Open the road for public use as soon as the fill hardens.

b) Electrical heating method:
In this method the surface or edges of pot-hole is heated by using electrical equipment’s (based on electrical resistivity concept, using coils). An electrical instrument of suitable dimension or diameter is used so that when a certain amount of current is passed through it, the surface of edges of pot hole is heated up and the bitumen starts to softened. It is possible to have control over the temperature and thus proper quality is possible.
Steps:
1. Place the coil over the pothole so that the coil heats up the edge surface of it. 2. After existing surface softens sufficiently the hot mix is placed and compacted using
rollers, vibrators or truck tires etc… 3. Road is opened for public after the fill hardens sufficiently.
c) Heat transfer methods:
Here in this method the heat is transferred to the existing pavement surface by indirect method of heating. In this method loss of energy would be more as heat has to be passed through a material and may require much time to bleed.
Steps:
1. A plate or sheet good which is good conductor of heat is placed on the pot-hole and fire is ignited on the plate using ignitable materials such as coal or fire wood, etc… and pavement is made to soften
2. Hot bitumen mix is poured into the pot-hole and compacted using rollers, vibrators or truck tires etc…
3. Road is opened for public after the fill hardens sufficiently.

d) Gas burners:
In this method the pot-hole surface is heated by using gas burners (such as L.P.G or oxy-acetylene). This method is quite quicker and using gas cylinders. It is portable and can be conveniently carried to the site and much adoptable.
Steps:
1. Using the suitable fuel and burners, the surface of pot-hole is directly brought in contact with fire so that bitumen of the existing pavement softens quickly form the exposed surface.
2. Then the hot bitumen mix is poured into the pot-hole and compacted using rollers, vibrators or truck tires etc…
3. Road is opened for public after the fill hardens sufficiently.
PRE-CASTED SHEET METHOD:
This is a new approach for repairing of pot holes where the bitumen layer is pre casted in the factory and then laid used for repairing of pot holes. Repairing of pot hole is a heavy job which demands for a large number of labours and heavy machineries.
The agencies taking up the work either go for cheaper methods intern resulting in inferior works or for superior methods which shoots up the cost highly. Thus development of such a method is necessary where the cost is moderate and there is no compromise in quality, which is also less time consuming.
The precast of a bitumen layer is prepared as per the road specification and the requirements and then brought to the site and placed as explained below
Steps:
1. The pot hole to be repaired is first trimmed and brought to the rectangular or square shape using a road cutting equipment.
2. Now it is cleaned for any loose materials and then the depth beyond 20mm is filled with aggregates and compacted well.
3. A layer of tack is applied.

4. Now the precast bitumen sheet is cut to the size of pot hole and is placed on in the hole with rough side downwards.
5. The fusing of the new and old layers is carried out by heating both surfaces and compacting them or applying binders on sides suitably.
Compaction equipment’s:
For pot-hole compaction regular rollers are used. But it would be difficult to attain maximum compaction, because when a roller base have size greater than the size of pot-hole, the load of roller is carried by the pre-existing road surface than the material at pot-hole. Thus optimum compaction cannot be attained which would result in frequent formation of pothole in the same place. In order to over-come this problem we can use a smaller rollers according to the size of the pot-hole so that maximum load is exerted on the filled material and maximum compaction is attained. For getting maximum load in smaller dimension rollers we can go for filling the rollers with materials of high specific gravity such as lead.
Binders:
In case of bitumen pavements, the aggregates of filled material and pre-existing material has to be bind properly so that the water doesn’t percolate into the pot-holes. So we can make use of artificial binders and resins to bind them. After filling the bitumen mix into the pothole the edges of pot-holes may be coated with water-proof binders so that life of the road surface increases.
CONCLUSION:
By new techniques, pot-holes can be effectively filled with ease and the process being economical. These techniques can give a permanent solution for the pot-hole problems. With these techniques we can achieve a homogeneous pavement surface even after the filling the pot-hole. We can repair more pot-holes with less time by using pre-cast bitumen sheets. We can obtain optimum compaction in pot-holes using new compacting devices and machineries. Binder’s usage avoids the further entry of water through cracks along the sides of the pot-holes. Thus by our new methods we can attain a homogeneous pavements economically.

40. STABILIZED MUD BLOCKS
COLLEGE: GOVERNMENT ENGINEERING COLLEGE, HASSAN.
GUIDE:
COLLEGE STUDENTS: DAYANANDA N, MANJUNATHA M, JAGADEESHA G, YASHASWINI K.
SCHOOL STUDENTS: VIJAY KUMAR B S 9TH std, AMIT G A 9TH std, GOVT BOYS HIGH SCHOOL.
ABSTRACT Red mud is a solid waste produced in the process of alumina production from bauxite following the Bayer process. More than 4 million tons of red mud is generated annually in India only. Presently, it is stored or dumped on land, or in the oceans near alumina refineries. However, its high alkalinity is a potential pollution to threat water, land and air. While high costs are associated with the large area of land required for storage of the residue. India is amongst the major producers of alumina in the world. There are some differences in mineralogical composition between the residues from India and other countries due to the difference in the ore type in its production processes. Significant achievements in treatment and utilization of red mud have been obtained in India in the last decade. In this paper, the various proposals for the utilization of red mud generated in India are presented. Similarly, the drawbacks associated with these potential commercial applications of red mud are discussed. INTRODUCTION Earth is the oldest material used by man. People have used their native ingenuity to develop forms for the utilization of earth ranging from the extremely simple to highly complex. They have used the material in response to varying resources, social needs and site conditions. With the individual revolution, people had access to machines, easily available fossil fuels and a range of newly developed materials. New technologies became popular and earth construction skills were lost or regulated to the vernacular builder. Impetus was given to earth architecture in the post-world war II era due to economic and energy saving concerns. However, as western nations worked their way to prosperity, the use of earth was eclipsed by a desire for modernity. Earth has always been the most widely used material for building in India and is a part of its culture. Traditionally, mud construction varies enormously with topography, climatic condition and needs of different regions. The common methods used for earth construction are cob, wattle and daub, rammed earth, and adobe. Production and characterization of red mud After digestion, bauxite residue (also known as red mud), is separated, washed and disposed of. Bauxite residue is highly alkaline in nature and contains oxides and salts of six major oxides of Fe, Al, Ti, Si, Na, and Ca, and a variety of trace elements. Typically it contains in the region of15 to 20 different mineral phases. Around 1.5–2.5 tonnes of red mud are

generated per tonnes of alumina produced, depending on the bauxite source and alumina extraction efficiencies. In India, alumina plants have 1.692 million tons of annual capacity with metal production of 0.6 million tonnes per annum and generate about 2 million tons of red mud every year ).Red mud, as the name suggests, is brick — red in color and slimy, having an average particle size of b10 μm. A few particles greater than20 μm are also available (represents the total red mud generation in different industries. It is comprised of different compounds of iron, titanium, and silica along with other minor constituents. It is alkaline, thixotropic and has a high surface area in the range of 13–16 m2/g with a true density of ~3.30 g/cm3. The alumina, silica and soda account for about 30–40% of the total red mud and the res tare mostly in the form of iron and titanium oxides. The chemical composition of the red mud (data, collected from Indian industries) is shown in Thermal behaviour and physical properties of red mud have been analysed by DTA and XRD techniques(The characterization of structural cat ions in red mud has been observed by UV–viz-NIR spectroscopy). Advantages of making red mud bricks
Brick-making is the largest building industry, and can consume most of the red mud waste to solve the disposal and pollution problem. This will require additional consumption of agricultural land (clay).
They have good architectural value as face bricks. Better bonding in the bricks. Red mud compositions give bricks pale brown, orange or golden yellow color depending upon the composition of the raw material and firing temperature. The building Materials Technology Promotion Council (BMTPC) has produced a composite from red mud and polymer and natural fibres, called Red Mud Jute Fiber Polymer Composite(RFPC), to replace wood in the wood based panel products in the building industry. This newly developed material is particularly suitable for door shutters, ensuring significant savings in initial as well as maintenance costs. This product uses zero energy aided raw materials and conserves energy by room-temperature processing. RFPC, this composite contains ferric oxide, alumina and titanium oxide from red mud, 82.5% cellulose with 11.3% lignin from its jute component(jute is 15% of the total volume of the shutter). RFPC can also be used for furniture, flooring and panelling work. Red mud can be used for making high quality exposable bricks, tiles, corrugated roofing sheets and as binder for several products including composite doors, panels etc. India has produced burnt clay bricks by partially replacing the clay with red mud and fly-ash. In that process, red mud was expected to find a major use in building and construction areas. Efforts have also been made to incorporate a small percentage of lime into the red mud. The optimum moisture content was tested by making bricks and testing their strength and stability against the erosive action of water. A maximum wet compressive strength of 3.75 MN m−2 with 5% lime and 4.22 MN m−2 with 8% lime was found. The brick samples were for tested for accelerated weathering and found suitable for use as walling material for low cost shelters. The reactivity of red mud components on heating may promote ceramitization and shrinkage and apart from other qualities may affect the mechanical features of clay-based items fabricated with bauxite waste addition. It is reported that a new ceramic material has been developed from clay and red mud.
The presence of 4–5% of alkali in red mud provides good fluxing action resulting in good plasticity
Merits and demerits of various methods of disposal of red mud
Method
Slurry disposal, Dry mud disposal, Sea/Lake disposal, Solar drying
Merits
Return of caustic to plant; cheaper mode of transport; low infrastructure investment; natural surfaces can be used for providing banks
Environmentally preferred; requires less space; consolidate rapidly
No investment on ponds; moderate investment on machinery for transportations; lower energy requirement
Area required is less than that for slurry disposal but more than that for dry disposal; reduced soluble soda losses.
Demerits
Large space requirements; higher storage cost, high investments for building ponds; potential pollution hazards; continuous need for enlargement of ponds or erection of new ponds; reclamation of area is expensive and time consuming.
High investment costs on machinery for concentrating the slurry and pumping; higher energy and expensive earth moving equipment.
No return water and hence less recovery of caustic; harmful to marine organisms in the long run; should be dumped at depths exceeding 3000 m; extensive pipe line requirements.
Requirements stand-by method for use during rainy seasons; large requirements of even surfaces; need for pumping rain water.
COMPRESSED STABILISED EARTH BLOCKS
The first attempts for compressed earth blocks were tried in the early days of the 19th century in Europe. The architect François Cointeraux precast small blocks of rammed earth and he used hand rammers to compress the humid soil into a small wooden mould held with the feet. The first steel manual press which has been produced in the world in the 1950’s was the Cinvaram. It was the result of a research programme for a social housing in Colombia to improve the hand moulded & sun dried brick (adobe). This press could get regular blocks in shape and size, denser, stronger and more water resistant than the common adobe. Since then many more types of machines were designed and many laboratories got specialized and skilled to identify the soils for buildings. Many countries in Africa as well as South America, India and South Asia have been using a lot this technique. The soil, raw or stabilized, for a compressed earth block is slightly moistened, poured into a steel press (with or without stabilizer) and then compressed either with a manual or motorized press. CEB can be compressed in many different shapes and sizes. For example,

the Aurum press 3000 proposes 17 types of blocks for producing about 75 different blocks. Compressed earth blocks can be stabilized or not. But most of the times, they are stabilized with cement or lime. Therefore, we prefer today to call them Compressed Stabilized Earth Blocks (CSEB).The input of soil stabilization allowed people to build higher with thinner walls, which have a much better compressive strength and water resistance. With cement stabilization, the blocks must be cured for four weeks after manufacturing. After this, they can dry freely and be used like common bricks with a soil cement stabilized mortar.
METHODOLOGY RAW MATERIALS The primary raw material for the production of SCEB is raw earth or soil. OPC cement in small quantities and water are other constituents, coarse sand or stone dust may be added depending on soil quality. Soil is made up of grains of various sizes. The grain size distribution of a soil determines its suitability for the manufacture of SCEB.
PROCESS
The production of CSEB is based on the principle of densification of raw earth mixed with stabiliser (cement or lime) in small quantities ranging from 5 -10% by weight of the mix. The production process incorporates 3 main stages.
Sieving: Filling the mould. humid and wet curing Batching : Moulding final stage Mixing: Block ejection, transportation and stacking.
ADVANTAGES OF CSEB
A local material Ideally, the production is made on the site itself or in the nearby area. Thus, it will save the transportation, fuel, time and money.
A bio-degradable material Well-designed CSEB houses can withstand, with a minimum of maintenance, heavy rains, snowfall or frost without being damaged. The strength and durability has been proven since half a century. But let’s imagine a building fallen down and that a jungle grows on it: the bio-chemicals contained in the humus of the topsoil will destroy the soil cement mix in 10 or 20 years… And CSEB will come back to our Mother Earth!
Limiting deforestation Firewood is not needed to produce CSEB. It will save the forests, which are being depleted quickly in the world, due to short view developments and the mismanagement of resources.
Management of resources Each quarry should be planned for various utilizations: water harvesting pond, wastewater treatment, reservoirs, landscaping, etc. It is crucial to be aware of this point: very profitable if well managed, but disastrous if unplanned!
Energy efficiency and eco friendliness Requiring only a little stabilizer the energy consumption in a m3can be from 5 to 15 times less than a m³ of fired bricks. The pollution emission will also be 2.4 to 7.8 times less than fired bricks.
Cost efficiency Produced locally, with a natural resource and semi-skilled labour, almost without transport, it will be definitely cost effective! More or less according to each context and to one’s knowledge!
An adapted material Being produced locally it is easily adapted to the various needs: technical, social, cultural habits.
A transferable technology It is a simple technology requiring semi skills, easy to get. Simple villagers will be able to learn how to do it in few weeks. Efficient training centre will transfer the technology in a week time.
A job creation opportunity CSEB allow unskilled and unemployed people to learn a skill, get a job and rise in the social values
Reducing imports Produced locally by semi-skilled people, no need import from faraway expensive materials or transport over long distances heavy and costly building materials.
Flexible production scale Equipment for CSEB is available from manual to motorized tools ranging from village to semi industry scale. The selection of the equipment is crucial, but once done properly, it will be easy to use the most adapted equipment for each case.
Social acceptance Demonstrated, since long, CSEB can adapt itself to various needs: from poor income to well off people or governments. Its quality, regularity and style allow a wide range of final house products. To facilitate this acceptation, banish from your language “stabilized mud blocks”, for speaking of CSEB as the latter reports R & D done for half a century when mud blocks referred, in the mind of most people, as poor building material.
SOME LIMITATIONS OF CSEB
Proper soil identification is required or unavailability of soil.
Unawareness of the need to manage resources.
Ignorance of the basics for production & use.
Wide spans, high & long building are difficult to do.
Low technical performances compared to concrete.
Untrained teams producing bad quality products.
Over-stabilization through fear or ignorance, implying outrageous costs.
Under-stabilization resulting in low quality products.
Bad quality or un-adapted production equipment.
Low social acceptance due to counter examples (By unskilled people, or bad soil & equipment).

41. DESIGN OF HYDRAULICALLY OR PNEUMATICALLY CONTROLLED HAND
GLOVES FOR A PARALYSED PERSON TO REDUCE SPASTICITY
COLLEGE: H M S INSTITUTE OF TECHNOLOGY, KYATHASANDRA, TUMKUR.
GUIDE: DR. VIJAYA VITTALA C B
COLLEGE STUDENTS: CHANDAN S, KIRAN G N, SUNIL K R, BURHAN PASHA C S
SCHOOL STUDENTS: SWAROOP G S 10TH std, SIDDAGANGA HIGH SCHOOL, TUMKUR; NIRANJAN SHARMA 8TH std, MARUTHI VIDYA KENDRA,TUMKUR.
Hypothesis: In India according to countrywide study on disability by the National Sample Survey Organization about 1.9% of the total population of the country have physical or sensory disabilities which include visual, speech, hearing, and Locomotors disabilities. In the study locomotors disability was defined as "the loss or lack of normal ability of an individual to move himself / herself and/or objects from one place to another". It may occur due to:
Paralysis of the limb or body
Deformity in the limb(s)
Loss of limb(s)
Dysfunction of joints of the limb(s)
Deformity in the body other than that in the limb (e.g. deformity in the spine, or in the neck or dwarfing or stunting)
Paralysis
Paralysis is loss of muscle function for one or more muscles. Paralysis is most often caused by damage in the nervous system, especially the spinal cord. Other major causes are stroke, trauma with nerve injury, poliomyelitis, cerebral palsy, peripheral neuropathy, Parkinson's disease, spina bifida, hyper tension, diabetes mellitus etc.
Primary goals of stroke management are done which includes reduced brain injury and promotion of patient recovery. Once the patient is medically stable, our focus shifts to reducing the patient’s disability and handicap through rehabilitation.
During rehabilitation, it is often observed that the muscles affected develop many
potential features of altered performance including decreased motor control,
weakness, clonus, exaggerated deep tendon reflexes, decreased endurance and
spasticity.
Spasticity

One of the common sequels to stroke is spasticity. The role of spasticity is over-emphasized
in stroke rehabilitation, as it is a widespread problem in paralysis. It has been estimated that
approximately 65% of individuals develop spasticity following stroke and studies have
revealed that approximately 47% of stroke victims may still have spasticity at twelve months
post stroke. It is more prevalent in younger patients.
Spasticity is defined as “a motor disorder characterized by a velocity dependent increase in
tonic stretch reflexes that result from abnormal intra-spinal processing of primary afferent
input”. The common clinical features seen in spasticity are muscle imbalance (co-
contraction, co-ordination, lack of selective control), muscle weakness, contracture and
progressive joint deformity.
In order to treat spasticity, measurement of spasticity is essential to assess the response to treatment. Spasticity at any particular instance is dependent on several factors including presence of noxious stimuli, the physical and mental status of the patient, and the position of the body. Different methods are available to measure spasticity. Few of the commonly used methods are Ashworth scale, modified Ashworth scale, Tardieu method etc. Here, we have designed a suitable device to measure spasticity targeting the following goals. i. Improved mobility
ii. Improved positioning
iii. Decreased spasm frequency
iv. Decreased pain
v. Increased ease to perform day-to-day activities Spasticity treatment should be based on the assessment of each patient.
For spastic muscles with mild to moderate impairment, exercise should be the main stay of management, under the guidelines of health professionals.
Muscles with severe spasticity are likely to be more limited in their ability to exercise and may require help to do this. They may require additional interventions to manage the greater neurological impairment and also the greater secondary complications. Interventions may include icing, serial casting, sustained stretching, inhibitory pressure and medical interventions. Treatment should be done with firm and constant manual contact positioned over non-spastic areas to avoid stimulating the spastic muscle. Alternatively, rehabilitation robotics can be used to provide high volumes of passive or assisted movement, depending on the individual’s requirements.
Spasticity commonly affects the upper limb, which is often painful and interferes with the movement and limits use of the limb for active functional tasks. It can cause involuntary movements that impact on gait, balance, walking speed etc. In severe cases, it can also

impair passive functions such as washing, eating, dressing, driving i.e. all day to day activities. By understanding the above concepts and statistical data, we understood that the particular and specific design has to be made for individual to solve his/her problem.
Physical disability is such a condition; one cannot explain his/her problem easily, but the
person who is suffering from physical disability can only explain clearly about his or her
problem precisely and properly. Prior defining the problem statement of our team, our
team members have did many case studies on various types of disabilities in Mobility India,
Red cross dumb deaf school Belgaumba, District Government hospital Tumkur etc.. But the
main problem encountered by our team is availability of the patient for incorporating the
innovative, effective, cost effective themes build by our team. Therefore one of our team
members Mr. Chandan (project manager) comes forward to do certain useful aids to solve
his own problem.
The problems faced by Chandan are: 1. He is diabetic patient from last 5 years
2. He got mild stroke and his left hand and left leg are mildly paralyzed from last 3 years. Due to stroke he is feeling uncomfortable in doing many works and activities, in that few are quoted below (Problem Matrix):
To wake up from the bed (difficult to get up with only one hand)
To keep the tooth brush and fill the tooth paste
To put upon the buttons of shirt
To hold small items like: pin, compass, plate, glass, scale for drawing (studying final year mechanical engineering) etc.
To do typing in the computer
To step up stairs of bus and also college (Imbalance due to problem in holding the railings)
To hold mobile phone and to type
To hold answer script during the time of examination
To get up when sit on the floor
To open and close the zip of bag.
To put up the hand inside the pocket and to take something and many more…
Research and work cited:
As defined in the abstracted our team leader is having spastity of left hand due to
mild paralysis occurred 3 years back. Therefore we have taken up the challenge to
Endeavour and design a gloves which is help full in reducing spasticity of paralyzed
hand.
We have undergone so, many mechanisms and opted below one since, it is fabricated using locally available raw materials and also it uses cheaper materials.

Following are the Materials used in fabricating Gloves to reduce spasticity or tightness &
METHODOLOGY OF FABRICATION:
We need to provide straps on wrist, fingertip, root of the finger, in the mid portion of the
finger as shown the below figure respectively:
How the above gloves help us in movement of individual finger? When we apply the required and specific load on the individual finger, it get extended and still we are about to analyze the perfect load requirements in different heights and positions, which is going to help us in application of specific and also required loads on particular fingers. The below figure shows individual movements of fingers on the application of load individually on each finger:
The above collage of image shows the movement of individual fingers: The required load from different fingers are different, therefore we designed a clamp and pulley of our own design to measure the load or spasticity in terms of its equivalent mass: The proposed design is as follows:

3-dimensional view of clamp and pulley arrangement for analysing the load requirement of
individual finger for a paralysed person having spasticity in hand so as to design the suitable
actuation system with specific load requirements.
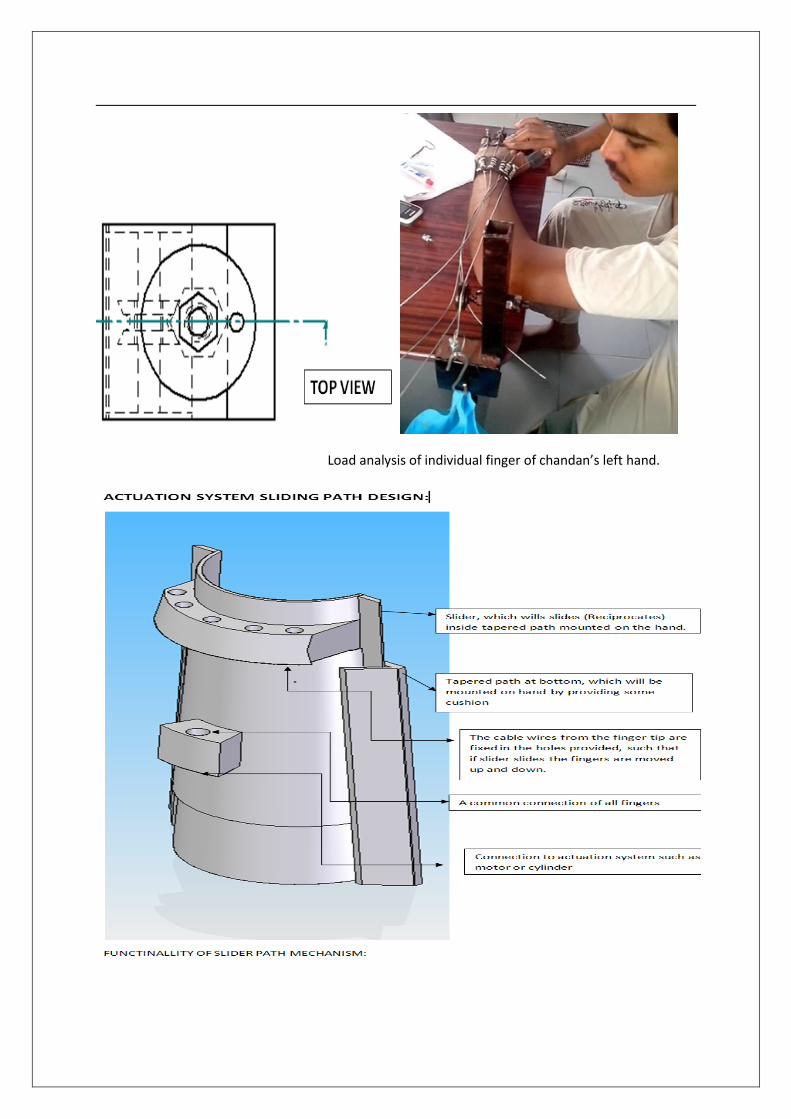
Load analysis of individual finger of chandan’s left hand.

Velcro is mounted on hand on front and also rear side of this mechanism as shown in the
arrow mark

The above illustrated design and its function, is powered by the cylinder connected to the battery operated air compressor (12 volts) which reciprocates and make the fingers to move up and down. The above proposed design is under fabrication.
DATA: The collection of data about spasticity changes according to variation on tension, weather condition and different situation is to determine in the upcoming days. OBSERVATION: There are dynamic splints available in market, which does not have the actuation system. These above mentioned a dynamic splint does not have actuation system. The patient with his own effort has to make his/her hand or finger to work CONCLUSION: The design finalized i.e. gloves with stiff tip (made up of plastic) and corrugated pipe as
shown in the above figure, will definitely help us in achieving the functionality which in turn
reducing the spasticity of the patient, the design principle can be incorporated to other
patient in helping reducing the spasticity which makes the patient to increase his confidence
level for doing day- to-day works.

42. ANDROID FOR THE DISABLED
COLLEGE: BVB COLLEGE OF ENGINEERING AND TECHNOLOGY, HUBLI
GUIDE: DR. UMA MUDENAGUDI
COLLEGE STUDENTS: PRIYANKA SHANBAGH, RAMESHWARI G HULKUNDA, AKHIL DIXIT
SCHOOL STUDENTS: SHASHWATH MUDENAGUDI 9TH std; CHETHAN PUBLIC SCHOOL, SHILPA UPPAR 9TH std; GHS HUBLI.
ABSTRACT:
The aim of Engineering has always been to improve the standards of living of the society. On
the same lines, we are proposing a product which has a long life and easy maintainability. It
overcomes the disadvantages of the existing control of wheelchairs using motion, hence is
most acceptable.
Our product is a wireless electroencephalogram (EEG) based brain smartphone interface to
control a wheelchair for paralyzed patients who cannot move freely and use wheelchairs in
their daily life. People getting Motor Neuron Disease (MND) can only use their eyes and
brain for their work and in most of the cases are dependent on caretakers. We provide a
thought driven controller using Smartphone and brain waves, captured using Myndplay
sensor developed by Neurosky. MyndPlay is the world's first mind controlled media player
and platform which allows viewers an engaging, innovative new level of interactivity with
live motion. MyndPlay gives the user the ability to interact with and change the direction
and outcome of a video or movie using only their minds. This product is a novel
communication system which enables users to translate brain activity, measured by
Electroencephalography (EEG) into a control signals and sends it to the smartphone. These
EEG signals extracted from the brain are processed and used to drive the electric
wheelchair.
BLOCK DIAGRAM FOR ANDROID:
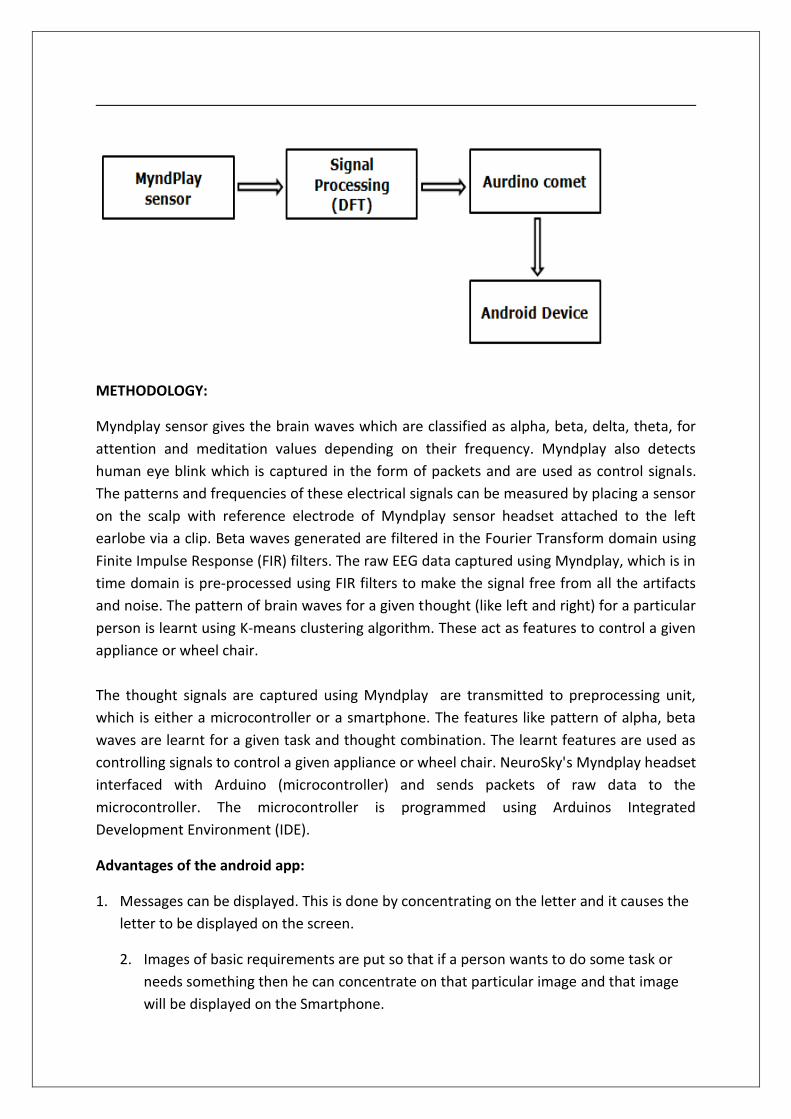
METHODOLOGY:
Myndplay sensor gives the brain waves which are classified as alpha, beta, delta, theta, for
attention and meditation values depending on their frequency. Myndplay also detects
human eye blink which is captured in the form of packets and are used as control signals.
The patterns and frequencies of these electrical signals can be measured by placing a sensor
on the scalp with reference electrode of Myndplay sensor headset attached to the left
earlobe via a clip. Beta waves generated are filtered in the Fourier Transform domain using
Finite Impulse Response (FIR) filters. The raw EEG data captured using Myndplay, which is in
time domain is pre-processed using FIR filters to make the signal free from all the artifacts
and noise. The pattern of brain waves for a given thought (like left and right) for a particular
person is learnt using K-means clustering algorithm. These act as features to control a given
appliance or wheel chair.
The thought signals are captured using Myndplay are transmitted to preprocessing unit,
which is either a microcontroller or a smartphone. The features like pattern of alpha, beta
waves are learnt for a given task and thought combination. The learnt features are used as
controlling signals to control a given appliance or wheel chair. NeuroSky's Myndplay headset
interfaced with Arduino (microcontroller) and sends packets of raw data to the
microcontroller. The microcontroller is programmed using Arduinos Integrated
Development Environment (IDE).
Advantages of the android app:
1. Messages can be displayed. This is done by concentrating on the letter and it causes the
letter to be displayed on the screen.
2. Images of basic requirements are put so that if a person wants to do some task or
needs something then he can concentrate on that particular image and that image
will be displayed on the Smartphone.

Ex.: If a person wants to have food then he can concentrate on the image assigned for food
and the respective image will be displayed.
ANDROID MESSAGE DISPLAY:
Signals sensed by MyndPlay sensor are transmitted to the android device. The headset
works on the RF (Radio Frequency) signals. The android application installed in the phone
recognizes the requirement requested by the candidate. The outlook of the android app is
shown in the below figure

ANVESHANA 2013 - KARNATAKA
Anveshana 2013 Karnataka – Organised by Agastya in partnership with Synopsys
Objective of Anveshana was to develop innovation and creativity among students from
engineering colleges and nearby schools in Karnataka. To facilitate process of mentoring
between engineering students and school students while they design and make the models
and to Bridge the knowledge gap between school and higher education through integration
of ideas. To develop new models and TLM’s using Engineering skills, which can be used in
the future by Agastya Team while they teach children and teachers among the
disadvantaged sections of the society
Process: Engineering students collaborated with high school students to create innovative
models, thus establishing scaffolding links between them. Students created knowledge
networks with resource persons to create conceptual and methodological framework to
create the models. Established links between colleges and schools and other prominent
institutions like Indian Institute of Science, Institution of Engineers, and Indian Institute of
Technology etc.
The fair was held on 22nd & 23rd Feb 2013 at Shikshakara Sadana, Bangalore. On 22nd Feb
2013 the event was inaugurated by Dr. Pradip Dutta, Corporate Vice President & Managing
Director Synopsys (India) Pvt. Ltd., Erin Brennock, Director Corporate Affairs, Synopsys Inc.
USA, in presence of Sri. G. Kumar Naik, Secretary Education Department, Karnataka State
Government, Dr. H. Harish Hande, Managing Director, SELCO-India Dr. K.G. Narayanan,
Former Director, Aeronautical Development Establishment, Bangalore, Padmashri Dr. R. M.
Vasagam, Former Vice-Chancellor, Anna University, Dr. Maulishree Agrahari, Professor &
KRP , PESIT Bangalore, Sharat Kaul , Sr. Executive Account Manager, Synopsys and Sri. Ramji
Raghavan, Chairman, Agastya International Foundation, Bangalore.
An inspiring talk on “How to kindle young minds through ideas” was delivered by Sri.
Ramachandra Budihal to all the participating students and dignitaries

Keynote address was delivered by Dr. V K. Aatre in presence of Erin Brennock, Dr. K.G.
Narayanan, and all the other dignitaries on 23rd Feb 2013.
We had received 109 projects from 50 Engineering colleges across the state. 44 projects
were selected for the final competition in Bangalore. 42 projects were displayed and juries
selected the winners after several round of interactions. Winners were awarded cash prizes.
Rolling trophy was sponsored by Institution of Engineers Karnataka State Center.
42 projects were exhibited from 23 Engineering colleges in the final competition. 84
students from 34 schools took part in this competition along with 84 engineering students.
Inauguration of the event by dignitaries ( From left to right- Suresh, Ramji Raghavan, Sharat Kaul, Dr. Pradip
Dutta, Erin Brennock, Dr. H. Harish Hande, G. Kumar Naik, Dr. Vasagam, Dr. K.G. Narayanan and Prof.
Maulishree Agrahari)

Anveshana 2013 Book Launch

Visiting students interacting and going through the exhibits

Juries interacting with students

Exhibition hall with students
Feedback:
Anveshana is a program organized by Agastya Foundation is one of the social engineering initiatives
to be remembered for long period. The program of co-developing the project with engineering and
School students provided platform to learn and hone the skill. The initiative provides an opportunity
to learning by doing their by provided opportunity to learn more. The opportunity for the school
children is many fold: The curiosity built in the project and doing the project at prestigious
engineering college gives immense self-esteem to the student. The self-esteem will increase the
eagerness for the more learning. This has been observed that school students and engineering
students learning ability is increased during the period of the project duration and also continued
further in improved scoring pattern of the students. Exposure to different tools and methods is
helpful in leaning lateral thinking and learning. For this competition we have selected pool of eight
students initially. Gradually over the period of the project progress we started eliminating the
students to retain two students finally. This process has led to increased competition among the
students and resulted in excitement for more learning to stay in the competition. Overall objective
of the program is well defined and results in fulfilling twin objective of catering lateral learning and
developing commercially viable projects from the engineering colleges. Look forward for more active
participation in the years to come.
Dr. C.B. Vijaya Vittala Dean (R&D)
HMSIT, Tumkur [email protected]
Mobile : +919448145261