ENEE408G: Capstone Design Project: Multimedia Signal Processing Design Project 2:

1 Design 4712 Project 2
Design 7 Project 2 NYCCT Prof. AzaroffFall 2021
New York and transforming to a 15 minute post covid city. Since the COVID crisis struck the world the fragility of our cities, neighborhoods and systems have been reveled. Supply chains from source of production to the end user are too long, the reliance on transportation networks for lifeline elements needs to be rethought.
New York City is at the crossroads of remaking the cit and its neighborhoods. The city is currently exploring ways to create 15 minute cities in each neighborhood. Find a way forward to create local supply chains, local jobs and a sense of place for each resident.
Below is a concept for the 15 minute city with supporting links. Each team of 3 will be looking at an area of New York City to explore the existing conditions, identify gaps.critical issues and describe those elements with respect to history, present day, the effects of covid 19 on the area and projections to the future. Each individual will contribute to the base data to illustrate an understanding of the people, place and history. Each individual student will work and propose design solutions that address the current and future needs of the selected area, the needs of the larger community and the needs of the city as those different scales.
https://www.15minutecity.comhttps://www.cnu.org/publicsquare/2021/02/08/defining-15-minute-cityhttps://en.wikipedia.org/wiki/15-minute_cityhttps://nymag.com/intelligencer/2020/07/the-15-minute-city-can-new-york-be-more-like-paris.htmlhttps://chc9813.medium.com/the-15-minute-city-in-a-new-york-minute-e3d7ea0a0bdahttps://www.bloomberg.com/news/articles/2021-03-02/the-downsides-of-a-15-minute-cityhttps://tomorrow.city

2 Design 4712 Project 2
Example: Calgary Catchments, many 15 minute zones.
All teams must be familiar with the new waterfront plan from NYC Planning.
NYC Comprehensive Waterfront planhttps://www.waterfrontplan.nyc

3 Design 4712 Project 2
New York City transformation to Open Streets and Open Arts program https://www1.nyc.gov/html/dot/html/pedestrians/openstreets.shtmlFull list of street closures and definitions
https://data.cityofnewyork.us/Health/Open-Streets-Locations/uiay-nctuSearchable maps and data
Transit Maps and undeserved communities Nearly 29 percent of New York City households are underserved by transit, according to data from the Center for Neighborhood Technology and TransitCenter. In a joint project, called AllTransit, the team put together a collection of transit data that includes 15,000 routes and 800 agencies in the United States. A tool called Gap Finder identifies gaps in U.S. cities where underserved communities would benefit from improved service.
https://www.6sqft.com/interactive-map-identifies-the-new-york-city-neighborhoods-most-underserved-by-transit/
https://alltransit.cnt.org/gap-finder/

4 Design 4712 Project 2
The 15 minute city encompasses all sectors and has arisen through COVID
https://www.archdaily.com/954928/creating-a-pedestrian-friendly-utopia-through-the-design-of-15-minute-cities
The concept is cool streets (plantings, tree canopy), walk and bike first, public transit, etc. funding can go for these initiatives under healthy environments. This also plays into food security and long chain supply lines that need to become local.
Along the lines of technology, cities are creating public access touchdown spaces.Started on campuses to address covid, now cities are creating these environments for public WiFi access in larger outdoor settings. Are there any unused or in need of renewal areas in economically challenged neighborhoods that could use this to help the public and startups? https://www.cmu.edu/coronavirus/preparing-campus/touchdown.html
Open street program we instituted in NYC. I had a hand in this effort and now we have $5 million coming from the federal side to support small businesses use of streets and for city planning to examine permanent street adaptation. https://www.grubstreet.com/2021/03/how-does-nyc-open-streets-work.html
How covid recovery can be leveraged to sustainable development goals https://www.unep.org/news-and-stories/story/cities-where-fight-green-recovery-will-be-won-or-lost

5 Design 4712 Project 2
List of potential neighborhoods or areas for study.
1. BrownsvilleWhen it comes to drug related deaths, murder and homicide, Brownsville beats every other city in New York to it. This neighborhood is also in record to have the lowest life expectancy rate and highest infant mortality. This is all because of the extreme violence it faces.A mortality report released by Department of Health (DOHMH) in 2019 showed 17 deaths for every 1,000 people between 2013 and 2017. This is four times more than New York’s homicide rate average of 3.8.Funny thing is, as outrageous as this result is, it is actually a decline. Brownsville was once the murder capital of New York. It is no surprise this neighborhood is not only tagged dangerous, but deadly.
Read: https://patch.com/new-york/brownsville/deadliest-neighborhood-new-york-city

6 Design 4712 Project 2
4. Hunts PointBack then, Hunts Point used to be registered as one of the most dangerous areas in the Bronx. This neighborhood had a reputation of being crime-filled, with high drug concentration. And recently, it’s seen as still in a bad shape with crumbling tenements, negative vibes and dangerous hot spots. The population in Hunts Point is roughly 23,000 with crime rate of 55% greater than the national average. If you happen to be a resident in Hunts Point, your chance of being a crime victim is 1 in 26.
7 Design 4712 Project 2
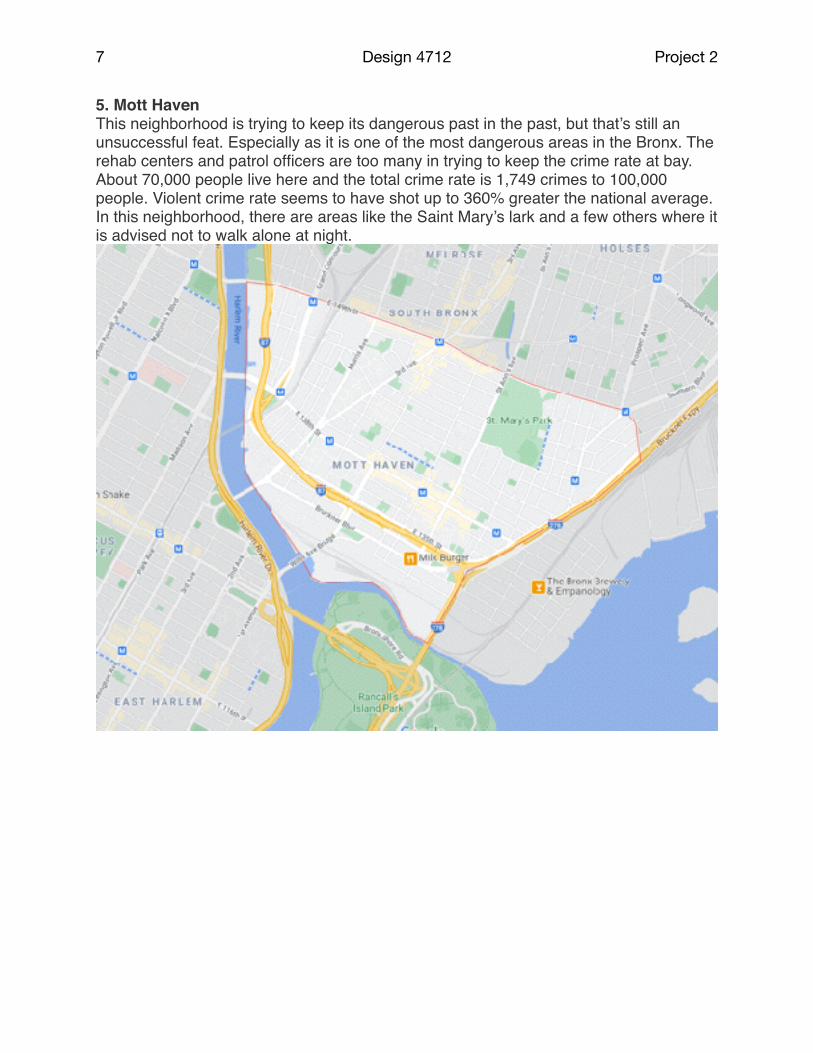
5. Mott HavenThis neighborhood is trying to keep its dangerous past in the past, but that’s still an unsuccessful feat. Especially as it is one of the most dangerous areas in the Bronx. The rehab centers and patrol officers are too many in trying to keep the crime rate at bay. About 70,000 people live here and the total crime rate is 1,749 crimes to 100,000 people. Violent crime rate seems to have shot up to 360% greater the national average. In this neighborhood, there are areas like the Saint Mary’s lark and a few others where it is advised not to walk alone at night.

8 Design 4712 Project 2
8. SoundviewThere are almost a 100,000 people that live in Soundview and they’ve not all had to witness the worst of crimes. This neighborhood used to be dangerous some decades back but now, it seems relatively safe. Property crime has an estimate of 1,306 in 100,000 people while violent crime 893. The chances of being a victim of a crime in this neighborhood is 1 out of 46.

9 Design 4712 Project 2
9. TremontThis neighborhood in West Bronx has very little arrests reported, and also not the most dangerous in New York of course. However, with a population of 106,000 people, total crime of 2,539 is on the high side. The violent crime in the neighborhood is evidenced to be 178% higher than the national average.

10 Design 4712 Project 2
6. Ocean HillAnother Brooklyn neighborhood with a total population of 31,831. The overall risk of crime is 1% higher than the National Average. With 1%, it goes without saying: is Brooklyn safe? There’s no risk in this neighborhood with public transportation. Petty crimes and mugging are less common, so exploring at night, by foot or car, wouldn’t give you the shivers.

11 Design 4712 Project 2
7. Redhook
Red Hook is a neighborhood in northwestern Brooklyn, New York City, New York, within the area once known as South Brooklyn. It is located on a peninsula projecting into the Upper New York Bay and is bounded by the Gowanus Expressway and the Carroll Gardens neighborhood on the northeast, Gowanus Canal on the east, and the Upper New York Bay on the west and south. A prosperous shipping and port area in the early 20th century, the area declined in the latter part of the century.
Red Hook is in the 94th percentile for safety, meaning 6% of cities are safer and 94% of cities are more dangerous. ... The rate of crime in Red Hook is 10.89 per 1,000 residents during a standard year. People who live in Red Hook generally consider the southeast part of the city to be the safest.

12 Design 4712 Project 2
8. Far Rockaway NY
Far Rockaway is a neighborhood on the eastern part of the Rockaway peninsula in the New York City borough of Queens. It is the easternmost section of the Rockaways. The neighborhood extends from Beach 32nd Street east to the Nassau County line.
Far Rockaway is in the 56th percentile for safety, meaning 44% of cities are safer and 56% of cities are more dangerous. ... The rate of crime in Far Rockaway is 24.37 per 1,000 residents during a standard year. People who live in Far Rockaway generally consider the northwest part of the city to be the safest.

13 Design 4712 Project 2
9. Edgemere - Arverne
Edgemere is a neighborhood in the New York City borough of Queens, extending from Beach 32nd to Beach 52nd Street on the Rockaway Peninsula. It contains Rockaway Community Park. Arverne is to the west, and Far Rockaway to the east.
Arverne is a neighborhood in the New York City borough of Queens, on the Rockaway Peninsula. It was initially developed by Remington Vernam, whose signature "R. Vernam" inspired the name of the neighborhood.

14 Design 4712 Project 2
10. Sunset Park Brooklyn, NY
Multicultural Sunset Park is known for both a booming Chinatown, with noodle shops and dim sum spots, and a diverse Latino community. From a leafy hilltop, the namesake park offers Statue of Liberty views, while pastoral Green-Wood Cemetery is permanent home to famous New Yorkers. On the waterfront, the Industry City warehouse complex houses creative industries and draws locals for casual artisanal eats and spirits.
Named for the park at its heart, the neighborhood was mapped and defined in the 1960s. The park itself was developed in the 1890s, defining an area that had previously been runoff from the surrounding neighborhoods of South Brooklyn and Bay Ridge.
Crimes are very rare in sunset park but it still happens, but I live in the Asian neighborhood. Although the Chinese neighborhood is safe, it is quite dirty and noisy because people would just split on the floor like it's no big deal or many of them talk realllly loud at both night and day time.

15 Design 4712 Project 2
Team Research Assignment
Base geography a sense of space
1. Location, 3d views and models of the urban condition.
2. Neighborhood history, timeline etc.
3. Geographies and demographics. Include Age, race, income, family size, gender, education, employment data, foreign born, etc.
4. Surrounding area of streets, transit, parks, open space, public space. Describe the best qualities and other elements that identify this area as a neighborhood.
5. Maps of existing buildings, delineate commercial spaces, libraries, schools, medical services, police, fire, grocery stores, transit patterns, other amenities, etc.
6. In addition, existing zoning.
7. Neighborhood walls, textures, images and descriptors of the area.Create 15 minute radius for walking, biking, bus, car, train and any other transit .
8. Public/private areas
9. Empty lots and unused spaces and places (Opportunities)
10. Other observations, quality of life or lack their of.
Accessibility
Once the information is gathered from above then and only then shall the team proceed with the following:
1. Examine what exists in that radius for the community.
2. What types of support services exist now?
3. Climate and ecology: Climate change projections, sea level rise, solar path and degree days, precipitation, prevailing winds throughout the year. And these should be done not only for today but for 2060 and 2100 as well. Remember what you design today must address the needs of tomorrow.
Assignment: Create a presentation with the complete research of the neighborhood and the site. First draft of progress is due Sept. 23rd in class, we meet in person.

16 Design 4712 Project 2
In class today your team will select a site (one team per site) you will divide the work and write out a research plan with names tied to the areas of study.
Your final jury for Project 1 will be Sept. 21st to accommodate the jury.
Next steps and final base neighborhood research for project 2 is Due Sept. 30th, 2021