1 DEPARTMENTOFMATHEMATICSUPPSALAUNIVERSITY EMPIRICAL DATA AND MODELING OF FINANCIAL AND ECONOMIC...
21
1 D E P A R T M E N T O F M A T H E M A T I C S U P P S A L A U N I V E R S I T Y EMPIRICAL DATA EMPIRICAL DATA AND AND MODELING MODELING OF OF FINANCIAL FINANCIAL AND AND ECONOMIC PROCESSES ECONOMIC PROCESSES by by Maciej Klimek Maciej Klimek
-
date post
19-Dec-2015 -
Category
Documents
-
view
213 -
download
0
Transcript of 1 DEPARTMENTOFMATHEMATICSUPPSALAUNIVERSITY EMPIRICAL DATA AND MODELING OF FINANCIAL AND ECONOMIC...

1
DDEEPPAARRTTMMEENNTT
OOFF
MMAATTHHEEMMAATTIICCSS
UUPPPPSSAALLAA
UUNNIIVVEERRSSIITTYY
EMPIRICAL DATA EMPIRICAL DATA ANDAND MODELING MODELING OFOF FINANCIAL FINANCIAL ANDAND ECONOMIC PROCESSES ECONOMIC PROCESSES
byby
Maciej KlimekMaciej Klimek
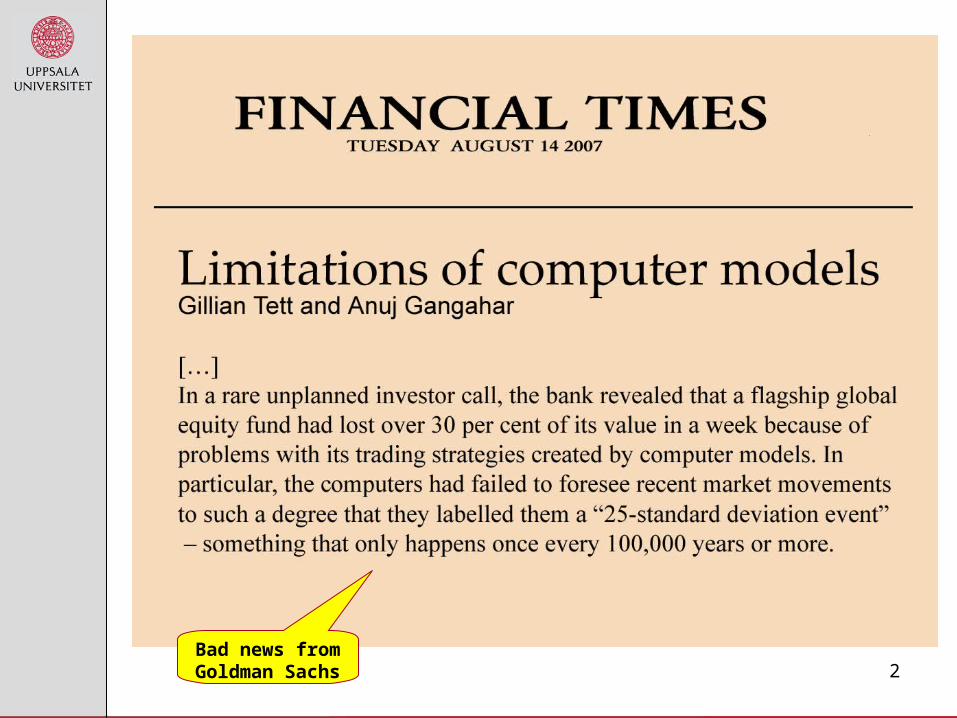
2Bad news from Goldman Sachs

3
Financial theories vs. changing realityFinancial theories vs. changing reality
OLD, BUT PERSISTENT:• The moving target problems:
insufficient sequences of statistical data “uncertainty principle” = beliefs/practice changing the market
• Convenience more important than realism (eg CAPM, prevalence of Gaussian distribution, ignoring areas of applicability etc)• “Natural science” approach to social phenomena (major weakness of Econophysics)
NEW, LARGELY UNEXPLORED:• Theoretical background pre-dates the IT-revolution (eg Efficient Market Hypothesis)• Globalization of markets vs. theories based on several developed countries (eg new research: Virginie Konlack and Ivivi Mwaniki – comparing stock markets in Kenya and Canada)• Complexity of financial instruments obscuring risks (eg subprime mortgages vs. CDO’s and the like)

4
Example: ABN-testExample: ABN-test
Okabe, Matsuura, Klimek 2002
5
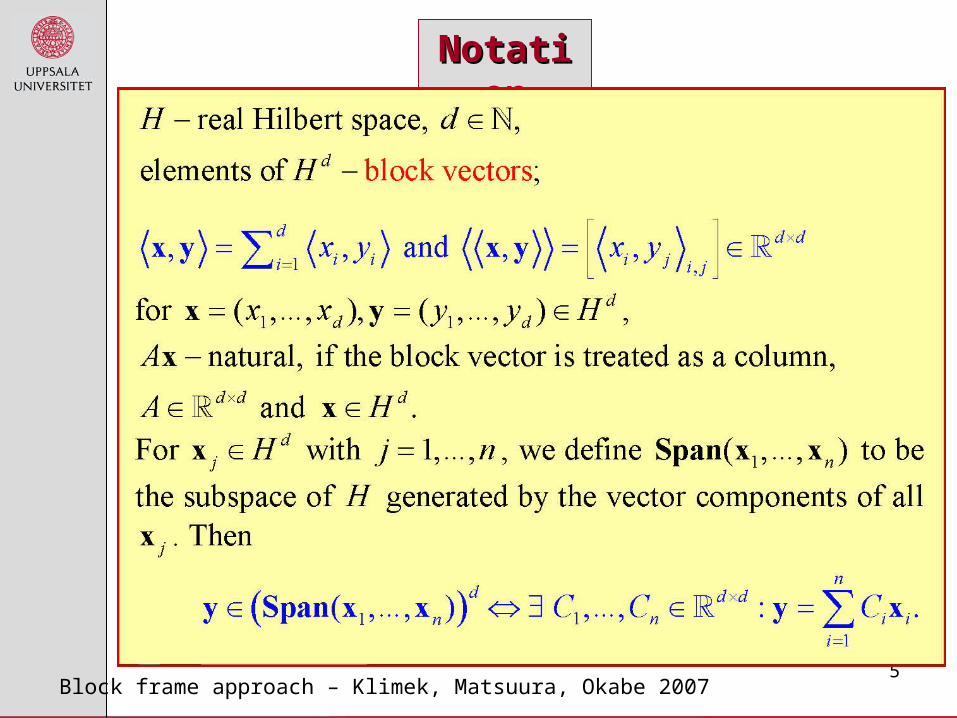
NotationNotation
Block frame approach – Klimek, Matsuura, Okabe 2007

6
Block framesBlock frames

7
Basic theoremBasic theorem

8

9
Fundamental propertiesFundamental properties

10
The blueprint algorithmThe blueprint algorithm
11
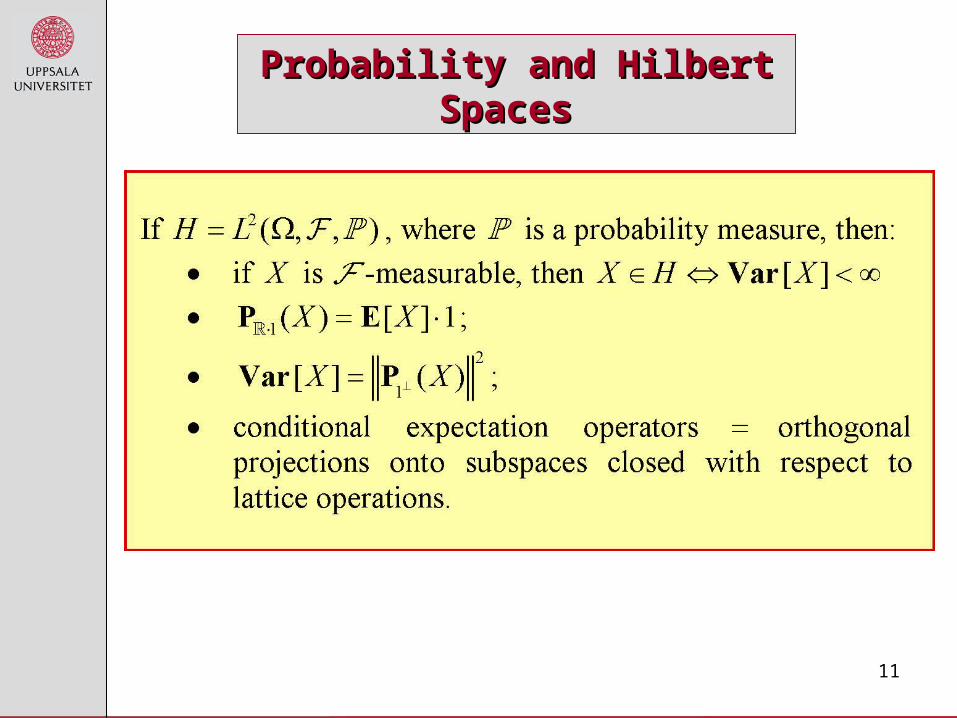
Probability and Hilbert SpacesProbability and Hilbert Spaces

12
Hilbert latticesHilbert lattices

13

14
Basic objects associated with time series:Basic objects associated with time series:

15
dissipation coefficients

16
MAIN IDEAMAIN IDEA

17
Instead of analysing a d-dimensional time series Xn
We use the d(m+1) dimensional time series
1 0
2 0
0 0
, ,
, ,
, ,
n
nn
nn
nm n n
X
P X X
P X X
P X X
This is computationallyintensive, hence the
need for efficient algorithms!

18
Example: Tests of stationarity Example: Tests of stationarity
Given time series data X(n) calculate the sample covariance
Use the blueprint algorithm to calculate the alleged fluctuations ν+(n)
Normalize: W(n)-1 ν+(n), where W (n) 2=V (n), W (n) -1 is the Moore-Penrose pseudoinverse of W (n) and
Apply a white noise test to the resulting data
Original version: Okabe & Nakano 1991
A weak stationarity test:
( ) ,V n n n
19
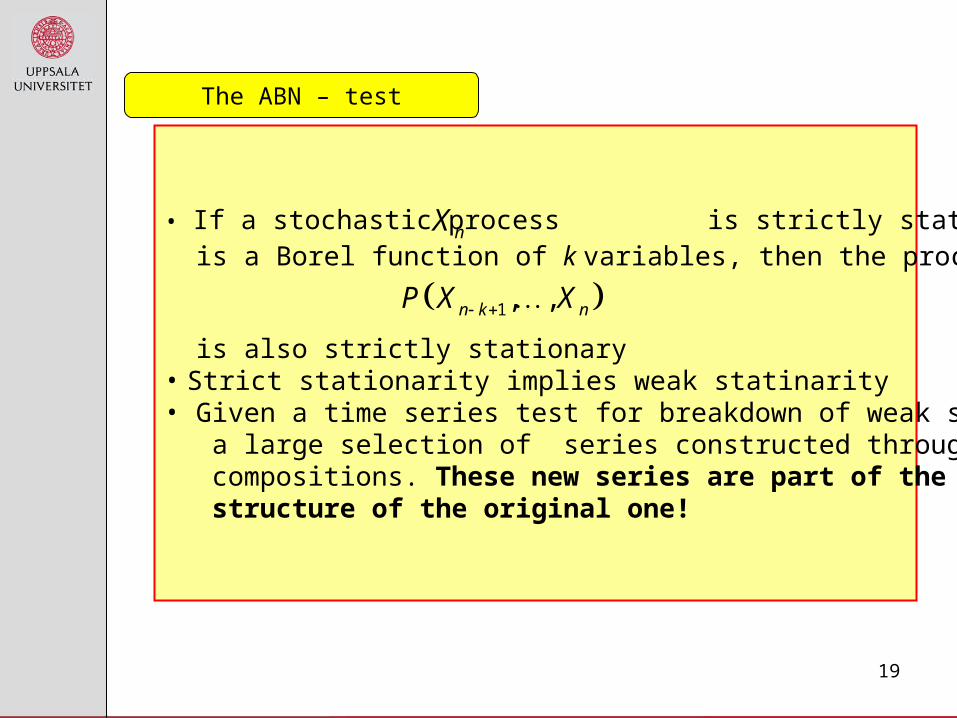
The ABN – test
• If a stochastic process is strictly stationary and P is a Borel function of k variables, then the process
is also strictly stationary • Strict stationarity implies weak statinarity• Given a time series test for breakdown of weak stationarity a large selection of series constructed through polynomial compositions. These new series are part of the information structure of the original one!
nX
1, ,n k nP X X

20
Applications:Applications:
• Forecasting• “Extended” stationarity analysis• Causality tests• General adaptive modeling of time series improving on ARCH, GARCH and similar models. • Volatility modelling.