
1 Department of Biological Sciences, Murray State ... London... · 3 School of Development, Azim...
28
1 Department of Biological Sciences, Murray State University, Murray, Kentucky 42071, USA 2 Fondazione Edmund Mach, Research and Innovation Center, Department of Biodiversity and Molecular Ecology, GIS and Remote Sensing Unit, Via E. Mach 1, 38010 S. Michele all'Adige, TN, Italy 3 School of Development, Azim Premji University, PES Institute of Technology Campus, Bangalore 560100, India
Transcript of 1 Department of Biological Sciences, Murray State ... London... · 3 School of Development, Azim...

1 Department of Biological Sciences, Murray State University, Murray, Kentucky 42071, USA 2 Fondazione Edmund Mach, Research and Innovation Center, Department of Biodiversity and Molecular Ecology, GIS
and Remote Sensing Unit, Via E. Mach 1, 38010 S. Michele all'Adige, TN, Italy 3 School of Development, Azim Premji University, PES Institute of Technology Campus, Bangalore 560100, India

Outline
• Invasive species, a pressing challenge for biodiversity and conservation
• Ground-based vs. remote sensing-based methods in early detection and rapid response
• Hyperspectral remote sensing facilitates invasion research – Using time series to aid detection and mapping
– Tracking ecosystem changes with reflectance data
– Informing invasion risks with predictive models

Alligator weed (Alternanthera philoxeroides) on Kentucky Lake

Kudzu (Pueraria lobata) in Georgia. It has been spreading at the rate of 610 km2 annually.

Impacts of invasions
• Loss of biodiversity and ecosystem service
• Increase in species displacement and community changes
• Decline of native endemic species
• Invasions and extinctions are closely linked
• Complicate conservation management in natural areas
• Substantial socio-economic losses worldwide – Hulme et al. (2013), Jeschke et al. (2014), Blackburn et al.
(2014)

Tracking invasives: ground-based approach
• Ground-based methodologies are difficult to use for detecting and monitoring the spatial distribution of invasive species. – Time consuming and costly
– Sampling, spatial, and taxonomic biases
– Often lack of temporal dimensions
– Lack of access in some targeted areas
– Impossible for large scale studies
– Only a few taxa can be thoroughly studied

Tracking invasives: remote sensing approach
• Remote sensing offers great opportunities for invasion ecologists to monitor spatial and temporal dynamics of invasive species. – Cost-effective (some RS data are freely available)
– Provides complete spatial coverage for large or remote areas
– Offers possibilities to go back in time with archived data to document invasion patterns
– Provides current and consistent occurrence records for species distribution modeling to inform invasion risks.

Remote sensing approach- sensor types and availability
• Multispectral – AVHRR, MODIS, Landsat TM, ETM+, Landsat 8, Aster, SPOT,
IKONOS, Quickbird, Worldview-2, GeoEye-1,2, Pleiades-1,2.
• Hyperspectral – EO-1 Hyperion, AVIRIS, AISA, CASI, HyMap
• Aerial photos – NAPP, NHAP, NAIP, USGS DOQ
• LiDAR and RADAR – See Table 1 in He et al. (2011), Table 2 in Bradley (2014) and
(Pettorelli et al. 2014) for spatial and spectral resolution, swath width, acquisition frequency, sources, cost, and availability of future sensors.

Hyperspectral remote sensing • Hyperspectral sensors measure the reflected spectrum at
wavelengths between 350 and 2500 nm using 150–300 contiguous bands of 5- to 10-nm bandwidths (Ustin et al. 2004).
A hyperspectral cube. AVIRIS captures imagery from 224 spectral bands visualized as a stack of images 224 pixels deep (Source: NASA).
Four spectrally distinct materials are separated using hyperspectral data (Bradley 2014).

Hyperspectral remote sensing
• Higher spectral resolution allows the differentiation of species based on biochemistry of leaves or canopy (Ustin et al. 2004). Identification to species level can be made possible based on subtle spectral features.
(Kiang et al. 2007)

Using time series to incorporate phenology in detection and mapping
• The uniqueness in phenological signal of some invasive species provides a sound basis for identifying spectral differences between targeted species and co-occurring native vegetation.
Perennial pepperweed (Lepidium latifolium) Field spectra of flowering and fruiting phenology of Lepidium (Andrew & Ustin 2008)

Using time series to incorporate phenology in detection and mapping
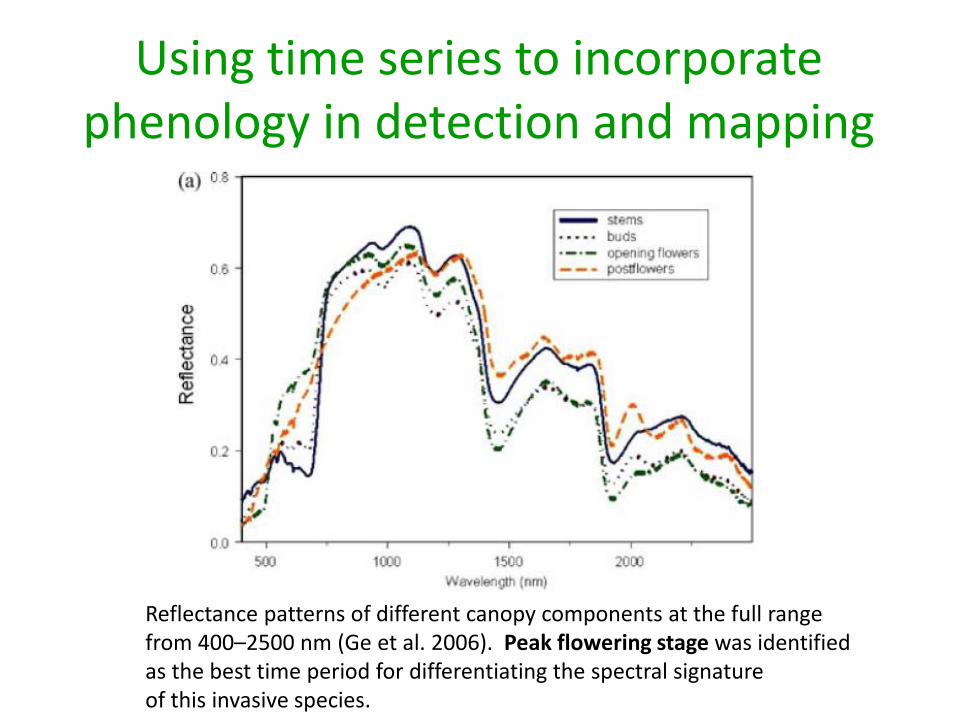
• The spectral characteristics of canopy components at different flowering stages including stems, buds, opening flowers, and post-flowers can be compared.
Yellow starthistle (Centaurea solstitialis)
Canopy components of yellow starthistle: stems, opening flowers, postflowers, and buds (Ge et al. 2006).
Using time series to incorporate phenology in detection and mapping
Reflectance patterns of different canopy components at the full range from 400–2500 nm (Ge et al. 2006). Peak flowering stage was identified as the best time period for differentiating the spectral signature of this invasive species.

Using time series to incorporate phenology in detection and mapping
• Significant changes in phenology can help ecologists determine the best timing to discriminate invasive species remotely.
Purple loosestrife (Lythrum salicaria) Reddish-purple in early August
Common reed (Phragmites australis) Bloom late, have brown to whitish tassels
Cattail (Typha spp.) Bloom early , have brown inflorescences in August and September

Using time series to incorporate phenology in detection and mapping
• August as the best month for differentiating plant communities dominated by these three invasive species based on significant changes in their phenology (Laba et al. 2005).

Using time series to incorporate phenology in detection and mapping
• Invasive plants might be phenologically distinct from native species in a deciduous landscape (i.e. green up early, stay green longer, etc.)
Early spring and late fall provide opportunity for remote sensing (Bradley 2014)
Understory invasive plants can be detected if they have phenologies distinct from overstory species.
(Wilfong et al. 2009, Shouse et al. 2013)
Bush honeysuckle (Lonicera maackii)

Using time series to incorporate phenology in detection and mapping
• In tropics, phenological differences between plant species can be captured by combining spectral information from different periods to improve detection and mapping accuracy.
A multi-temporal spectral mixture analysis for invasive species mapping in Hawaiian rainforests with Hyperion (Fig. 1 in Somer & Anser 2013).

Using time series to incorporate phenology in detection and mapping
• The detection success increased systematically when compared the results of multi-temporal MESMA (Kappa = 0.78) with that of uni-temporal approach (Kappa = 0.51–0.69).
(Table 2 in Somer & Asner 2013)

Tracking ecosystem changes with
reflectance data
• Biogeochemical changes found at the foliar and canopy levels indicate not only where invasion has occurred, but also how it affects ecosystem structures.
Mean reflectance of Hawaiian non-fixing (H), Hawaiian nitrogen-fixing (HN), introduced non-fixing (I), and introduced nitrogen-fixing (IN) species (Asner et al. 2008)

Tracking ecosystem changes with reflectance data
• Changes in foliar nitrogen and water content
captured by spectra directly indicate the biogeochemical impact of invasive species on the rainforest (Fig. 4 in Asner & Vitousek 2005).

Informing invasion risks with
predictive models
• Developing spatially explicit distribution models for predicting the future spread of invasive species is a critical research area for invasion ecologists.
• These models provide timely information for resource managers and policy makers who need accurate species distribution maps for invasion risk analysis.

Informing invasion risks with predictive models
• Species distribution models may be correlative (ecological niche models) or mechanistic (physiologically-based demographic models). – Generalized additive models
– Classification regression tree model
– Multivariate adaptive regression splines
– Random forest
– Maximum entropy
– Artificial Neural Network
– Bioclimatic envelope models

Informing invasion risks with predictive models
• Model input: Climatic, topographical and edaphic variables along with vegetation indices (MODIS NDVI) have been used as predictor variables for these predictive models.
• The use of hyperspectral data for invasive risk analysis is still rare even though hyperspectral data are a valuable input for quantitative models.

Informing invasion risks with predictive models
• Hyperspectral data deserve an increased attention from ecologists.
Andrew and Ustin (2009) assessed the invasion risk of Pepperweed in California’s San Francisco Bay using both predictor and response variables derived from remote sensing: - Present/absent data of pepperweed were extracted from a hyperspectral image (HyMap). - Predictor variables were derived from a LiDAR digital elevation model

Concluding remarks
• Spectral information provided by hyperspectral sensors can detect invaders at the species level across a range of community and ecosystem types.
• Despite its proven utility in mapping and modelling the distribution of invasive species, hyperspectral remote sensing is underused by invasion ecologists.
Concluding remarks
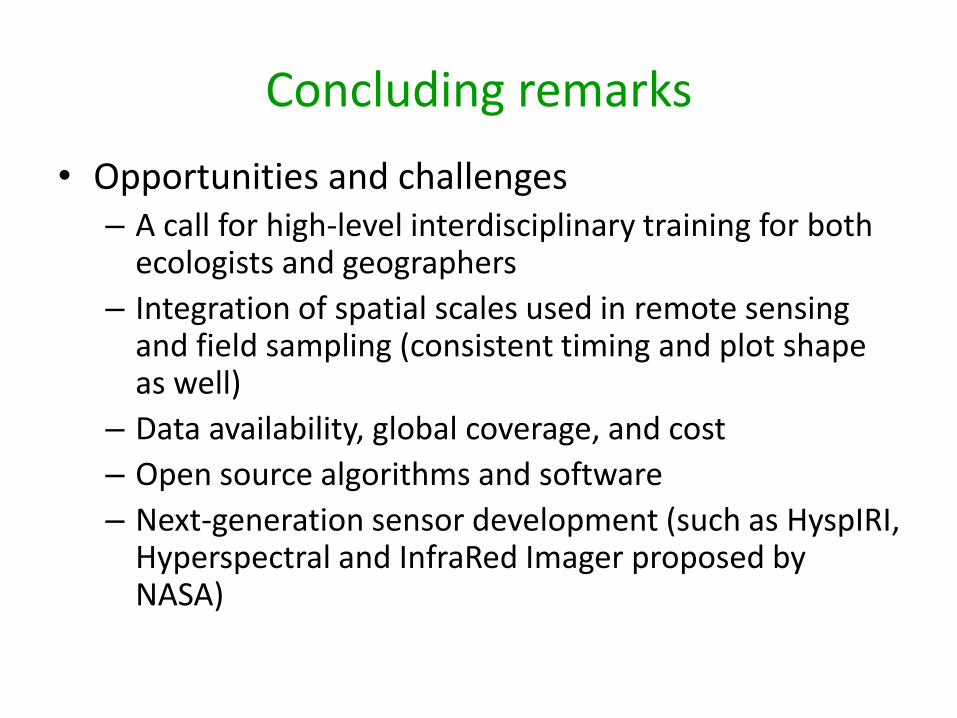
• Opportunities and challenges – A call for high-level interdisciplinary training for both
ecologists and geographers
– Integration of spatial scales used in remote sensing and field sampling (consistent timing and plot shape as well)
– Data availability, global coverage, and cost
– Open source algorithms and software
– Next-generation sensor development (such as HyspIRI, Hyperspectral and InfraRed Imager proposed by NASA)

Thank you!


![Introduction to Our Work - India Urban Conference 2011 · Azim Premji University Introduction to Our Work . ... Azim Premji Foundation ... msi_iuc2011_v.1.0.ppt [Compatibility Mode]](https://static.fdocuments.in/doc/165x107/5ada64ac7f8b9a86378d4a82/introduction-to-our-work-india-urban-conference-premji-university-introduction.jpg)


