1 Data Mining and Knowledge Acquizition — Chapter 7 — —Data Mining Overview and Exam...
112
1 Knowledge Acquizition — Chapter 7 — —Data Mining Overview and Exam Questions— 2014/2015 Summer
-
Upload
marybeth-riley -
Category
Documents
-
view
220 -
download
2
Transcript of 1 Data Mining and Knowledge Acquizition — Chapter 7 — —Data Mining Overview and Exam...
1
Data Mining and Knowledge Acquizition
— Chapter 7 —
—Data Mining Overviewand Exam Questions—
2014/2015 Summer
2
Outline
Methodology - Overview Introduction Data Description – Preprocessing OLAP Clustering Classification Numerical Prediction - Regression Frequent Pattern Mining Recent BIS Exams Unclassified Questions
3
Methodology and Overview
KDD Methodology Functionalities
4
KDD Methodology
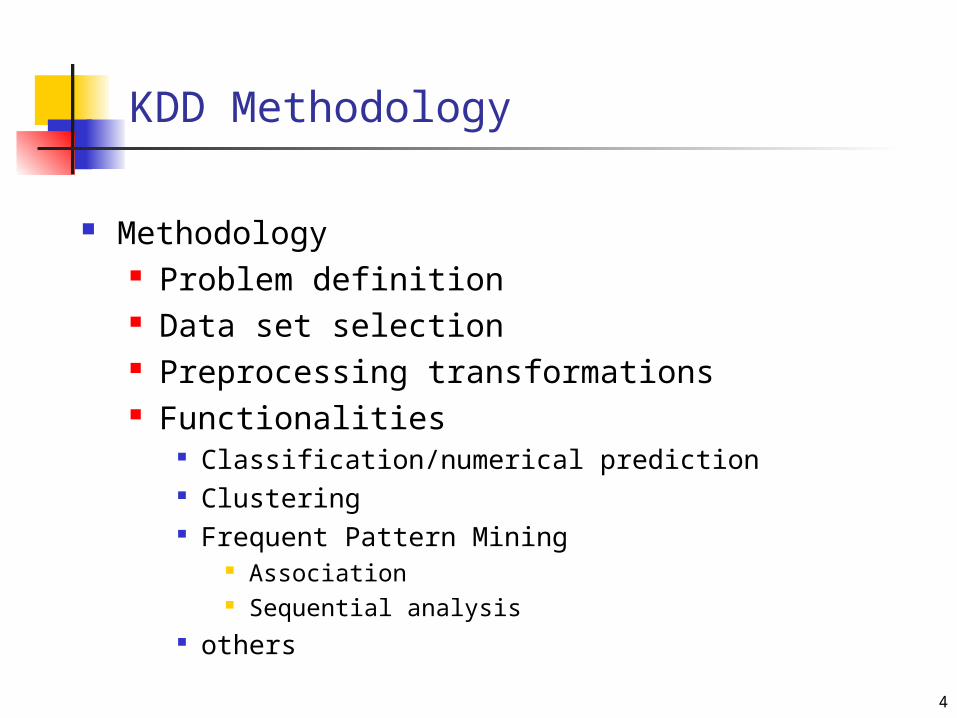
Methodology Problem definition Data set selection Preprocessing transformations Functionalities
Classification/numerical prediction Clustering Frequent Pattern Mining
Association Sequential analysis
others
5
KDD Methodology (cont.)
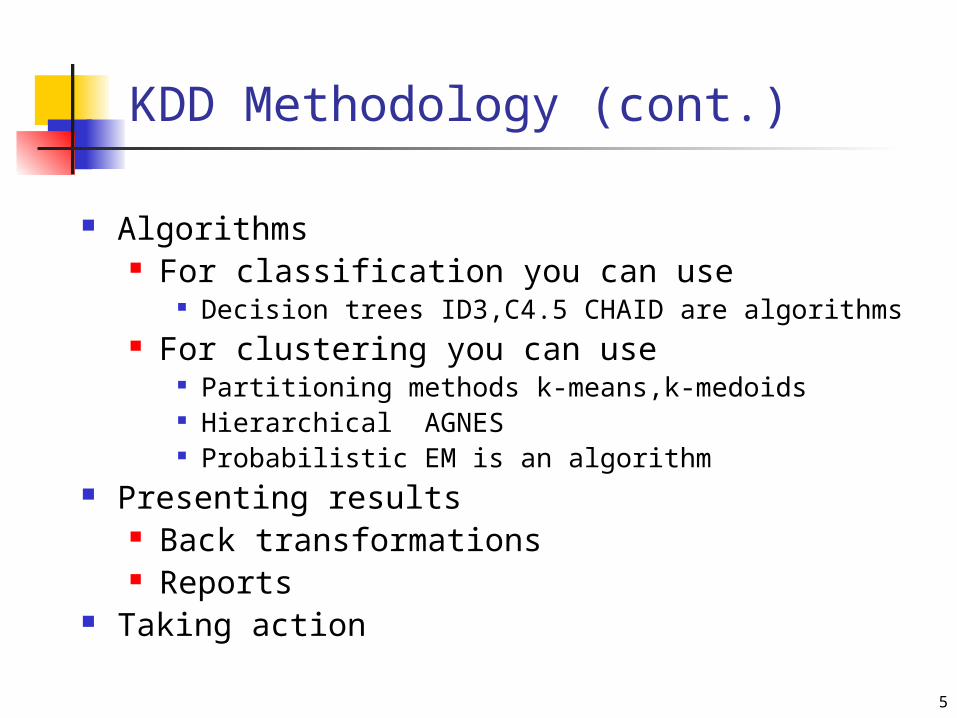
Algorithms For classification you can use
Decision trees ID3,C4.5 CHAID are algorithms For clustering you can use
Partitioning methods k-means,k-medoids Hierarchical AGNES Probabilistic EM is an algorithm
Presenting results Back transformations Reports
Taking action
6
Data Description
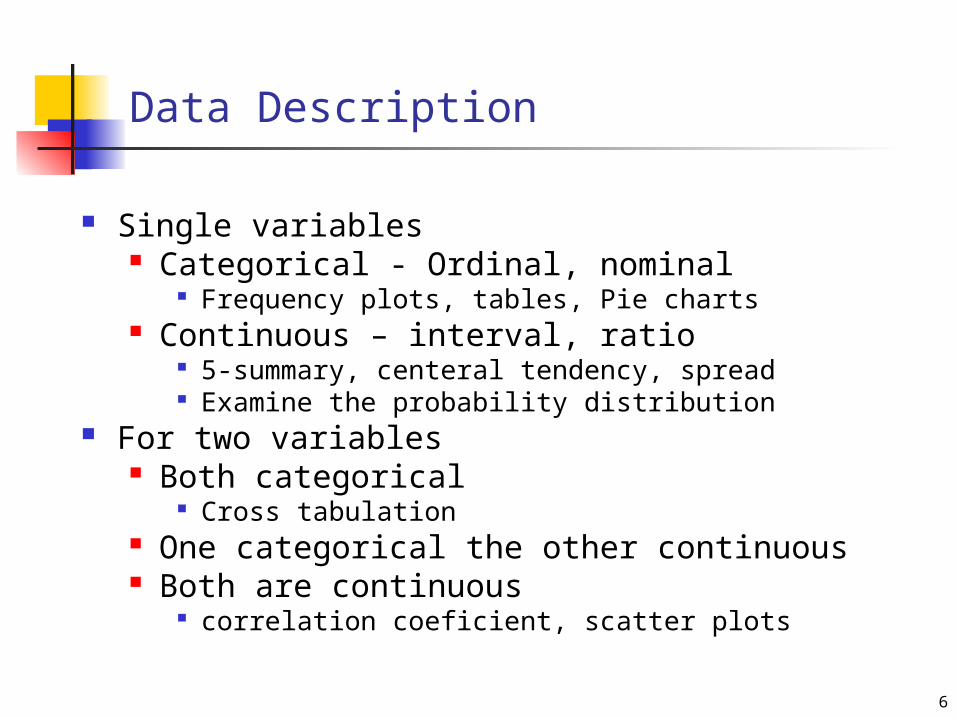
Single variables Categorical - Ordinal, nominal
Frequency plots, tables, Pie charts Continuous – interval, ratio
5-summary, centeral tendency, spread Examine the probability distribution
For two variables Both categorical
Cross tabulation One categorical the other continuous Both are continuous
correlation coeficient, scatter plots
7
Preprocessing
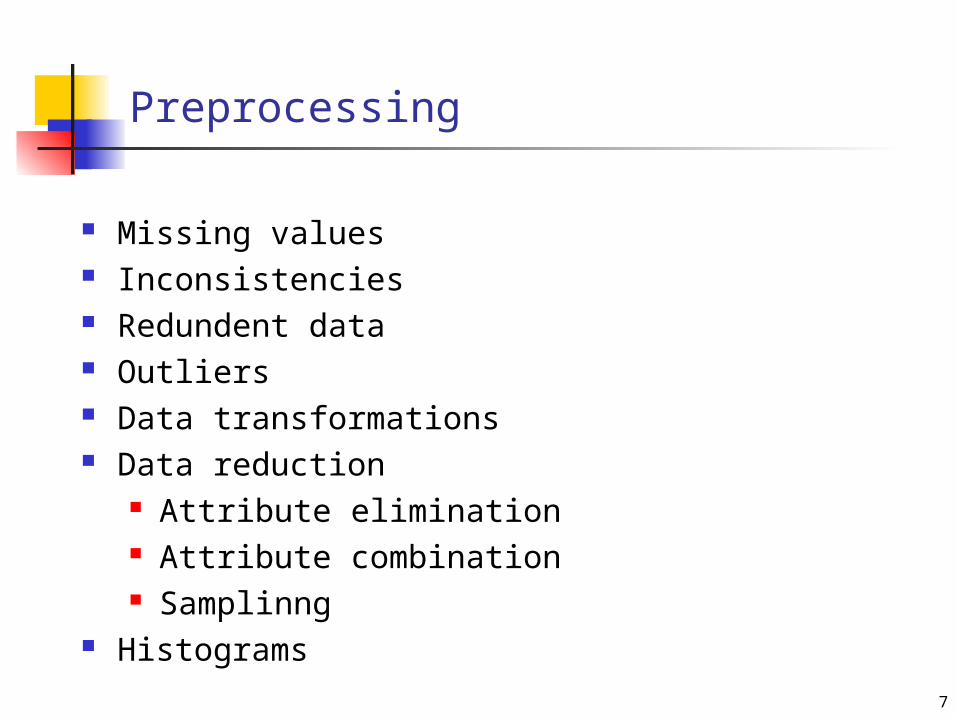
Missing values Inconsistencies Redundent data Outliers Data transformations Data reduction
Attribute elimination Attribute combination Samplinng
Histograms
8
Functionalities
Styles of Data Mining Descriptive - OLAP Classification Numerical Prediction Clustering Frequent Pattern Mining
9
Two basic style of data mining
Descriptive Cross tabulations,OLAP,attribute oriented
induction,clustering,association Predictive
Classification,numerical prediction Difference between classification and
numerical prediction Questions answered by these styles Supervised v.s. Unsupervised
10
Descriptive - OLAP
Concept of data cube Fact table
Measures – calculated measures Keys
Dimensions Sheams
Star, snowflake Concept hierarchies
Set grouping such as price age Parent child Attributes not suitable for concept hierarcies
11
Classification
Methods Decision trees Neureal networks Bayesian K-NN or model based reasoning
Adventages disadventages Given a problem which data processing
techniques are required Given a problem shich classification method or
algorithm is more apprpriate

12
Classification (cnt.d)
Accuracy of the model Measures for classification/numerical
prediction How to better estimate
Holdout,cross validation, bootstraping How to improve
Bagging, boosting For unbalanced classes What to do with models
Lift charts

13
Numercal Prediction
Learning is supervised Output variable is continuous Methods
Regression Simple Multiple
Most methods for classification can be used for numerical prediction as well
Accuricy Root mean square, absolute mean deviation
14
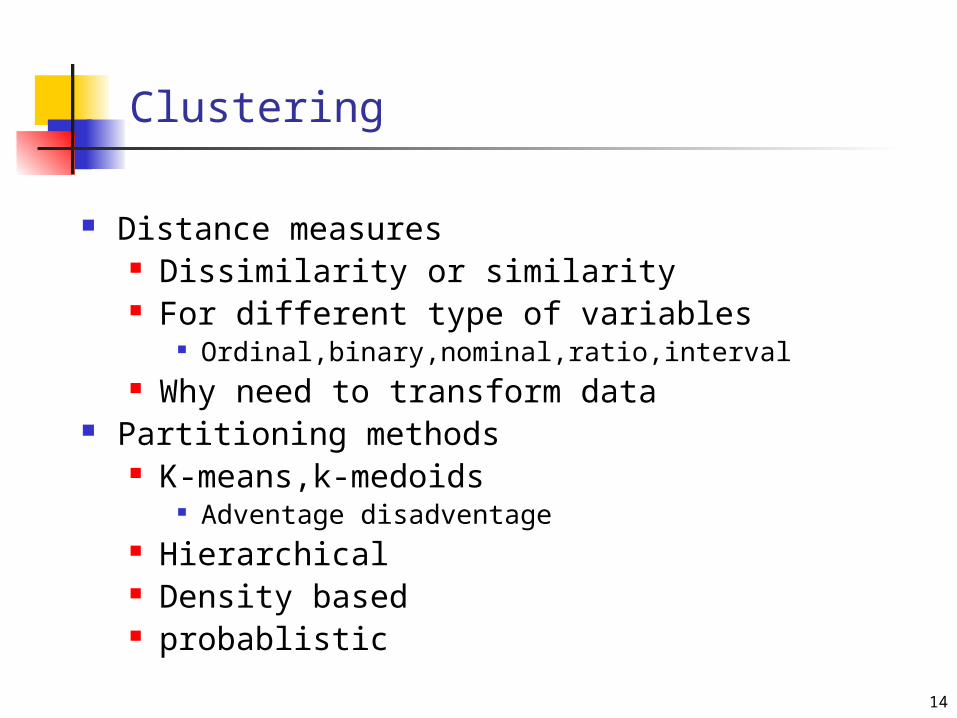
Clustering
Distance measures Dissimilarity or similarity For different type of variables
Ordinal,binary,nominal,ratio,interval Why need to transform data
Partitioning methods K-means,k-medoids
Adventage disadventage Hierarchical Density based probablistic
15
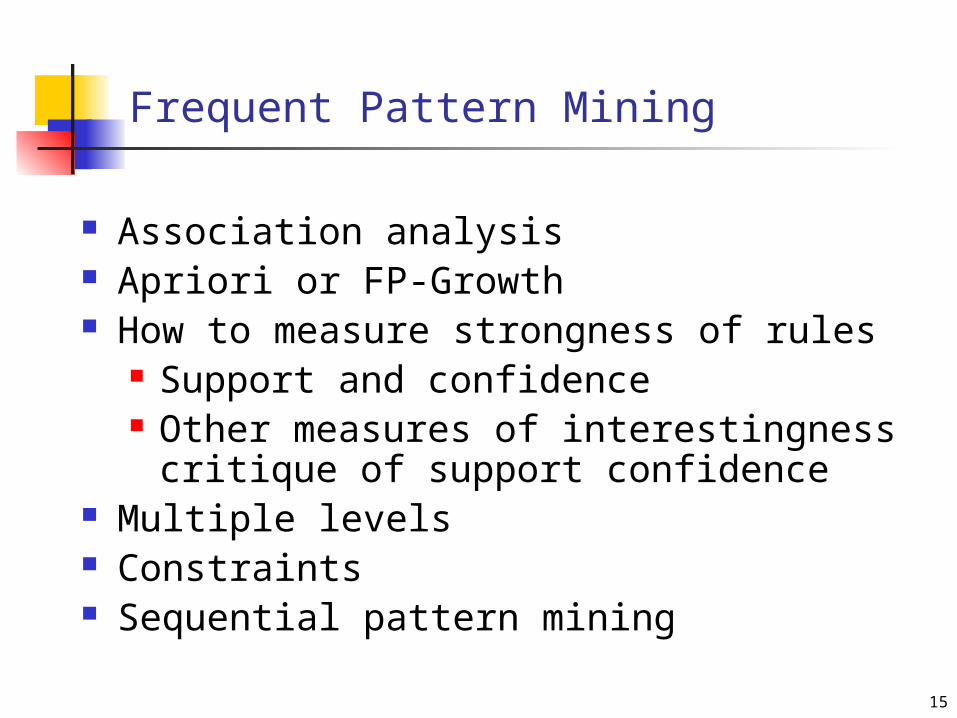
Frequent Pattern Mining
Association analysis Apriori or FP-Growth How to measure strongness of rules
Support and confidence Other measures of interestingness
critique of support confidence Multiple levels Constraints Sequential pattern mining
16
Outline
Methodology - Overview Introduction Data Description – Preprocessing OLAP Clustering Classification Numerical Prediction - Regression Frequent Pattern Mining Recent BIS Exams Unclassified Questions
17
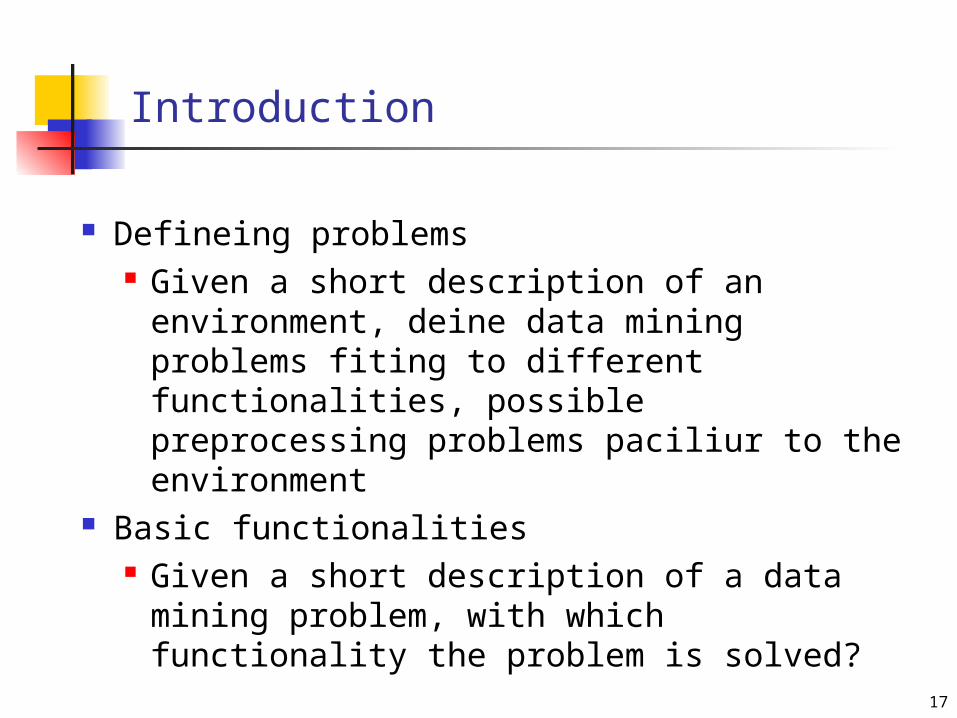
Introduction
Defineing problems Given a short description of an
environment, deine data mining problems fiting to different functionalities, possible preprocessing problems paciliur to the environment
Basic functionalities Given a short description of a data
mining problem, with which functionality the problem is solved?
18
Big University Library
1. Suppose that a data warehouse for Big-University Library consists of the following three dimensions: users, books, time, and each dimension has four levels not including the all level. There are three measures: You are asked to perform a data mining study on that warehouse (25 pnt)
Define three data mining problems on that warehouse: involving association, classification and clustering functionalities respectively. Clearly state the importance of each problem. What is the advantage of the data being organized as OLAP cubes compared to relational table organisation?
19
Big University Library (cont.)
In data preprocessing stage of the KDD
What are the reasons for missing values? and How do you handle them?
what are possible data inconsistencies do you make any discritization do you make any data transformations do you apply any data reduction strategies

20
Big University Library (cont.)
Define your target and input variables in classification. Which classification techniques and algorithms do you use in solving the classification problem? Support your answer
Define your variables indicating their categories in clustering Which clustering techniques and algorithms do you use in solving the clustering problem? Support your answer.
Describe association task in detail; specifying the algorithm interestingness measures or constraints if any.
21
Data mining on MIS
A data warehouse for the MIS department consists of the following four dimensions: student, course, instructor, semester and each dimension has five levels including the all level. There are two measures: count and average grade. At the lowest level of average grade is the actual grade of a student. You are asked to perform a data mining study on that warehouse (25 pnt)

22
Data mining on MIS (cont.)
Define three data mining problems on that warehouse: involving association, classification and clustering functionalities respectively. Clearly state the importance of each problem. What is the advantage of the data being organized as OLAP cubes compared to relational table organisation?
In data preprocessing stage of the KDD What are the reasons for missing values? and How do
you handle them? what are possible data inconsistencies do you make any discritization do you make any data transformations do you apply any data reduction strategies
23
Data mining on MIS (cont.)
Define your target and input variables in classification. Which classification techniques and algorithms do you use in solving the classification problem? Support your answer
Define your variables indicating their categories in clustering Which clustering techniques and algorithms do you use in solving the clustering problem? Support your answer.
Describe association task in detail; specifying the algorithm interestingness measures or constraints if any.
24
Outline
Methodology - Overview Introduction Data Description – Preprocessing OLAP Clustering Classification Numerical Prediction - Regression Frequent Pattern Mining Recent BIS Exams Unclassified Questions
25
Data Description
How to describe single variables – categorical and continuous
How to desribe two association between two variables bnoth continuous both categorical One continous, one categorical

26
Preprocessing
What to do as preprocessing? Which techniques are applied? For what reason?
27
MIS 542 Midterm 2011/2012 Fall PCA
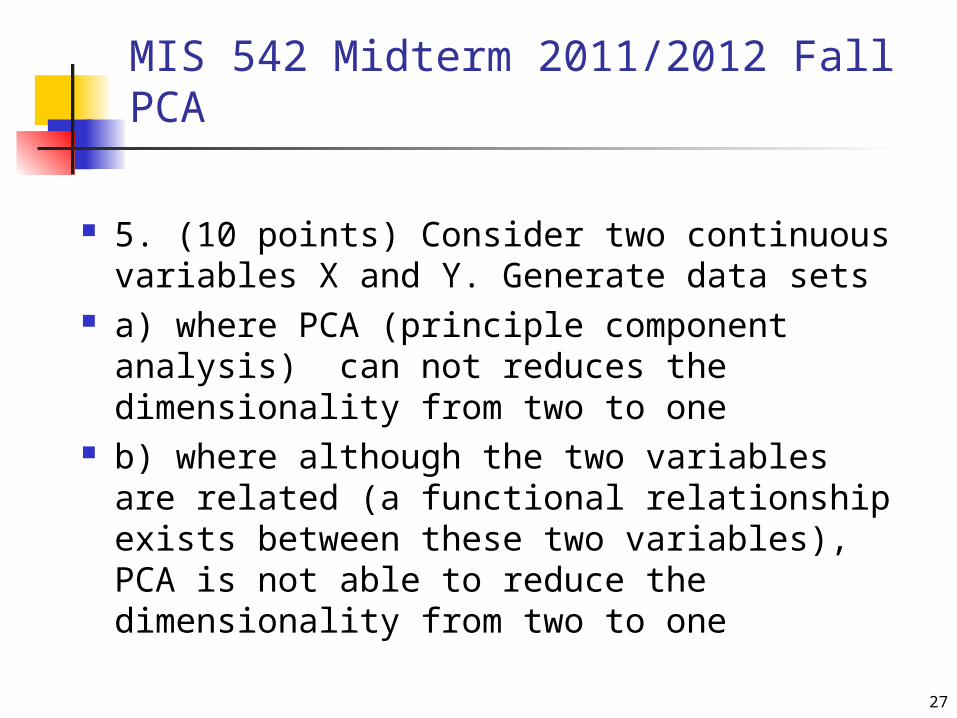
5. (10 points) Consider two continuous variables X and Y. Generate data sets
a) where PCA (principle component analysis) can not reduces the dimensionality from two to one
b) where although the two variables are related (a functional relationship exists between these two variables), PCA is not able to reduce the dimensionality from two to one

28
MIS 542 Final 2011/2012 Falloutliers
1 (20 points) Give two examples of outliers.
a) Where outliers are useful and essential patterns to be mined.
b) Outliers are useless steaming from error or noise.

29
MIS 542 Final 2011/2012 Fall transformations
2 (20 points) Considering the classification methods we cover in class, describe two distinct reasons why continuous input variables have to be normalized for classification problems(each reason 10 points).

30
Outline
Methodology - Overview Introduction Data Description – Preprocessing OLAP Clustering Classification Numerical Prediction - Regression Frequent Pattern Mining Recent BIS Exams Unclassified Questions

31
OLAP
Concept of data cube Fact table
Measures – calculated measures Keys
Dimensions Sheams
Star, snowflake Concept hierarchies
Set grouping such as price age Parent child Attributes not suitable for concept hierarcies
32
Data warehouse for library
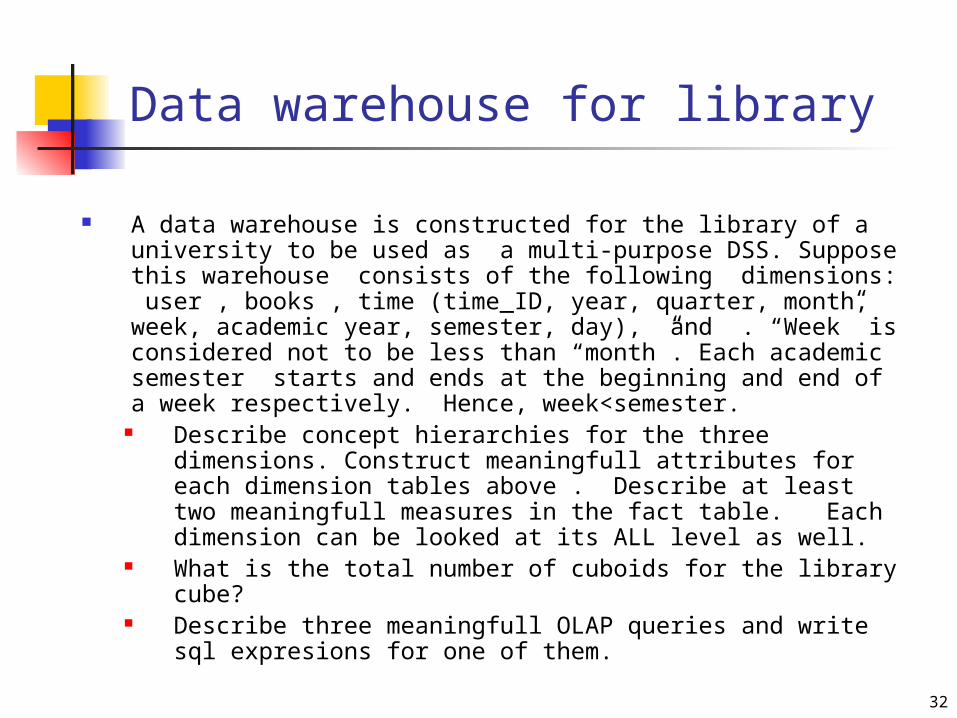
A data warehouse is constructed for the library of a university to be used as a multi-purpose DSS. Suppose this warehouse consists of the following dimensions: user , books , time (time_ID, year, quarter, month, week, academic year, semester, day), and . “Week” is considered not to be less than “month”. Each academic semester starts and ends at the beginning and end of a week respectively. Hence, week<semester.
Describe concept hierarchies for the three dimensions. Construct meaningfull attributes for each dimension tables above . Describe at least two meaningfull measures in the fact table. Each dimension can be looked at its ALL level as well.
What is the total number of cuboids for the library cube? Describe three meaningfull OLAP queries and write sql
expresions for one of them.

33
Big University
2. (Han page 100,2.4) Suppose that the data warehouse for the Big-University consists of the following dimensions: student,course,instructor,semester and two measures count and average_grade. Where at the lowset conceptual level (for a given student, instructor,course, and semester) the average grade measure stores teh actual grade of the student. At higher conceptual levels the average_grade stores the average grade for the given combination. (when student is MIS semester 2005 all terms, course MIS 541, instructor Ahmet Ak, average_grade is the average of students grades in thet course by that instructer in all semester in 2005)
34
Big University (cont.)
a) draw a snawflake sheam diagram for that warehouse
What are the concept hierarchys for the dimensions
b) What is the total nmber of cuboids

35
MIS 542 Final 2005/2006 Spring olap
1. MIS department wants to revise academic strategies for the following ten years. Relevent
questions are: What portion of the courese are required or elective? What is the full time part
time distribution of instuctors? What is the course load of instructors? What percent of
technical or managerial courses are thought by part time instructors? How all theses things
36
MIS 542 Final S06 1 cont.
changed over years? You can add similar stategic quustions of your own. Do not conside
students aspects of the problem for the time being. Desing and OLAP sheam to be used as a
strategic tool. You are free to decide the dimensions and the fact table. Describe the concept
hierarchies, virtual dimensions and calculated members. Finally show OLAP opperations to
answer three of such strategic questions
37
MIS 54 Final 2012/2013 Hospital
2. (20 pts) Suppose that a data warehouse for a hospital consists of the following dimensions: time, doctor and patient and the two measures count and charge, where charge is the fee a doctor charge a patient for a visit.
Design a warehouse with star schema: a) Fact table: Design the fact table. b) Dimension tables: For each dimension show a
reasonable concept hierarchy. c) State two questions that can be answered by
that OLAP cube. d) Show drilldown and roll up operations related
to one of these questions
38
Humman Resource cube
1. (25 points) In an organization a data warehouse is to be designed for evaluating performance of employees. To evaluate performance of an employee, survey questionnaire is consisting a set of questions with 5 Likered scale are answered by other employees in the same company at specified times. That is, performance of employees are rated by other employees.
Each employee has a set of characteristics including department, education,… Each survey is conducted at a particular date applied to some of the employees. Questions are aimed to evaluate broad categories of performance such as motivation, cooperation ability,…
Typically, a question in a survey, aiming to measure a specific attitude about an employee is evaluated by another employee (rated f rom 1 to 5) Data is available at question level.
39
Human resource cube (cont.)
Cube design: a star schema Fact table: Design the fact table should contain
one calculated member. What are the measures and keys?
Dimension tables: Employee, and Time are the two essential dimensions include a Survey and Question dimensions as well. For each dimension show a concept hierarchy.
State three questions that can be answered by that OLAP cube.
Show drilldown and role up operations related to these questions

40
MIS Midterm 2008/2009 Spring Shipment
1. (20 points) Consider a shipment company responsible for shipping items from one location to another on predetermined due dates. Design a star schema OLAP cube for this problem to be used by managers for decision making purposes. The dimensions are time, item to be shipped, person responsible for shipping the item, location.. For each of these dimensions determine three levels in the concept hierarchy. Design the fact table with appropriate measures:and keys (include two measure and at least one calculated member in the fact table)
Show one drilldown and role up operations Show the SQL query of one of the cuboids.
41
Outline
Clustering
42
Outline
Methodology - Overview Introduction Data Description – Preprocessing OLAP Clustering Classification Numerical Prediction - Regression Frequent Pattern Mining Recent BIS Exams Unclassified Questions

43
Comparing clustering methods
Clustering methods Partitioning, hierarchical, density based,
model-based: probabnlistic EM Compare clustering methods
Output İnterpreteation Sensitivity ot aoutliers Speed of computation
44
clustering
Construct simple data sets showing the inadequacies of k-means clustering (20 pnt)
this algorithm is not suitable of even spherical clusters of different sizes
What are the adventages and disadventage of using k-means

45
clustering
1. Consider a delivery center location decision problem in a city where a set of related products are to be delivered to markets located in the city. Design an algortihm for this lacation selection problem extending an algortihm we cover in class. State clearly the algorithm and its extensions.for this particular problem.
46
Clustering preferences
Consider a popular song competition. There are N competitors A1, A2,… AN. Number of voters is very large; a substantial fraction of the population of the country. Each voter is able to rank the competitors form best to worst e.g. for voter 1 (A4>A2>A3>A1) meaning that there are four competitors and A4 is the best for voter 1 A1 being the worst. Suppose preference data is available for a sample of n voters at the beginning of competition.
Develop a distance measure between the preferences of two voters i and j
Suppose you have the k-means algorithm available in a package. Describe how you can use the k-means algorithm to clusters voters according to their preferences.
47
MIS 542 Final 2005/2006 Spring
3. a) Describe how to modify k-means algorithm so as to handle categorical variables (binary, ordinal, nominal).
b) What is a disadventage of Agglomerative hierarchical clustering method in the case of large data. Suggest a way of eliminating this disadventages while benefiting the adventages of agglomerative methods
48
MIS 542 Midterm 2007/2008 Spring
Generate data set of two continuous variables X and Y. Consider clustering based on density
When clustered with one variable there (either X or Y) there is one cluster
When clustered with both variable there there are two clusters
49
MIS 542 Final 2011/2012 Fall
3 a (10 points) Generate data sets for two clustering problems with two continuous variables. Two natural clusters for the notion of density based clustering but the quality of these clusters are low for a partitioning approach based on dissimilarity such as k-means
3.b (10 points) Considering the advantages and disadvantages of partitioning and hierarchical agglomerative clustering approaches. Design a method for combining the two approaches to improve good clustering quality. (Finally there are hierarchies of clusters)
50
MIS Midterm 2011/2012 Fall
6. (25 points) A retail company asked to segment its customers. Following variables are available for each customer: age, income, gender number of children, occupation, house owner, have a car or not. There are 6 category of goods sold by the company and total purchases from each category is available for each customer, in addition average
inter-purchase time is also included in the database.
51
MIS Midterm 2011/2012 Fall
a) What are the types and scales of these variables?
b) If your tool has only k-means algorithm which of these variables are more suitable for the segmentation problem?
c) What data transformations are to be applied? d) How do you reduce number of variables used
in the analysis? e) If you want to include categorical variables
into your clustering, how would you treat them?
52
Midterm 2011/2012 Fall
In Question 3-5 artificial data sets are generated for given situations.
3. (10 points) Consider a data set of two continuous variables X and Y. There are two clusters (k=2)
Considering the advantages and disadvantages of partitioning methods k-means and k-medoids of clustering, generate two dimensional data set
a) (5 pnt) Produces almost the same clusters by k-medoids and k-means
b) (5 pnt) Produces different clusters by k-medoids and k-means

53
Outline
Methodology - Overview Introduction Data Description – Preprocessing OLAP Clustering Classification Numerical Prediction - Regression Frequent Pattern Mining Recent BIS Exams Unclassified Questions

54
Outline
Classification General Decision trees Neural networks Bayesian K-NN Accuricy Measures
55
Information gain
1. Consider a data set of two attributes A and B. A is continuous, whereas B is categorical, having two values as “y” and “n”, which can be considered as class of each observation. When attribute A is discretized into two equiwidth intervals no information is provided by the class attribute B but when discretized into three equiwidth intervals there is perfect information provided by B. Construct a simple dataset obeying these characteristics.
56
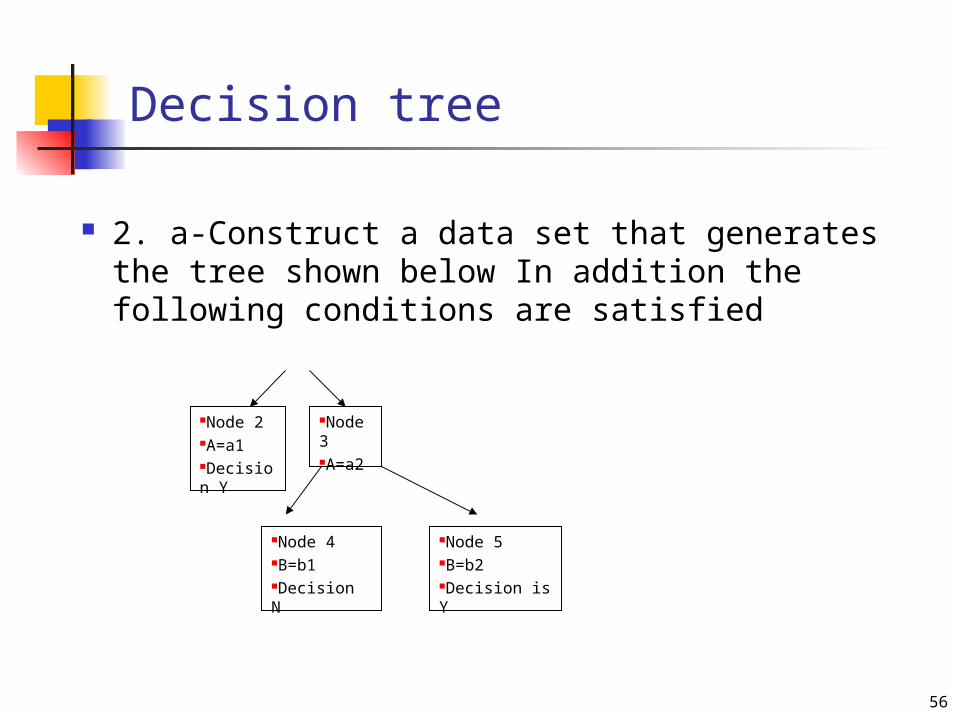
Decision tree
Node 2A=a1Decision Y
Node 3A=a2
Node 5B=b2Decision is Y
Node 4B=b1Decision N
2. a-Construct a data set that generates the tree shown below In addition the following conditions are satisfied
57
MIS 541 2012/2013 Final
1. (20 pts) Consider a decision tree with only two branches in that the attribute selection measure is entropy. Bearing in mind that each candidate input attribute may have more then two distinct values, how do you modify the ID3 algorithm to handle such a constraint on the number of branches of the tree.
58
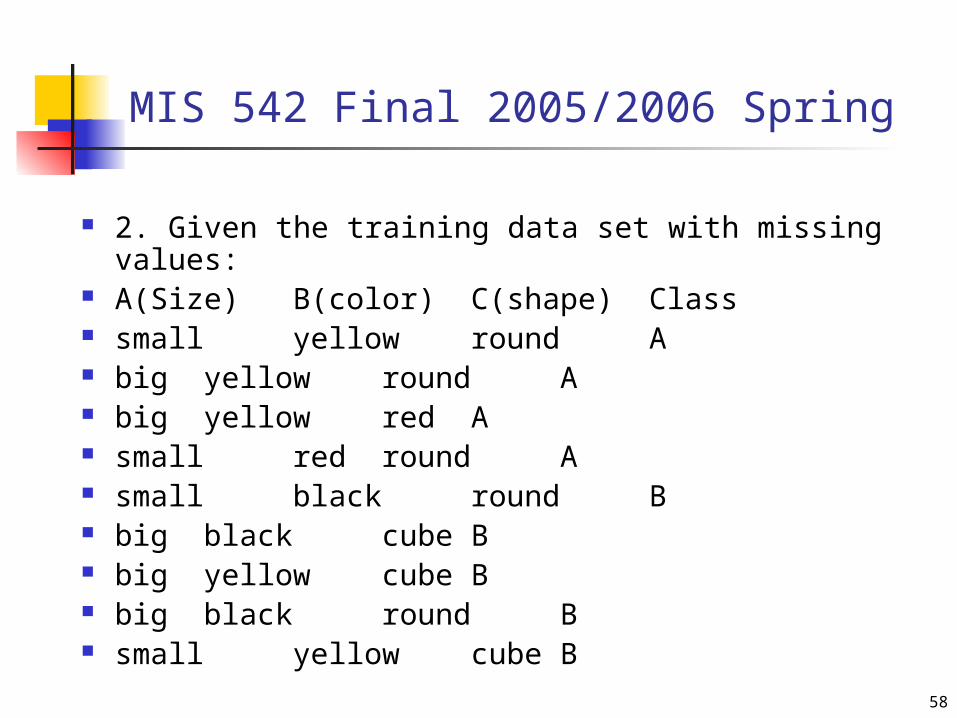
MIS 542 Final 2005/2006 Spring
2. Given the training data set with missing values: A(Size) B(color) C(shape) Class small yellow round A big yellow round A big yellow red A small red round A small black round B big black cube B big yellow cube B big black round B small yellow cube B

59
MIS 542 Final 2005/2006 Spring (cont.)
a) Apply the C4.5 algorithm to construct a decision tree.
b) Given the new inputs X:size= small,color= missing, shape=round.and Y:size= big,color= yellow, shape=missing What is the prediction of the tree for X and Y?
c) How do you classify the new data points given in part b) using Bayesian Classification?
d) Analyse the possibility of pruning the tree. You can make normal approximation to Binomial distribution though number of observations is low. z value for upper confidence limit of c=25% is 0.69.
60
MIS 542 Final S06 neural networks
4. Consider a classification problem with two classes as C1 and C2. There are two numerical input variables X1 and X2, taking values between 0 and infinity. All observations are of class C1, if they are above X2 = 1/X1 curve (a hyperbola) All other observations are class C2. Describe how multilayer perceptrons can separate such a boundary using as few hidden nodes as possible.
61
MIS 542 Midterm S08 2 cşass,f,cat,pm
Consider a clasification problem with two continuous variables X and Y and a categorical output with two distinct values C1 and C2
Generate data set such that A) Decision trees are appropriate for clasification B) Decision trees are not appropriate for clasification
but a perceptron can classify the data succesfully C) Even s single perceptron is not enough to classify
the data D) How do you encorporate a perceptron into
decision trees so that cases in B and C can be clasified by an hybrid approach of DTs and perceptron
62
Final 2010/2011 Spring
2 (30 pt.) Consider a prediction problem; e.g. predicting weight using height(a continuous variable) as input, solved by neural networks. Such methods as back propagation try to minimize the prediction error but it is claimed that the magnitude of error depends on the weight: a prediction error of 0.5 for a baby with a short height should not be the same as for an adult with a height of 2.00 meters.
a) Make a scatter plot of such a hypothetical data set for a two variable problem.
b) Plot the prediction error on another graph c) Do you need to modify the back propagation
algorithm so as to handle such a situation? If so explain your modification.
63
Final 2011/2012 Fall pverf,tt,mg
4. Illustrate the over fitting of neural networks for the following cases by generating data sets.
a) (10 points) For a binary classification problem with two continuous inputs.
b) (10 points) For a numerical prediction problem (output being continuous) with one continuous input variable.
64
Midterm 2011/2012 Fall
4. (10 points) Consider a classification by a decision tree problem. Consider a categorical input variable A having two distinct values. The output variable B has two distinct classes as well. At a particular node of the tree there are N data objects. Generate partitioning of data by input variable A for the following
a) A does not provide any information: does not decrease information gain at all.
b) A does provides perfect information: decrease information gain as much as possible

65
MIS 541 2012/2013 Final
5. (20 pts) Consider a classification problem solved by k-NN. Suppose in your dataset all inputs are continuous variables. Why do you need to apply any data transformations? What data transformation is applied? Suppose the variables are to be weighted after transformations. Device a method for determining optimal weights for variables s well as determining optimal k value considering that k-NN is a supervised learning method.
66
MIS 541 2012/2013 Final
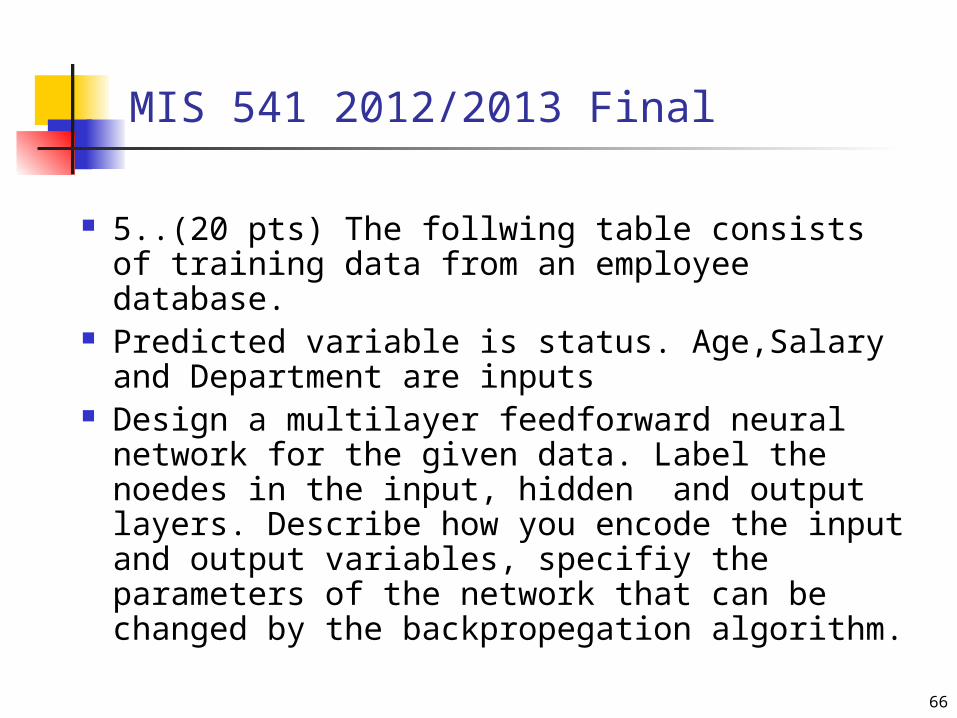
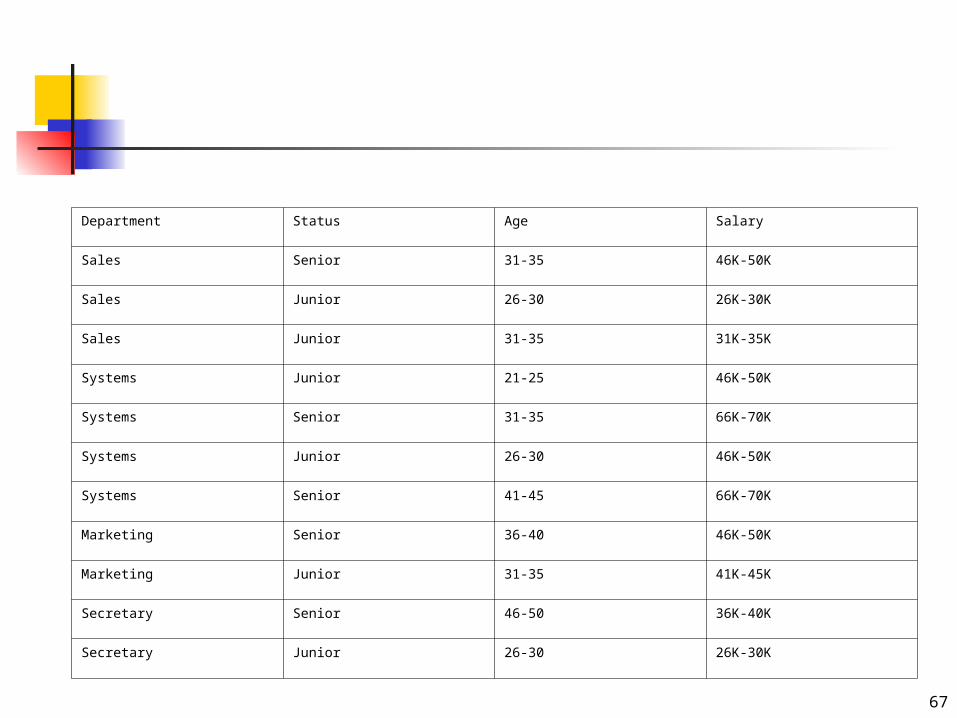
5..(20 pts) The follwing table consists of training data from an employee database.
Predicted variable is status. Age,Salary and Department are inputs
Design a multilayer feedforward neural network for the given data. Label the noedes in the input, hidden and output layers. Describe how you encode the input and output variables, specifiy the parameters of the network that can be changed by the backpropegation algorithm.
67
Department Status Age Salary
Sales Senior 31-35 46K-50K
Sales Junior 26-30 26K-30K
Sales Junior 31-35 31K-35K
Systems Junior 21-25 46K-50K
Systems Senior 31-35 66K-70K
Systems Junior 26-30 46K-50K
Systems Senior 41-45 66K-70K
Marketing Senior 36-40 46K-50K
Marketing Junior 31-35 41K-45K
Secretary Senior 46-50 36K-40K
Secretary Junior 26-30 26K-30K

68
Accuracy measures
For class balanjcy or unbalancy problems Output variables with ordinary scale
How do you modify the accuricy measure for an ordinal output variable with three different values
Give an example for such a variable

69
Outline
Methodology - Overview Introduction Data Description – Preprocessing OLAP Clustering Classification Numerical Prediction - Regression Frequent Pattern Mining Recent BIS Exams Unclassified Questions

70
BIS 541 2012/2013 Final II
5. Based on a sample of 30 observations the population regression model
Y i = 0+ 1x i + i The least square estimates of intercept is 10.0 Sum of the values of dependent and independent
variables are 450 and 150 respectively. Estimated variance of dependent variable is 25, variance
of the residuals is 4 a) What is the least square estimate of slope coefficient?
Interpret the figure. b) What are the values of SSR and SSE? c) Find and interpret the coefficient of determination. d) Test the null hypothesis that the explanatory variable X
does not have a significant effect on Y at confidence level of 95%.Critical value of F=0.05(1,28) = 4.20

71
BIS 541 2013/2014 Final
4. Based on a sample of 50 observations the population regression model to predict number of automobile sales (dependent variable) based on advertisement placements (independent variable)
Y i = 0+ 1x i + i The least square estimates of slope is 2.0 Average of the values of independent variable is
50. Sum of the values of dependent variable is 5390.
Total sum of squares for dependent variable is 9000 Variance of the residuals is 40

72
BIS 541 2013/2014 Final
a) What is the least square estimate of intercept coefficient? Interpret the figure.
b) Interpret the the slope coefficient. b) What are the values of SSR and SSE? c) Find and interpret the coefficient of
determination.
73
MIS 214 Midterm 2012/2015 Summer
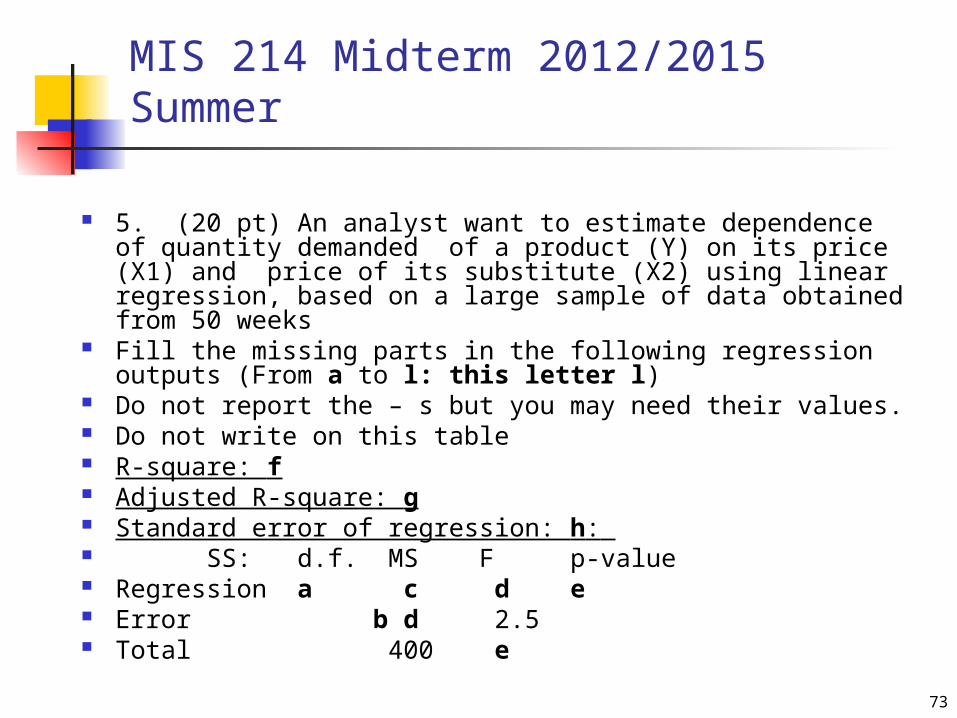
5. (20 pt) An analyst want to estimate dependence of quantity demanded of a product (Y) on its price (X1) and price of its substitute (X2) using linear regression, based on a large sample of data obtained from 50 weeks
Fill the missing parts in the following regression outputs (From a to l: this letter l)
Do not report the – s but you may need their values. Do not write on this table R-square: f Adjusted R-square: g Standard error of regression: h: SS: d.f. MS F p-value Regression a c d e Error b d 2.5 Total 400 e

74
MIS 214 Final 2013/2014 Spring
1 (20 pt) For the following four scenarios, each having two cases denoted by I and II, draw scatter plots of X (explanatory variable) and Y (dependent variable) showing the population regression model drawn as a line or curve as well. Use around 20-25 hypothetical points unless otherwise stated assumptions of least square are hold. In I and II population slope and intercepts are the same
a) In II variance of the error is higher than in I. b) In II coefficient of determination is higher than in I. c) In II spread of X is higher than in I. d) In II variance of the error term increases with higher
values of X.. In I, variance of error is homoscedastic.
75
Outline
Methodology - Overview Introduction Data Description – Preprocessing OLAP Clustering Classification Numerical Prediction - Regression Frequent Pattern Mining Recent BIS Exams Unclassified Questions

76
Exercise
a) Suppose A B and B C are strong rules Dose this imply that A C is also a strong rule? b) Suppose A C and B C are strong rules Dose this imply that A AND B C is also a strong
rule? c) Suppose A B and A C are strong rules Dose this imply that A B AND C is also a strong? d) Suppose A B AND C is a strong rule. Dose this
imply that A B and A C are strong rules? e) Suppose A AND B C is a strong rule. Dose this
imply that A C and B C are strong rules?

77
Exercise
a) Suppose {A,B,C} is a frequent 3 itemset. Dose it imply that {A,B} and {A,C} are frequent 2 itemsets?
b) Suppose {A,B}, {A,C}, and {B,C} are frequent 2 itemsets. Dose it imply that {A,B,C} is a frequent 3 itemset?
c) Suppose {A,B} is a frequent 2 itemset. Dose it imply that, A B and B A are strong rules?
78
Associations
1. In a particular database; AC and BC are strong association rules based on the support confidence measure. A and B are independent items. Does this imply that A BC is also a strong rule based on the lift measure? A,B,C are items in a transaction database.
2. -if A B and BC are strong. Is AC a strong rule
3. -if A B and AC are strong. İs BC a strong rule

79
MIS 542 midterm S06 association constratint
The price of each item in a store is nonnegative. For the following cases indicate the type of constraints (such as: monotone, untimonotone, tough, storngly convertable or succinct)
a) Containing at least one Nintendo Game.
b) The average price of items is between 100 and 500.

80
BIS 541 2012/2013 Final II
4. The questions about constaint-based association rule mining
The price of each item is nonnegative For the following cases indicate the type of constraints (monotonic, anti-monotonic or none)
a) the sum of prices of items is less then or equal to 10
b) the average price of items is less then or equal to 20

81
MIS 214 Final 2013/2015 Spring
(15 pt) Given that L4: {(1,2,3,4),(2,4,5,6)}where 1,2,...,6 are ID s of items.
a) Write a L3 consisting of five 3-itemsets
b) Write a C3 of seven 3-itemsets
82
Outline
Methodology - Overview Introduction Data Description – Preprocessing OLAP Clustering Classification Numerical Prediction - Regression Frequent Pattern Mining Recent BIS Exams Unclassified Questions
83
BIS 541 2011/2012 Final
1. For each of the following problem identify relevant data mining tasks
a) A weather analyst is interested in calculating the likely change in temperatue for the coming days.
b) A marketing analyst is looking for the groups of customers so as to apply different CRM strategies for ecach group
c) A medical doctor must decide whether a set of symptoms is an indication of a particular disease.
d) A educational psychologist would like to determine exceptional students to sugget them for special educational programs. .

84
BIS 541 2011/2012 Final
2. Develop a data warehouse for an insurance company using fact constellations scheme. The company holds insurance premiums paind by its customers for different type of policies as well as the payments in case of accidents to its customers. There are two facat tables for premiums and payments respectively. The dimensions are customer time, policy accident some are sheered by the two fact tables.
a) design the fact tables : keys and measures b) design the dimension tables their concept
hierarchies c) show one roll up and one drill down opperation

85
BIS 541 2011/2012 Final
3. Consider a customer segmentation problem to be solved with k-means algorithm. . The following variables are available in the dataset: gender, member card information, total spending in TL and education level.
a) what are the scales of these variables.? b) How would you transform data before
applying clustering? c) How do you find similarity/dissimilarity
between two customers?

86
BIS 541 2011/2012 Final
4. Construct a particular node of a decision tree There are 6 data points at that node. The output is a categorical variable with two distinct values. Generate a dtra set of three variables one bieing the output (Y) the others are inputs (X1 and X2) such that X1 reduces the information gane as much as possible whereas X2 dose not reduces the information gain at all.
87
BIS 541 2011/2012 Final
1. Generate two different data sets of two continuous input variables X1 and X2 for a clustering problem.
a) that would give almost the same set of clustering results when solved by k-means and k-medoids
b) that would give different set of clusters when solved by k-means and k-medoids
88
BIS 541 2011/2012 Final
2. Develop a data warehouse for holding academic performance of an university’s faculty members. The dimensions are time (here academic year is important but the day of the publication is a bit detailed) faculty member, paper. For an article publiched by a factulty member at a particular paper, number of citations taken.and the implact factor of that paper are important. Paper can be journal articles, conference proceedings journals can be in SCI or SSCI and each such ournal or conference has a prestige factor a continous variable.
a) design the fact table : keys and measures b) design the dimension tables their concept hierarchies c) describe in word fife different types of queries that can
be answered by the OLAP cube d) show two roll up and two drill down operation

89
BIS 541 2011/2012 Final
3. Generate data sets for a supervised learning problem solved by neural networks.
a) There are two continuous independent variables X1 and X2 and a class variable with two different values such as yes and no. On the same artificially generatred dataset illustrate the concept of overfitting by neural networks.
b) Illustrate the behavior of training and test errors as the complexity of the network increases
90
BIS 541 2011/2012 Final
4. Consider a classification problem to be solved by k-NN method. The output is whether the customer will buy a product or not. The inputs are income, age, education level of the customer and profession of the customer (having here distinct values)
a) Describe the data transformations needed in the preprocessing step to prepare the datra set to be classified by k-NN
b) How the data transformations are different from the solution of th same problem by neural networks.

91
BIS 541 2012/2013 Final II
1 For each of the following problem identify relevant data mining tasks with a brief explanation
a) A weather analyst is interested in wheather the temperature will be up or down for the coming day
b) An insurance analyst intends to group policy holders according to characteristics of customers and policies
c) A medical researcher is looking for symptoms that are occurring together among a large set of pationes.
d) An educational program director would like to determine likely GPA of applicant to a MA program from their ALES scores, undergraduate GPAs and enterence exam scores.

92
BIS 541 2012/2013 Final II
2. Develop a data warehouse for a weather bureau having so many probes located all over a large region, using star scheme. These probes collect basic weather data such as temperature , air pressure , humidity,… at each hour. All the data is sent to a central station to be processed. .
a) design the fact table : keys and measures b) design the dimension tables their concept
hierarchies c) state two questions that can be answered by
querying the warehouse. d) show one roll up and one drill down operation
abour one of these questions

93
BIS 541 2012/2013 Final II
Evaluate the four classification methods: decision threes, neural networks, Bayesian classification and k-NN in terms of
a) accuricy b) speed of model development and use c) understandability and interpretability
of output d) handling of outlayers if not handled in
preprocessing step

94
BIS 541 2012/2013 Final II
4. The questions about constaint-based association rule mining
The price of each item is nonnegative For the following cases indicate the type of constraints (monotonic, anti-monotonic or none)
a) the sum of prices of items is less then or equal to 10
b) the average price of items is less then or equal to 20
95
BIS 541 2012/2013 Final II
5. Based on a sample of 30 observations the population regression model
Y i = 0+ 1x i + i The least square estimates of intercept is 10.0 Sum of the values of dependent and independent
variables are 450 and 150 respectively. Estimated variance of dependent variable is 25, variance
of the residuals is 4 a) What is the least square estimate of slope coefficient?
Interpret the figure. b) What are the values of SSR and SSE? c) Find and interpret the coefficient of determination. d) Test the null hypothesis that the explanatory variable X
does not have a significant effect on Y at confidence level of 95%.Critical value of F=0.05(1,28) = 4.20
96
BIS 541 2013/2014 Final
1. For each of the following problem identify relevant data mining tasks with a brief explanation
a) A financial analyst is interested in wheather the stock market index will be up or down for the coming day
b) Cities in Turkey are grouped according to their voting characteristics after the Republic of President election.
c) A security specialist is interested in determining mail message are spam or no looking at words passing the messages.
d) A medical doctor is interested in what symptoms (binary variables) occur together for a specific gtype of canser.
97
BIS 541 2013/2014 Final
2. Evaluate the four clustering methods: k-means, k-medoids, hierarchical, model-based (probalictic) in terms of
a) handling of non-spherical shapes b) speed of model development c) understandability and interpretability of
output d) sensitivity to outlayers. In each of these aspects mention only the
remarkable methods (you need not mantion all methods in all aspects)
98
BIS 541 2013/2014 Final
3. Develop a data warehouse for the election to selection of president of republic. There are so many poll stations (sandık) located all over the country. Using star scheme.. Each pool station has valid notes for each of the three candidates, invalid ots and total number of voters. Each poll station has a set of lacation related variables such as district, city,.some characteristics of cities There is no time dimension in this version of the problem.

99
BIS 541 2013/2014 Final
a) design a warehouse with star shame: fact table : keys and measures and at least two calculated measures.
b) design the dimension tables their concept hierarchies
c) state two questions that can be answered by querying the warehouse.
d) show one roll up and one drill down operation abour one of these questions
100
BIS 541 2013/2014 Final
4. Based on a sample of 50 observations the population regression model to predict number of automobile sales (dependent variable) based on advertisement placements (independent variable)
Y i = 0+ 1x i + i The least square estimates of slope is 2.0 Average of the values of independent variable is
50. Sum of the values of dependent variable is 5390.
Total sum of squares for dependent variable is 9000 Variance of the residuals is 40

101
BIS 541 2013/2014 Final
a) What is the least square estimate of intercept coefficient? Interpret the figure.
b) Interpret the the slope coefficient. b) What are the values of SSR and SSE? c) Find and interpret the coefficient of
determination.

102
Outline
Methodology - Overview Introduction Data Description – Preprocessing OLAP Clustering Classification Numerical Prediction - Regression Frequent Pattern Mining Recent BIS Exams Unclassified Questions
103
5. (25 points) Consider a data set representing the interactions among a set of people. The degree of interaction is a positive real number; high values can be interpreted as, the two members are closely related (they have close interactions such as heavy telephone calls or mail traffic between them) In other words rather then including the coordinates of variables directly, the similarity/dissimilarity matrix is given. This is a symmetric matrix. Develop an algorithm for clustering similar objects into same clusters. Assume that number of clusters (k) is given
104
3. (25 points) Consider a data set of two continuous variables X and Y. X is right skewed and Y is left skewed. Both represent measures about same quantity (sales categories, exam grades,…)
a) Draw typical distributions of X and Y separately.
b) Draw box plots of X and Y separately. c) Draw q-plots (quantile) of X and Y
separately. d) Draw q-q plot of X and Y.
105
4. (25 points) A strategy for clustering high dimensional data of continuous variables is: First apply principle components to reduce the dimensionality of the data set and apply clustering on the reduced form of the data. Discuss the drawback(s) of this approach.
106
MIS 541 2012/2013 Final
1. (20 pts) Consider a data set of two continuous variables X and Y. X both has the same mean, both have no skewness (symetric)ç X has a higher variance then Y. Both represent measures about same quantity (sales categories, exam grades,…)
a) Draw typical distributions of X and Y on the same graph.
b) Draw box plots of X and Y separately.

107
MIS 541 2012/2013 Final
2. (20 pts) Illustrate with plots of two continuous inputs and binary class that one layer neural networks are enough to classify convex class boundaries Two hidden layers are enough to capture even non convex class boundaries.
108
MIS 541 2012/2013 Final
3. (20 pts) Consider association rules X Y where X is a categorical variable with more then two values and Y is originally continuous but discretize into categories. Give example variables for X and Y. Illustrate that confidence as an interestingness measure may be misleading. Suggest a modification to the classical confidence so as to eliminate its drawback for this type of variables.
109
MIS 541 2012/2013 Final
4. (20 pts) The price of each item is nonnegative For the following cases indicate the type of constraints (monotone, anti-monotone, tough, strongly convertible or succinct)
a) the sum of prices of items is less then or equal to 10
b) the average price of items is less then or equal to 20
110
Midterm 2008/2009 Spring
2.(20) Consider a classification problem in that customers that are taking consumer credits from a bank are classified into three risk groups The input variables are age: discretized into 4 groups, income into 4 groups, education into four groups, gender, number of months the customer is dealing with the bank and average delay of payments in months, and current value of the accont balance. The output variable has 3 categories as risky, normal or highly risky calculated by some procedure and provided to the data miner. Design an encoding schema for the input and output variables so that the problem will be solved by a neural network Show a typical topology of a feedforward network architecture
111
Midterm 2008/2009 Spring
3. (20 points) Consider a classification by a decision three problem. There are two categorical input variables A and B having two distinct values each. The output variable C has two distinct classes. Suppose the dataset is suitable for using decision threes. Is the order of selection of variables affects the classification error? Support your answer by generating data sets pictorially. (stoping condition is either a pure class is obtained or no variables remains to be tested)

112
Midterm 2008/2009 Spring
4. (20 points) Principle components is used for dimensionality reduction then may be followed by cluster analysis – say for segmentation purposes – Consider a two continuous variable problem. Using scatter plots
a) Generate a data set where PCA reduces the dimensionality from two to one
b) Generate a data set where although there is a relation between the two variables, PCA
is not able to reduce the dimensionality to one c) Generate a data set where there are natural clusters
and PCA can reduce the dimensionality d) Generate a data set where there are natural clusters
but PCA is not the appropriate method for reducing the dimensionality