The DYnamics of ConflicT in the MulTieThnic Union of mYanmar
Upload
roxanne-warrenCategory
view
215download
0
1
Cost Effectiveness of Outreach Interventions for Low-Income
Multiethnic Women
Todd Wagner, VA & StanfordRena Pasick, UCSF
Stephen McPhee, UCSFJeanne Mandelblatt, Georgetown
Clyde Schechter, Albert Einstein SOM
July 27, 2005Funded by NCI
2
Trends in Breast and Cervical Cancer
• Breast cancer between 1990 and 2000– age-adjusted mortality declined 2.3% per year– incidence increased ~0.4% per annum
• Cervical cancer 1992-1999– age-adjusted annual incidence declined by
9.3%– mortality rates declined by 2.3%
SEER data: Ries L, Eisner M, Kosary C, et al. Cancer Statistics Review, 1975-2000. Bethesda, MD: National Cancer Institute; 2003.
3
What is Driving these Changes?
• May be caused by diagnostic technologies– Mammogram– Papanicolaou (Pap) smear
• Collinear with changes in – Record keeping– Natural changes in disease / other risk factors

4
Belief in Diagnostics
• USPSTF and many health plans endorse the use of mammography and Pap smear
• Debates about benefits of mammographySee: Gotzsche and Olsen
Lancet. Jan 8 2000;355(9198):129-134.
Lancet. Oct 20 2001;358(9290):1340-1342.
Lancet. Jul 27 2002;360(9329):338-339

5
Breast Cancer
Incidence
Ries L, Eisner M, Kosary C, et al. Cancer Statistics Review, 1975-2000. Bethesda, MD: National Cancer Institute; 2003.
6
Cancer Screening Promotion
• Health providers frequently use:– Outreach (e.g., patient reminders): encourages
women to see their provider for a mammogram (or Pap)
– Inreach (e.g., physician reminders): reminds the physician to schedule a mammogram (or Pap)
7
Role of race/ethnicity
• There are notable disparities by race/ethnicity• Disentangling the influence of biologic and socio-
economic factors is the subject of considerable debate
• Physician reminders assumes access, but disparities in access exist
• Unknown whether patient reminders are equally effective across racial/ethnic subgroups

8
Project 1
• Project 1: we assessed the cost effectiveness of providing individually and culturally tailored printed health guides and telephone counseling to improve periodic breast and cervical cancer screening among low-income multi-ethnic women

9
Methods
• Randomized, controlled cohort study
• Modified random digit dialing (Mitofsky-Waksberg)
• Targeted 86 low-income and ethnically diverse census tracts in Alameda county

10
Eligibility
1. Age 40-742. African American, Chinese, Filipina, Latina, or
non-Hispanic white3. Speak English, Cantonese, Tagalog, or Spanish4. Residence in a targeted census tracts 5. No history of cancer6. Willingness to be randomly assigned to an
intervention or control group, tracked for 3 years, and medical record review

11
Enrollment
• 46,206 telephone calls – 32,521 (70%) were households
• 15,264 (47%) households screened for eligibility• 2964 (19% of households) contained an eligible
subject. – 1841 (62% of those eligible) consented to participate.
– 1463 completed the baseline interview and were randomized
– 1175 (80.3% of those randomized) completed the study
12
Intervention and Usual Care
• Intervention components– an individually and culturally tailored printed
health guide – telephone counseling
• Usual Care– Women in the control group received usual care
from their provider, if any

13
Cost Estimation
• Micro-costed the intervention– Variable cost: outreach worker forms (507
hours)– Fixed cost: Space, QA, Supplies
• Costs were standardized to 2002
• Research costs were excluded
14
Effectiveness
• Receipt of recent mammography and recent Pap smear (last 15 month).
• Self report data– Accuracy of self report varied by race-ethnicity– McPhee SJ, Nguyen TT, Shema SJ, et al.
Validation of recall of breast and cervical cancer screening by women in an ethnically diverse population. Prev Med. Nov 2002;35(5):463-473.

15
Cost Effectiveness Analysis
• We calculated the incremental cost per woman screened
C1-C0
E1-E0
Incremental Cost-Effectiveness Ratio
=

16
Behavioral Interventions
• General CEA framework holds, but caveats…
– Behavior change is a “slow” process
– Treat many to prevent a few
– Use of intermediate outcomes (proxies)

17
Intermediate Outcomes• Outcome is clinically relevant and predicts
mortality or morbidity– Receipt of a mammogram– Substance use abstinence– Change in dietary fiber
• QALYs would require huge and/or very long studies
18
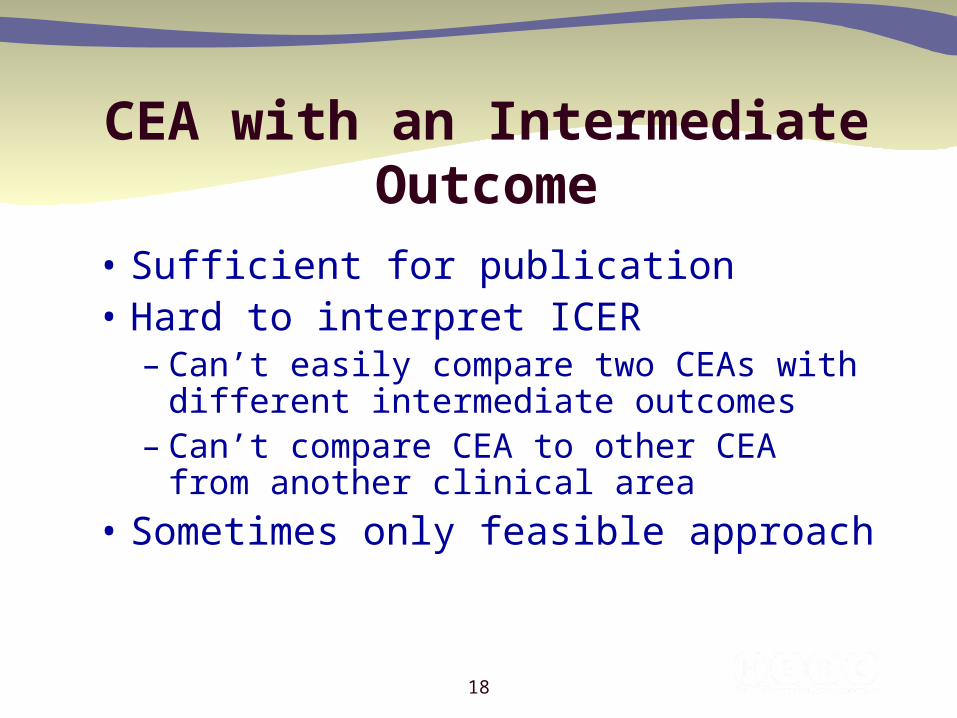
CEA with an Intermediate Outcome
• Sufficient for publication• Hard to interpret ICER
– Can’t easily compare two CEAs with different intermediate outcomes
– Can’t compare CEA to other CEA from another clinical area
• Sometimes only feasible approach

19
CEA with QALYs
• Measure QALYs or
• Translate intermediate outcome to QALYs– Either build a model de novo or use an
existing model– Requires a lot of resources
• Most useful, but most challenging

20
CEA and Behavior Change
• “Getting the person to recognize that they have a problem is half the battle.”
• Behavior change is a process, not a dichotomous outcome
• Need to measure:– Starting point in the process– Movement in the process
Wagner TH, Goldstein MK. Behavioral interventions and cost-effectiveness analysis. Prev Med 2004;39(6):1208-14.

21
Subgroup Analysis
• Calculated cost-effectiveness ratios by baseline stage of change.
• never
• inconsistent (prior test, but not in last 15 months)
• recent (prior test in last 15 months)
• regular (prior test in last 15 months and another within two years of the last test).

22
Cost per Life Year Saved
• Modified existing model to assess cost per life year saved.– Only effects of mammography are included
• Mandelblatt JS, Schechter CB, Yabroff KR, et al. (2004) Benefits and costs of interventions to improve breast cancer outcomes in African American women. J Clin Oncol. 22(13):2554-2566.
23
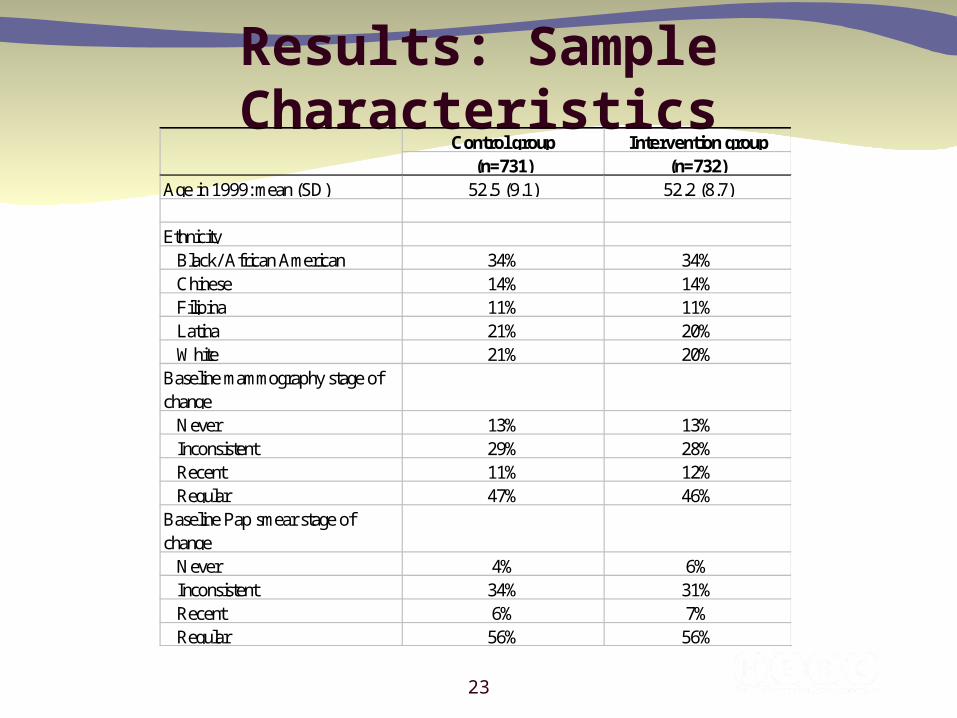
Results: Sample CharacteristicsControl group Intervention group
(n=731) (n=732)Age in 1999: mean (SD) 52.5 (9.1) 52.2 (8.7)
EthnicityBlack/ African American 34% 34%Chinese 14% 14%Filipina 11% 11%Latina 21% 20%White 21% 20%
Baseline mammography stage of change
Never 13% 13%Inconsistent 29% 28%Recent 11% 12%Regular 47% 46%
Baseline Pap smear stage of change
Never 4% 6%Inconsistent 34% 31%Recent 6% 7%Regular 56% 56%

24
Mammography Effect
Total n % Recent Total n % Recent OR 95% CI p-value
African American 204 68.1 203 73.4 1.3 (0.84, 1.98) 0.243Chinese 73 79.5 81 86.4 1.7 (0.70, 3.86) 0.249Filipina 58 67.2 63 79.4 1.9 (0.82, 4.26) 0.131Latina 117 62.4 118 69.5 1.4 (0.80, 2.36) 0.251White 128 70.3 130 79.2 1.6 (0.91, 2.84) 0.099All 580 68.8 595 76.3 1.5 (1.13, 1.89) 0.004Intention to Treat 731 54.6 732 62 1.4 (1.10, 1.67) 0.004Note: p=0.922 for race/ethnic difference in intervention effect
Control Intervention
25
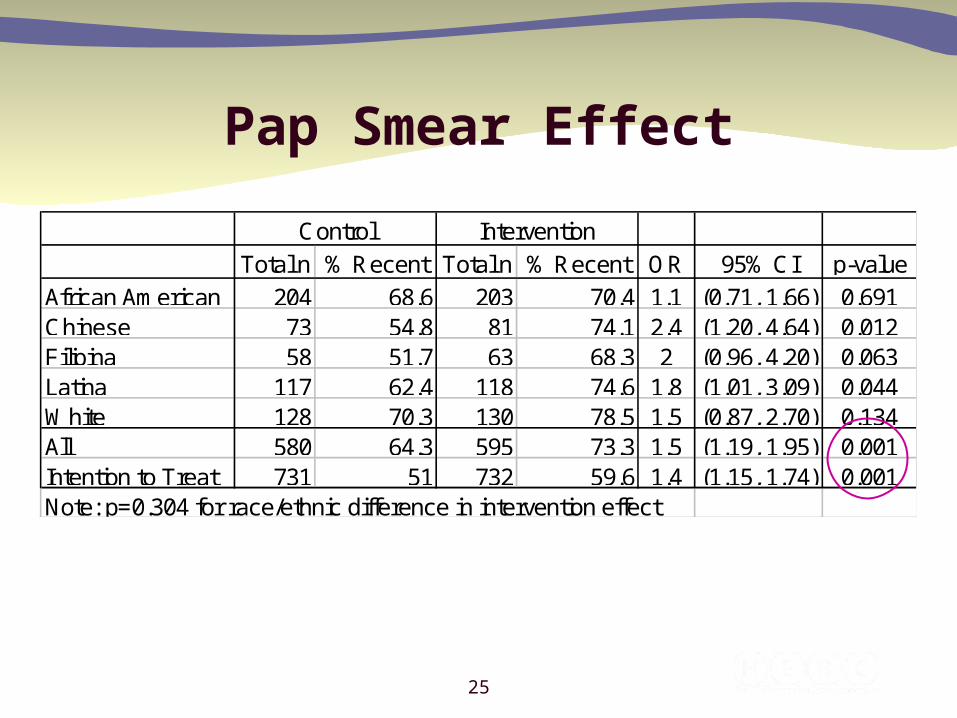
Pap Smear Effect
Total n % Recent Total n % Recent OR 95% CI p-value
African American 204 68.6 203 70.4 1.1 (0.71, 1.66) 0.691Chinese 73 54.8 81 74.1 2.4 (1.20, 4.64) 0.012Filipina 58 51.7 63 68.3 2 (0.96, 4.20) 0.063Latina 117 62.4 118 74.6 1.8 (1.01, 3.09) 0.044White 128 70.3 130 78.5 1.5 (0.87, 2.70) 0.134All 580 64.3 595 73.3 1.5 (1.19, 1.95) 0.001Intention to Treat 731 51 732 59.6 1.4 (1.15, 1.74) 0.001Note: p=0.304 for race/ethnic difference in intervention effect
Control Intervention

26
Unit CostsControl group
(n=731)Intervention group
(n=732)Variable costsOutreach workers: mean (SD) $0 $18.17 Audiotaped health guide, if requested by participant $0 $6.14
Fixed costs1
Obtaining administrative data to make health guides $0 $0.12 Making health guides (2 guides at $3 per unit) $0 $6.00 Mailing health guides $0 $3.66 Outreach worker quality assurance $0 $3.28 Subtotal $0 $13.06
Total cost including outreach worker overhead: mean (SD) $0 $32.41
27
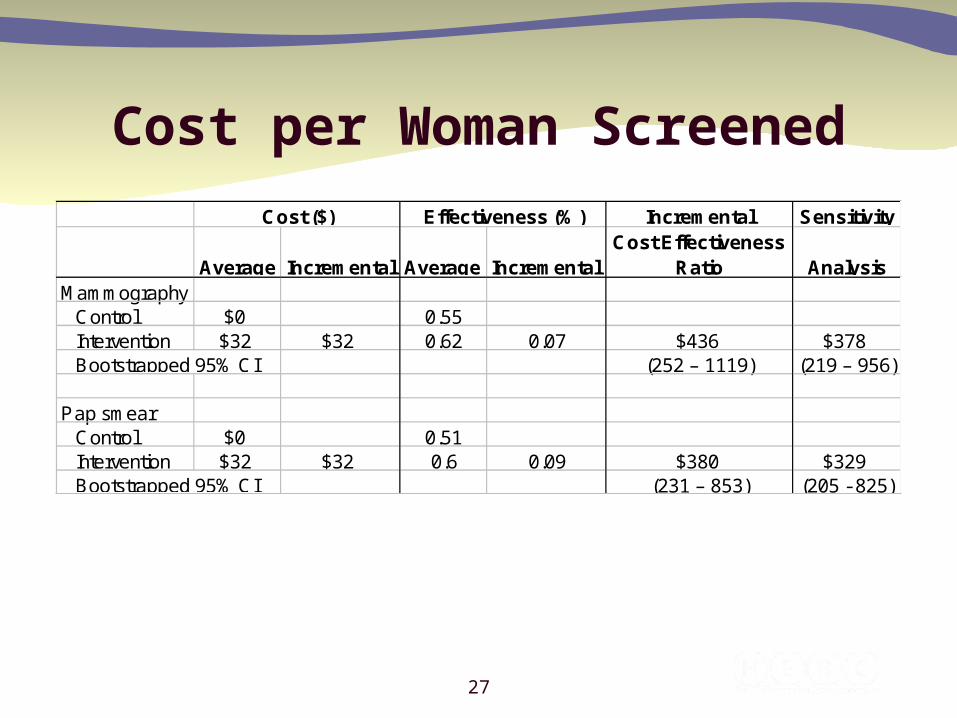
Cost per Woman Screened
Incremental Sensitivity
Average Incremental Average IncrementalCost Effectiveness
Ratio AnalysisMammography
Control $0 0.55Intervention $32 $32 0.62 0.07 $436 $378
(252 – 1119) (219 – 956)
Pap smearControl $0 0.51Intervention $32 $32 0.6 0.09 $380 $329
(231 – 853) (205 - 825)
Cost ($) Effectiveness (%)
Bootstrapped 95% CI
Bootstrapped 95% CI

28
Subgroup Analysis
Control Int Diff (A) Control Int Diff (B)ICER (A/B)
Sensitivity ICER
CEA by stage of changeMammography
Never (n=81) 0 49.25 49.25 36.6 35.1 -1.51 -3,266 -27,231Inconsistent (n=182) 0 32.43 32.43 40.9 50.5 9.56 339 293Recent (n=80) 0 32.74 32.74 50.6 56 5.43 603 522Regular (n=316) 0 27.5 27.5 69 78.2 9.23 298 264
Pap smearNever (n=42) 0 66.69 66.69 14.3 42.6 28.27 236 194Inconsistent (n=194) 0 32.86 32.86 30.1 45.1 15.01 219 189Recent (n=47) 0 33.59 33.59 36.4 58 21.64 155 135Regular (n=376) 0 28.1 28.1 67.6 69.6 2.03 1,383 1,220
Costs ($) Effectiveness (%)

29
Usual Care InterventionSensitivity analysis
Effectiveness per womanLife years 36.54835 36.55098 36.55098Discounted life years 21.30439 21.30523 21.30523QALYs 20.18217 20.18243 20.18243Incremental life years saved -- 0.0008 0.0008
0.0003 0.0003Costs per woman: One Dose
Treatment 3753.381 3787.333 3787.333Mammograms 184.28 207.71 207.71Workups 22.32 25.18 25.18Intervention 0.00 32.00 28.10
Average cost 3959.981 4052.223 4048.323Incremental cost -- 92.24 88.34Cost per life year saved -- 109,812 105169
Costs per woman: biennial dose 3959.981 4407 4366incremental cost 447 406Cost per life year saved 531,908 483,356
Cost per Life Year Saved

30
Summary
• Incremental cost per woman screened – $436 per mammography – $380 per Pap smear
• Cost per life year saved of $109,812->$500,000– Low estimate= 1 “dose”– High estimate= repeats every two years– Annually > $1 million

31
Prior Research
• Andersen et al (2002) much lower cost-effectiveness ratio, but effectiveness of intervention was not statistically significant.
• Our intervention was highly effective (+7% more than Andersen)

32
Limitations
• Cannot separate effect of health guide versus telephone counseling
• No utility weights in model
• Model only looks at mammography
33
Project 2: Abnormal Pap Smears
• Highland Hospital (Oakland CA) routinely performs Pap smears in the ED
• Low rates of follow-up among abnormal Pap smears (~30%)

34
Project 2
• Usual care: send the woman a letter if there is an abnormal Pap smear
• This study evaluates the cost-effectiveness of usual care (a mailed postal reminder) with a tailored outreach intervention compared to usual care alone

35
Pap Abnormality
• Atypical squamous cells of undetermined significance (ASCUS)
• Atypical glandular cells of undetermined significance (AGUS)
• Low-grade squamous intraepithelial lesion (LGSIL)
• High-grade squamous intraepithelial lesion (HGSIL)
Solomon D, Davey D, Kurman R, et al. The 2001 Bethesda System: terminology for reporting results of cervical cytology. JAMA 2002; 287:2114-9.

36
Methods
• Eligibility– Abnormal Pap at Highland Hospital– Age 18-74 – English or Spanish speaking
• Excluded– In process of follow-up– Pregnant and due after intervention period

37
Intervention
• Randomized, controlled cohort trial
• Two groups– Usual care: notified by telephone or mail, depending on
the degree of abnormality
– Usual care plus outreach and tailored individual counseling
• Randomization without consent; 6-month rescue

38
Main Outcomes
• Follow-up at 6 months
• Costs
• Incremental cost per follow-up

39
Costing
• Micro-costed the intervention– Variable cost: outreach worker forms– Fixed cost: Space, QA, Supplies
• We used payroll systems to identify outreach worker overhead costs

40
ResultsIntervention group
Control (usual care) group p value
N 178 170
Race 0.31African American 49.40% 49.40%Latina 37.10% 32.90%White 6.70% 5.30% Other 6.70% 12.40%
English--speaking 65.70% 68.20% 0.62Age 0.63
18-29 46.60% 50.00%30-39 21.90% 24.70%40-49 18.50% 14.10%50-74 12.90% 11.20%
Pregnant 17.40% 15.90% 0.7Reason for Pap test 0.53
Routine 64.00% 58.20%Diagnostic 33.70% 39.40%Unknown 2.20% 2.40%
Result of Pap test 0.98ASCUS/AGUS 79.20% 80.00%LGSIL 12.40% 11.80%HGSIL 8.40% 8.20%

41
Effectiveness (non-OB)Abnormal Pap Follow-up at Highland Hospital
non-OB Patients
0%
10%
20%
30%
40%
50%
60%
70%
80%
90%
100%
1 2 3 4 5 6 7 8 9 10 11 12 > 12
Months since Initial Pap
Cu
mu
lati
ve %
Fo
llo
wed
Up
Intervention Control

42
Effectiveness (OB)Abnormal Pap Follow-up at Highland Hospital
OB Patients
0%
10%
20%
30%
40%
50%
60%
70%
80%
90%
100%
1 2 3 4 5 6 7 8 9 10 11 12 > 12
Months since Delivery
Cu
mu
lati
ve %
Fo
llo
wed
Up
Intervention Control

43
Unit CostsIntervention (n=178) Usual care (n=170)
Variable costs per participantOutreach worker direct time: mean hours (SD) 2.39 (1.68) 0Outreach worker time with overhead: mean hours (SD) 6.38 (4.72) 0Outreach worker costs: mean (SD) $142.16 ($105.23) $0 Travel costs at $.365 per mile: mean (SD) $4.34 ($7.01) $0
Fixed costs per participantOffice space and supplies $28.09 $0 Outreach worker quality assurance $19.27 $0 Subtotal $47.36 $0
Total unit cost, including outreach worker overhead: Mean (SD) $193.86 ($108.72) $0
44
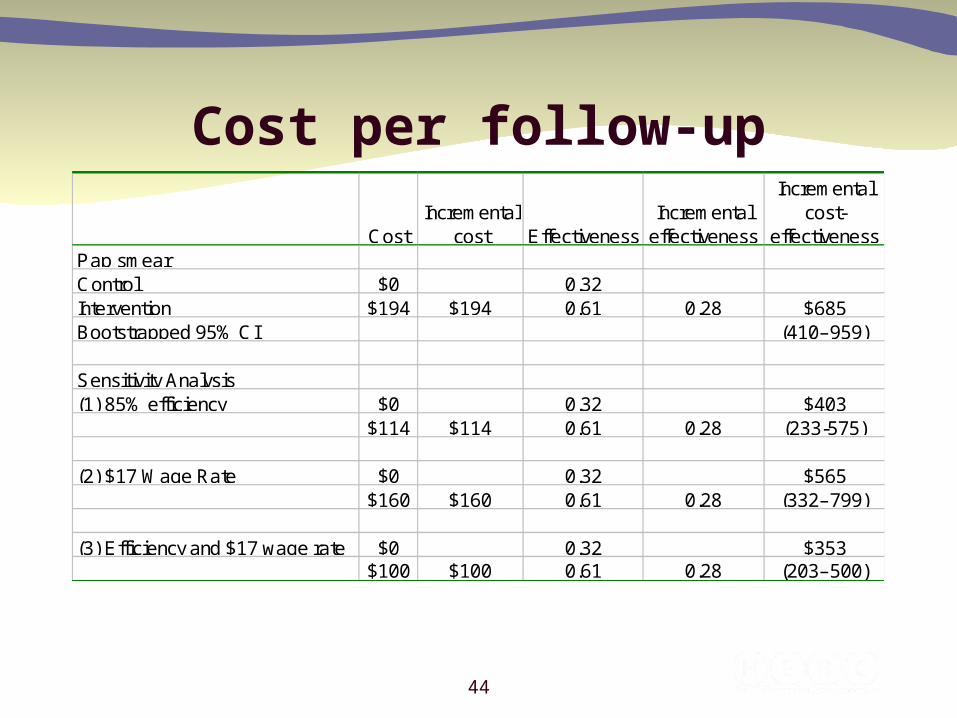
Cost per follow-up
CostIncremental
cost EffectivenessIncremental
effectiveness
Incremental cost-
effectivenessPap smearControl $0 0.32Intervention $194 $194 0.61 0.28 $685 Bootstrapped 95% CI (410–959)
Sensitivity Analysis(1) 85% efficiency $0 0.32 $403
$114 $114 0.61 0.28 (233-575)
(2) $17 Wage Rate $0 0.32 $565 $160 $160 0.61 0.28 (332–799)
(3) Efficiency and $17 wage rate $0 0.32 $353 $100 $100 0.61 0.28 (203–500)

45
Break Even AnalysisBase case
Cost of Intervention $34,507 Number of QALYs needed to save to reach $50,000 per QALY threshold 0.69
85% Indirects and $17 wageCost of Intervention $17,720 Number of QALYs needed to save to reach $50,000 per QALY threshold 0.35
• 8% (n=29) had HGSIL (highest risk)– Intervention: 93% had follow-up – Control: 43% had follow-up

46
Conclusion
• In this population, augmenting usual care with outreach and tailored individual counseling was relatively inexpensive and highly effective.