1 Correlation of Risks, Integrating Risk Measurement – Risk Aggregation The 4 th Annual Enterprise...
28
1 Correlation of Risks, Integrating Risk Measurement – Risk Aggregation The 4 th Annual Enterprise Risk Management Symposium, Chicago By Thomas S.Y. Ho Ph.D. President Thomas Ho Company (THC) www.thomasho.com April 23-25, 2006
-
date post
19-Dec-2015 -
Category
Documents
-
view
214 -
download
1
Transcript of 1 Correlation of Risks, Integrating Risk Measurement – Risk Aggregation The 4 th Annual Enterprise...

1
Correlation of Risks, Integrating Risk Measurement – Risk Aggregation
The 4th Annual Enterprise Risk Management Symposium, Chicago
By
Thomas S.Y. Ho Ph.D.PresidentThomas Ho Company (THC)www.thomasho.comApril 23-25, 2006

2
Statement of the Problem:Need for a New Approach to ERM
What is Enterprise Risk Management? Aggregating balance sheet risk? Aggregating VaR and EaR of the enterprise? Assigning economic capital to business units?
An enterprise is a portfolio of businesses, not just assets and liabilities How do you manage the risk of a portfolio of
businesses? Macro Risk Management

3
Contributions of the Presentation
Describes a very comprehensive approach for aggregating the risks for the enterprise – a new approach known as macro risk management Valuation – new modeling results Simulation – credit and market risks Aggregating business risks
A Case Study: a quantitative risk study by Office of Thrift Supervision (OTS) Highlight: business risk concentration Implications for managing the risks of the
business processes of an enterprise My presentation does not represent the
views of OTS
4
Outline of the Presentation
A Case Study (work in progress): Office of Thrift Supervision Data and reports: institutional framework Valuation models
Interest rate model Mortgage prepayment model Credit risk model
Simulation (“stochastic on stochastic” models) Analysis of simulation results
Implications of Macro Risk Management for ERM Approaches to aggregating business risks
institutional background 5
Office of Thrift Supervision
Federal regulator of over 800 savings institutions or thrifts
Monitors the risks on the balance sheet and the businesses
Role of OTS examiners Ensure safety and soundness of the thrift
industry Similar to the risk management of an
enterprise with multiple businesses

institutional background 6
Net Portfolio Value (NPV) ModelNet Portfolio Value (NPV) Model
A supervisory tool that identifies thrifts with excessive interest rate risk A starting point for assessing the quality of
interest rate risk management practices at individual thrifts
Identify outlier thrifts that need more supervisory attention
Identify systemic interest rate risk trends within the thrift industry
Designed to spot storm clouds on the horizon Fair valuation of all balance sheet items in
disaggregated level using the CMR schedules Determine the market value of equity for each thrift
institutional background 7
Schedule CMR and IRR ReportSchedule CMR and IRR Report
CMR Filing Statistics (June 30, 2005) 821 OTS-regulated thrifts filed Schedule
CMR 58.5% of reports were from voluntary
filers 90.7% of institutions that are not
required to file Schedule CMR do so voluntarily
Interest Rate Risk (IRR) Report Over 15 years of historical data
institutional background 8
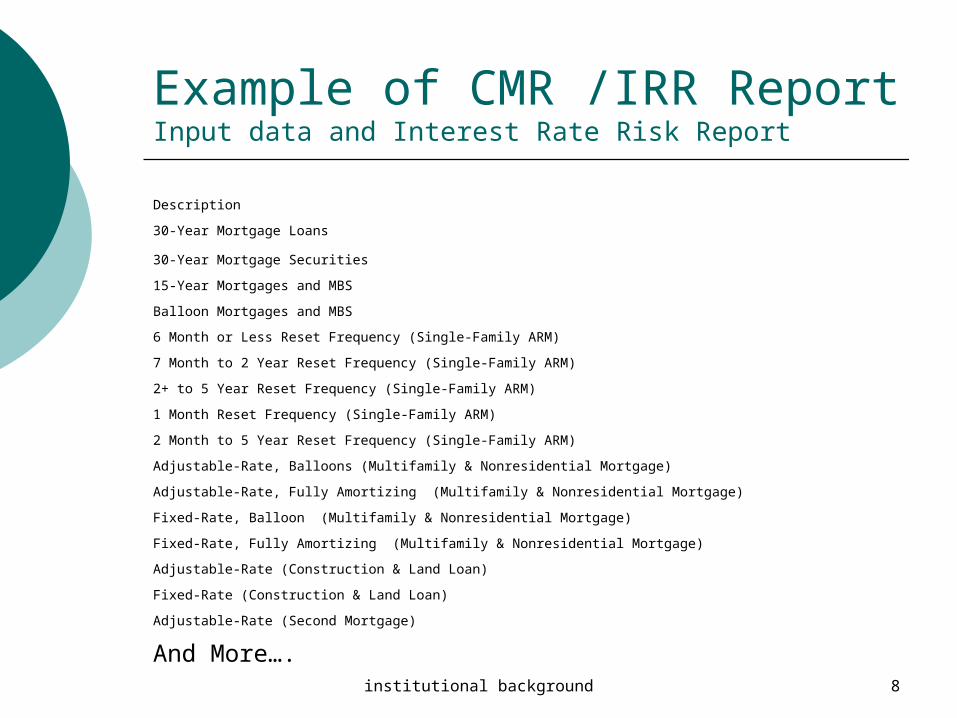
Example of CMR /IRR ReportInput data and Interest Rate Risk Report
Description
30-Year Mortgage Loans
30-Year Mortgage Securities
15-Year Mortgages and MBS
Balloon Mortgages and MBS
6 Month or Less Reset Frequency (Single-Family ARM)
7 Month to 2 Year Reset Frequency (Single-Family ARM)
2+ to 5 Year Reset Frequency (Single-Family ARM)
1 Month Reset Frequency (Single-Family ARM)
2 Month to 5 Year Reset Frequency (Single-Family ARM)
Adjustable-Rate, Balloons (Multifamily & Nonresidential Mortgage)
Adjustable-Rate, Fully Amortizing (Multifamily & Nonresidential Mortgage)
Fixed-Rate, Balloon (Multifamily & Nonresidential Mortgage)
Fixed-Rate, Fully Amortizing (Multifamily & Nonresidential Mortgage)
Adjustable-Rate (Construction & Land Loan)
Fixed-Rate (Construction & Land Loan)
Adjustable-Rate (Second Mortgage)
And More….

valuation model - interest rate model
9
Interest Rate Model
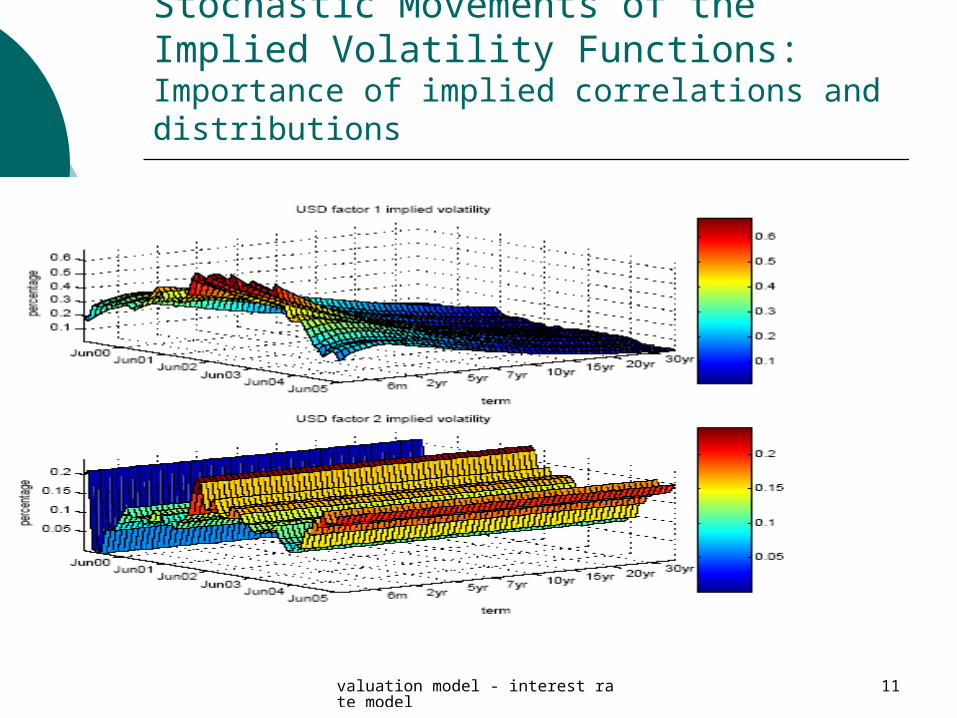
Generalized Ho-Lee model: n factor implied principal yield curve movements Arbitrage-free calibrated to the Treasury curve Implied mixed lognormal/normal model Implied rate correlations
Calibrated to the entire swaption surface Contrast with BGM (LIBOR, Market),
String, Unspanned volatility models.

valuation model - interest rate model
10
Estimated Implied Volatility Function:Principal movements of the yield curve
valuation model - interest rate model
11
Stochastic Movements of the Implied Volatility Functions:Importance of implied correlations and distributions

valuation model - interest rate model
12
Valuation Errors of the Generalized Ho-Lee Model:Accuracy and stability of the model (Ho-Mudavanhu (2006))
valuation model - mortgage 13
Research on Prepayment and Default Claim Model
Multinomial logit model FICO score
Impact on prepayments Impact on the option adjusted spreads
Multiple prepayment models Extension to loan valuation

valuation model - mortgage 14
Multinomial Prepayment/Default Model: Specification of the correlation of prepayment and default risks
CPRi,t = exp ( x(i, t)’ p )/ A and
CDRi,t = exp ( x(i, t)’ d )/ A where A = 1 + exp ( x(i, t)’ p ) +
exp ( x(i, t)’ d ) x(i,t) independent variables: age,
seasonality, refi function, FICO score
valuation model - mortgage 15
Prepayment/Default Model Results:Preliminary results on fixed rate mortgages
Refi and burnout effect The model confirms the S curve behavior of refi. The burnout effect is significant
Slope of the yield curve Higher the slope, greater is prepayment (positive)
Seasoning effects The results confirm the PSA model The results show that the default rate peaks in 5 years
FICO effect For prepayment, the higher the FICO score, the
more likely that the mortgagor prepays In the default model, FICO score is significant
Size: hot and cold money Larger the origination size, hotter is the money Larger the origination size, the higher is the default risk

credit risk modeling 16
Default Risk Modeling: Correlation
Survival rate: derived from historical cumulative default experience for each rating cohort group
Recovery rate: by seniority (historical) Correlation: by industry (historical) Standard deviation: concentration in each
industry Default event: maturity structure

credit risk modeling 17
Default Correlation
Gaussian and t-dependence copula model Input data:
Face value/portfolio Fixed rate mortgages ARMs Loans: construction, consumer, commercial
Proportion in Industry group Maturities Ratings

simulations 18
Scenario Generation:Stochastic simulations of market and credit risks
Quarterly reporting cycles Time horizon: 3 months Antithetic Monte-Carlo simulation Same set of scenarios for all the
thrifts Combined market and credit risks Default distribution and economic
value over the horizon

simulations 19
Set of Risk Drivers:Determination of the correlation matrix
Market Risks Yield curve movements OAS spread risks Equity risks
Prepayment Risks Coefficients of the prepayment model
Credit Risks Sector/industry groups
simulations 20
Simulation Results
Entire thrift population Market Value of Equity: point estimate
and distribution Risk Measures: Macro-Risk Management
Perspective VaR: 90% confidence level, 3 month horizon Capital ratio = economic capital/total asset Critical capital ratio = economic capital at 90%
confidence level/total asset
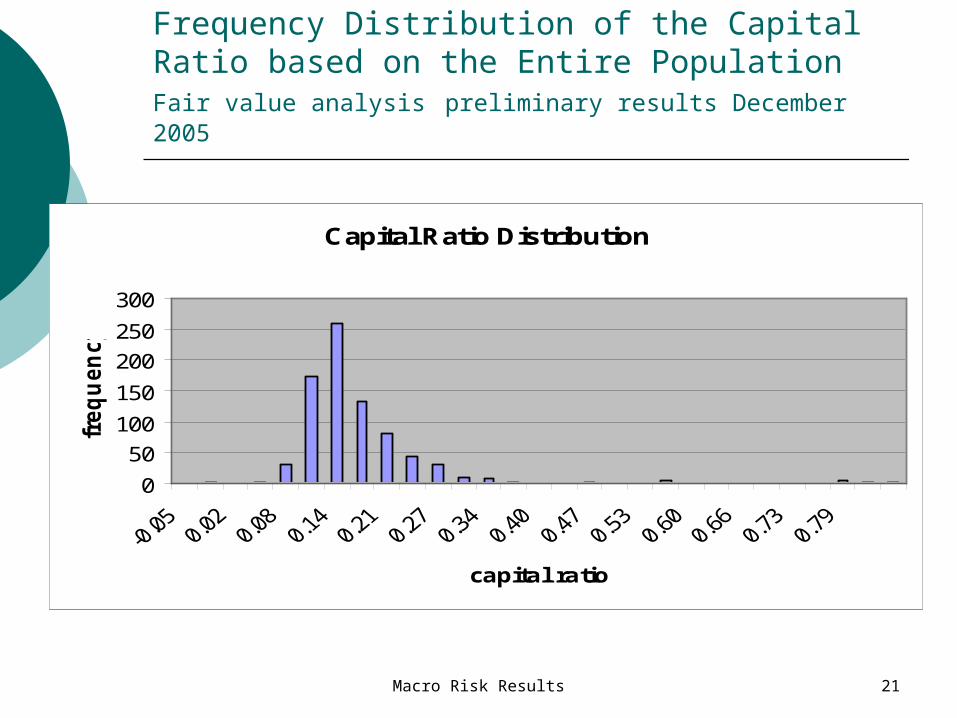
Macro Risk Results 21
Frequency Distribution of the Capital Ratio based on the Entire PopulationFair value analysis preliminary results December 2005
Capital Ratio Distribution
0
50
100
150
200
250
300
capital ratio
freq
uen
cy

22
Impact of VaR at 90% Confidence LevelIdentify the thrifts with lowered capital ratios
Impact of Risk on the Capital Ratios
0102030405060
capital ratio
frequ
ency
capital ratiocritical capital ratio

Macro Risk Results 23
Business Models of Thrifts Principal Components Analysis (preliminary)
PC1 PC2 PC3mortgage/EC 0.75 -0.64 0.13Nonmort/EC 0.02 0.23 0.97Deposits/EC 0.65 0.72 -0.19 proportion of variations explained78% (PC1), 17% (PC2), 5% (PC3) EC =economic capital

Macro Risk Results 24
Relating the Risk Profiles to the Business Models: Variations along PC1 vs Critical Capital preliminary results
mortgage leverage
-8
-6
-4
-2
0
2
4
6
8
10
-0.2 -0.1 0 0.1 0.2 0.3 0.4
critical capital level
levera
ge
Prin1

Implications to ERM 25
Implications of the OTS Case Study
Dramatic change in the thrifts’ business model Traditional, complex, wholesale, specialty
banks Concentration of business risks in the
banking system Correlation of credit risk and market risk Correlation of business risks: home price
collapse, earthquakes, margin calls Implications of macroeconomics
What are the adverse scenarios for the banking system? Price level, rate level, liquidity level. Inter-relations of risks

Implications to ERM 26
Implications of the Case Study for ERM
An enterprise is a portfolio of businesses, defined in terms of business processes, not only as corporate entities
ERM should not only aggregate the balance sheet risks
ERM should consider the correlation of business risks of the business processes

27
Conclusions
Correlations of risk sources in valuation and simulations: new research results
Business risk should be considered a distinct risk driver
Metrics of risks for macro-risk management should be taken into consideration
OTS quantitative risk study highlights many of these issues
28
References
Ho and Lee (2005) “Multifactor interest rate model”
Ho and Lee (2005) The Oxford Guide to Financial Modeling. Oxford University Press
Ho and Jones (2006) “Market structure of OTS banks – a business model perspective”
Ho and Mudavanhu (2006)“Managing stochastic volatilities of interest rate options – key rate vega”
www.thomasho.com;[email protected]