1 Copyright 2000 by The McGraw-Hill Companies, Inc. All rights reserved The US Economic Outlook:...
25
1 Copyright 2000 by The McGraw-Hill Companies, Inc. All rights reserved The US Economic Outlook: The Pause That Refreshes Waterville Valley, New Hampshire September 25, 2000 Cynthia Latta Chief U.S. Economist
-
Upload
gwendolyn-paulina-carson -
Category
Documents
-
view
215 -
download
1
Transcript of 1 Copyright 2000 by The McGraw-Hill Companies, Inc. All rights reserved The US Economic Outlook:...
1
Copyright 2000 by The McGraw-Hill Companies, Inc. All rights reserved
The US Economic Outlook:The Pause That Refreshes
Waterville Valley, New HampshireSeptember 25, 2000
Cynthia LattaChief U.S. Economist

2
Copyright 2000 by The McGraw-Hill Companies, Inc. All rights reserved
The U.S. Economic Expansion Continues to Amaze
It has reached a record length--9 years and counting--with unemployment and inflation near 30-year lows
Technology and entrepreneurs are driving it
Foreign investors have rushed to get in on it
Consumers have overdosed on it
3
Copyright 2000 by The McGraw-Hill Companies, Inc. All rights reserved
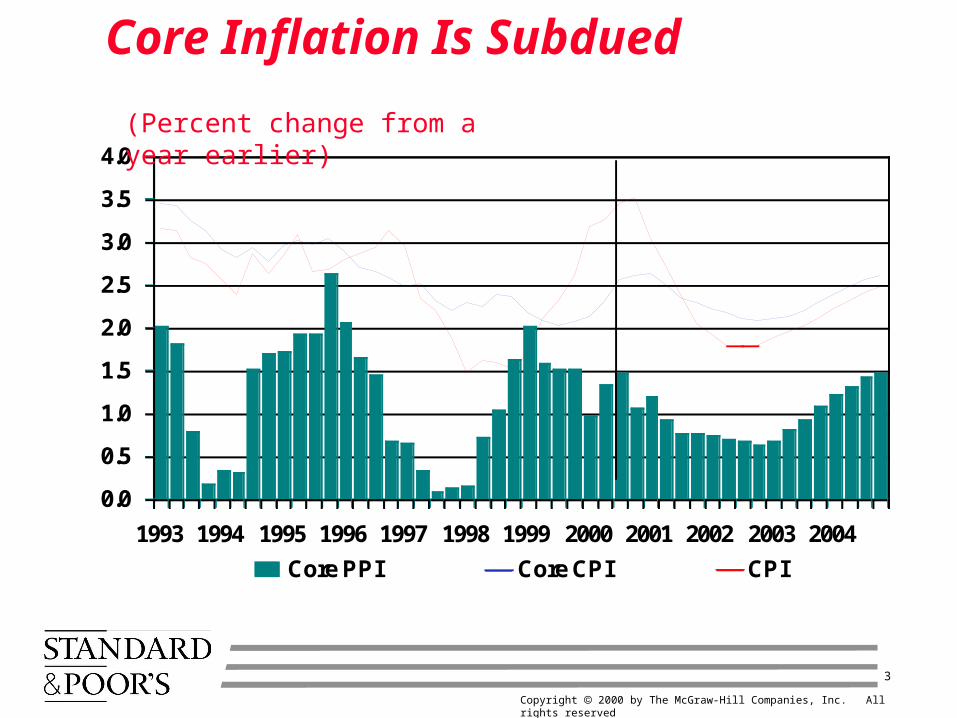
Core Inflation Is Subdued
0.0
0.5
1.0
1.5
2.0
2.5
3.0
3.5
4.0
1993 1994 1995 1996 1997 1998 1999 2000 2001 2002 2003 2004
Core PPI Core CPI CPI
(Percent change from a year earlier)
4
Copyright 2000 by The McGraw-Hill Companies, Inc. All rights reserved
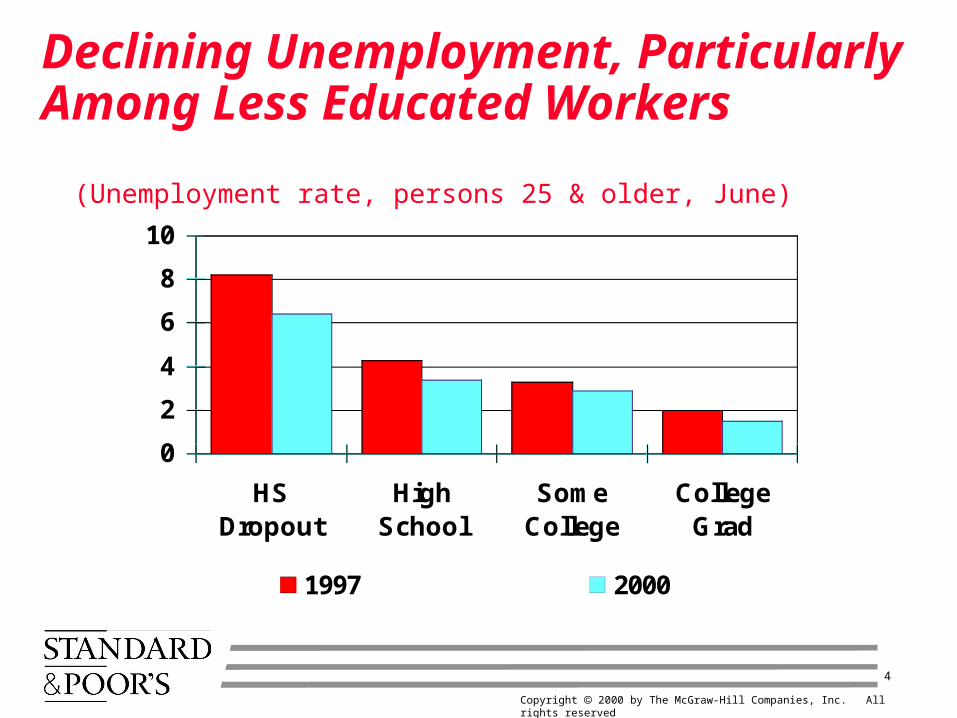
Declining Unemployment, Particularly Among Less Educated Workers
0
2
4
6
8
10
HSDropout
HighSchool
SomeCollege
CollegeGrad
1997 2000
(Unemployment rate, persons 25 & older, June)

5
Copyright 2000 by The McGraw-Hill Companies, Inc. All rights reserved
Workers Have Done Well In This Expansion
22
24
26
28
30
32
34
36
38
40
1960 1965 1970 1975 1980 1985 1990 1995 2000
-4
-3
-2
-1
0
1
2
3
4
5
Percent change (R.) Real dollars, 000 (L)
(Wages and salaries per worker)
6
Copyright 2000 by The McGraw-Hill Companies, Inc. All rights reserved
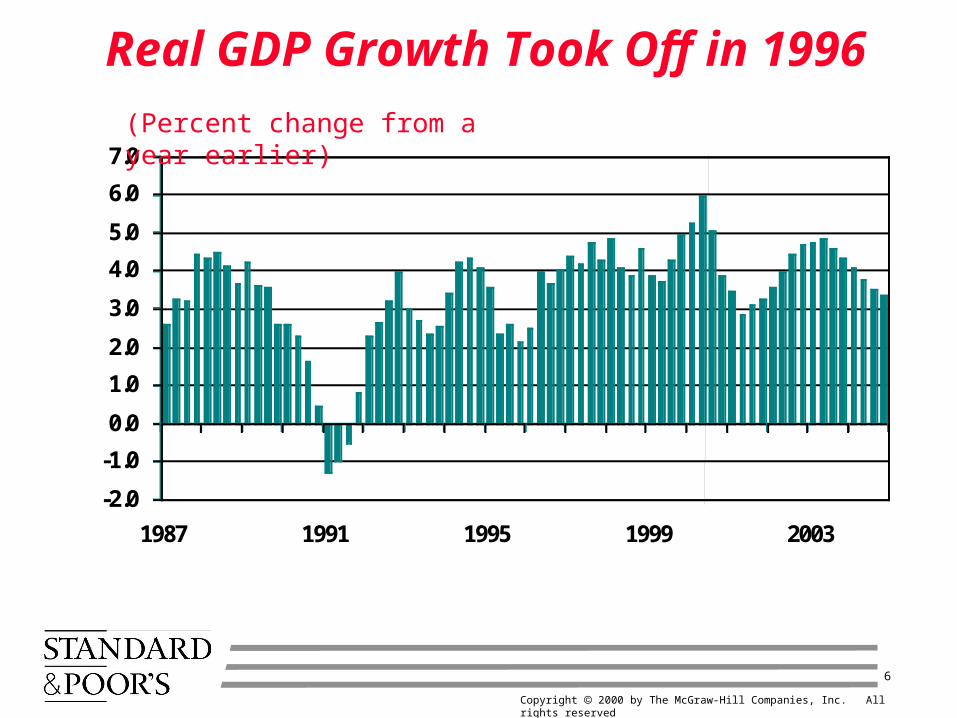
Real GDP Growth Took Off in 1996
-2.0
-1.0
0.0
1.0
2.0
3.0
4.0
5.0
6.0
7.0
1987 1991 1995 1999 2003
(Percent change from a year earlier)
7
Copyright 2000 by The McGraw-Hill Companies, Inc. All rights reserved
The Post-1995 Acceleration in Growth: A Surprise But Not a Miracle
The arrival of Windows 95
The penetration of the internet
The approach of Y2K
The transformation of the federal budget deficit into a surplus
Forbearance by the Federal Reserve

8
Copyright 2000 by The McGraw-Hill Companies, Inc. All rights reserved
Investment Is Rising As A Share Of GDP
0
2
4
6
8
10
12
14
1980 1983 1986 1989 1992 1995 1998 2001 2004
Construction Equipment
(Nominal investment as a share of GDP)
9
Copyright 2000 by The McGraw-Hill Companies, Inc. All rights reserved
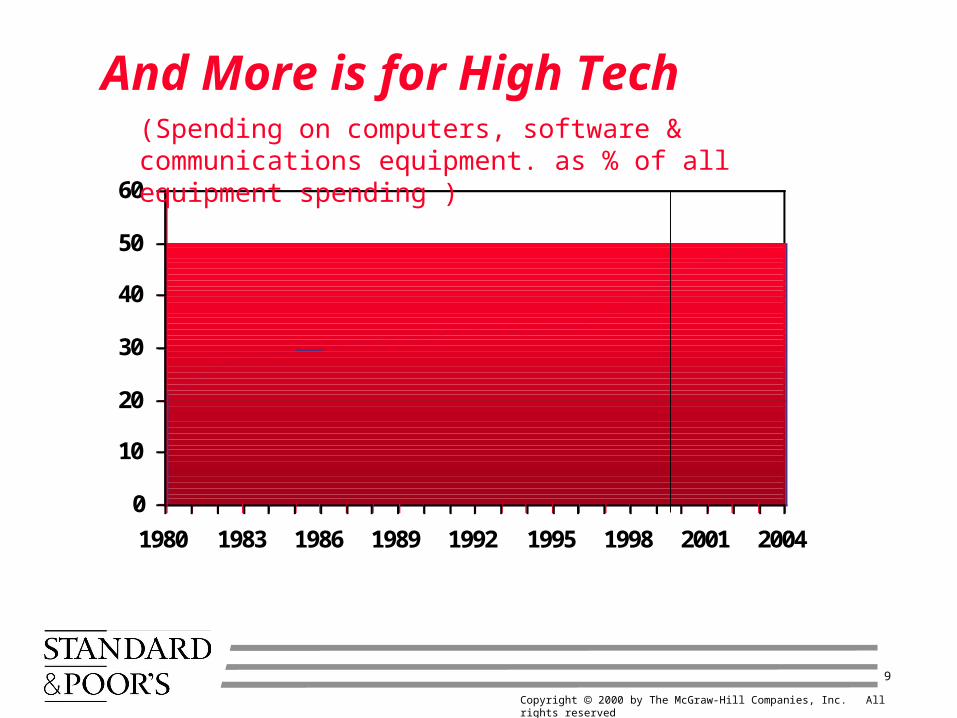
And More is for High Tech
0
10
20
30
40
50
60
1980 1983 1986 1989 1992 1995 1998 2001 2004
(Spending on computers, software & communications equipment. as % of all equipment spending )

10
Copyright 2000 by The McGraw-Hill Companies, Inc. All rights reserved
Productivity Is Accelerating
-3
0
3
6
9
1980 1983 1986 1989 1992 1995 1998 2001 2004
Nonfarm Manufacturing
(Percent change year ago in output/hour)

11
Copyright 2000 by The McGraw-Hill Companies, Inc. All rights reserved
Multi-factor Productivity: Synergy on a Grand Scale
0
1
2
3
1963 1968 1973 1978 1983 1988 1993 1998 2003
Old Model New Model
(Percent change from a year earlier)

12
Copyright 2000 by The McGraw-Hill Companies, Inc. All rights reserved
How to Finance Investment? Don’t Look To Consumers
0
2
4
6
8
10
12
1980 1984 1988 1992 1996 2000 2004
(Household saving as percent of disposable income)

13
Copyright 2000 by The McGraw-Hill Companies, Inc. All rights reserved
The Private Sector Saves Less, The Public Sector Saves More
-0.5
0.0
0.5
1.0
1.5
1990 1992 1994 1996 1998 2000 2002 2004
Private Saving Public Saving
(Share of private investment)

14
Copyright 2000 by The McGraw-Hill Companies, Inc. All rights reserved
U.S. Investment Opportunities Pull in Funds
-0.3
-0.2
-0.1
0.0
0.1
0.2
0.3
1990 1992 1994 1996 1998 2000 2002 2004
U.S. Saving Gap Foreign Contribution
(Share of private investment)

15
Copyright 2000 by The McGraw-Hill Companies, Inc. All rights reserved
The Dollar Has Been in High Demand
0.8
0.9
1.0
1.1
1.2
1.3
1.4
1990 1992 1994 1996 1998 2000 2002 2004
0.3
0.5
0.7
0.9
1.1
1.3
1.5
OECD Countries Developing Countries
(Value of the U.S. dollar, index)

16
Copyright 2000 by The McGraw-Hill Companies, Inc. All rights reserved
If Things Are So Good, Why Did The Fed Tighten?
Tight labor markets make labor costs a concern
The speed limit has risen, but probably not to 5%
No one knows how much pressure the economy can handle
The Fed would rather be safe than sorry

17
Copyright 2000 by The McGraw-Hill Companies, Inc. All rights reserved
Labor Cost Increases Have Been Accelerating
1.0
2.0
3.0
4.0
5.0
6.0
7.0
1990 1992 1994 1996 1998 2000 2002 2004
Wages and Salaries Benefits
(Percent change from a year earlier)
18
Copyright 2000 by The McGraw-Hill Companies, Inc. All rights reserved
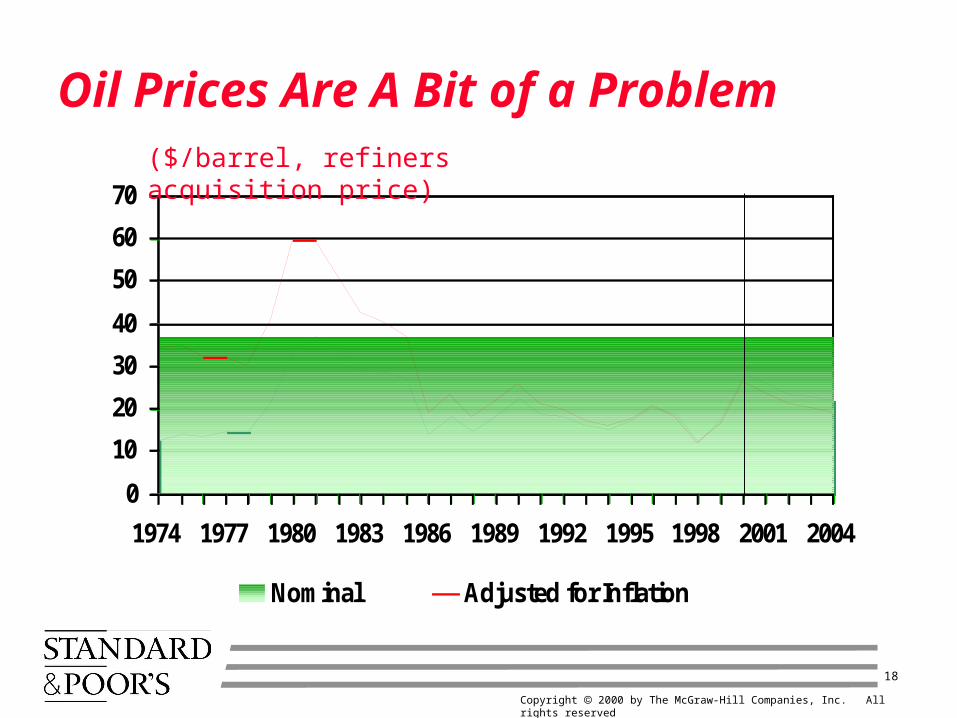
Oil Prices Are A Bit of a Problem
0
10
20
30
40
50
60
70
1974 1977 1980 1983 1986 1989 1992 1995 1998 2001 2004
Nominal Adjusted for Inflation
($/barrel, refiners acquisition price)

19
Copyright 2000 by The McGraw-Hill Companies, Inc. All rights reserved
Higher Energy Prices Are Picking Consumers’ Pockets...
-30
-20
-10
0
10
20
30
40
50
60
1970 1974 1978 1982 1986 1990 1994 1998 2002
(Change in consumer spending on energy, billions of dollars)

20
Copyright 2000 by The McGraw-Hill Companies, Inc. All rights reserved
…But Getting Only Small Change
0
12
3
45
67
8
910
1970 1974 1978 1982 1986 1990 1994 1998 2002
(Consumer spending on energy as percent of total)

21
Copyright 2000 by The McGraw-Hill Companies, Inc. All rights reserved
The U.S. Has Become More Energy Efficient
0
1
2
3
4
5
6
7
1974 1978 1982 1986 1990 1994 1998 2002
(Cost of crude oil and natural gas liquids as percent of GDP)
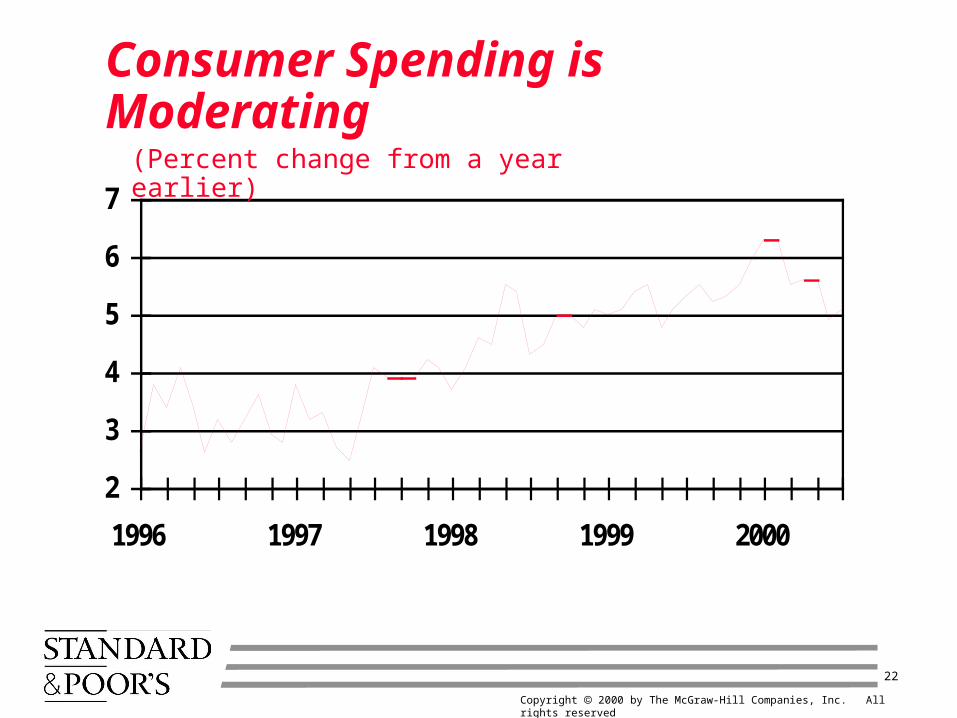
22
Copyright 2000 by The McGraw-Hill Companies, Inc. All rights reserved
2
3
4
5
6
7
1996 1997 1998 1999 2000
(Percent change from a year earlier)
Consumer Spending is Moderating

23
Copyright 2000 by The McGraw-Hill Companies, Inc. All rights reserved
1314
1516
1718
1920
1996 1997 1998 1999 2000
(Millions of units)
Light Vehicle Sales Have Peaked

24
Copyright 2000 by The McGraw-Hill Companies, Inc. All rights reserved
4.5
5.0
5.5
6.0
6.5
7.0
1996 1997 1998 1999 2000
(New plus existing, millions)
Home Sales Have Tapered Off

25
Copyright 2000 by The McGraw-Hill Companies, Inc. All rights reserved
0
10
20
30
40
50
1996 1997 1998 1999 2000
(Percent change from a year earlier, S&P 500)
Even the Stock Market Has Sobered Up