1 Competitiveness in SEE and Prospects in the Catching-Up Process: A Regional Overview Peter...
34
1 Competitiveness in SEE and Prospects in the Catching-Up Process: A Regional Overview Peter Mooslechner Director Economic Analysis and Research Department Oesterreichische Nationalbank National Bank of the Republic of Macedonia Skopje – May 30, 2008
-
Upload
jewel-banks -
Category
Documents
-
view
217 -
download
1
Transcript of 1 Competitiveness in SEE and Prospects in the Catching-Up Process: A Regional Overview Peter...

1
Competitiveness in SEEand Prospects in the Catching-Up Process:
A Regional Overview
Peter Mooslechner
DirectorEconomic Analysis and Research Department
Oesterreichische Nationalbank
National Bank of the Republic of MacedoniaSkopje – May 30, 2008

2
Oesterreichische National bank
Overview
• The Starting Point:Initial income gap ….. but signs of catching-up
• Underlying factors • Elements of price and cost competitiveness• The importance of the regulatory framework
• Factors of SEE competitiveness within Europe:• Trade integration: Sectoral and geographical aspects • Current account balance: Structural issues• SEE: Attractiveness for foreign investors
• Where does the region go to?
…plus some facts on Euroization in SEE
3
Oesterreichische National bank
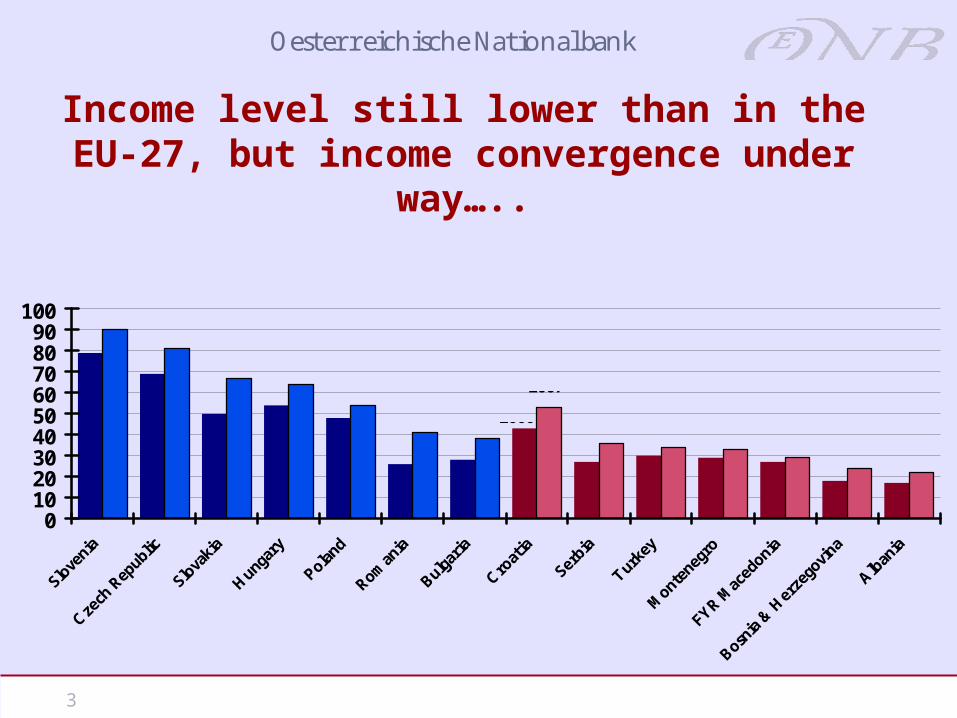
Income level still lower than in the EU-27, but income convergence under way…..
0102030405060708090
100
GDP per capita at PPPin % of EU-27
Source: wiiw.
2000
2007

4
Oesterreichische National bank
….. although it will take some time
GDP per capita in PPP terms: New EU Member States average as % of euro area average
Annual GDP growth in euro area assumed: 2.0%
40.0
50.0
60.0
70.0
80.0
90.0
100.0
20
04
20
08
20
12
20
16
20
20
20
24
20
28
20
32
20
36
20
40
Portugal (1986)
Greece (1981)
6% 5% 4%
Portugal (2004)
Greece (2004)
Source: Eurostat, OeNB.

5
Oesterreichische National bank
Most countries gained shares on world markets
0.0
0.1
0.2
0.3
0.4
0.5
0.6
0.7
0.8
0.9
1.0
Poland Czech R. Hungary Slovakia Romania Slovenia Bulgaria Croatia BiH FYRMacedonia
Albania Serbia(incl.MNE)
Market Share in World Importsin %
Source: IMF.
2000
2007

6
Oesterreichische National bank
Some Basic Factors Driving Competitiveness
7
Oesterreichische National bank
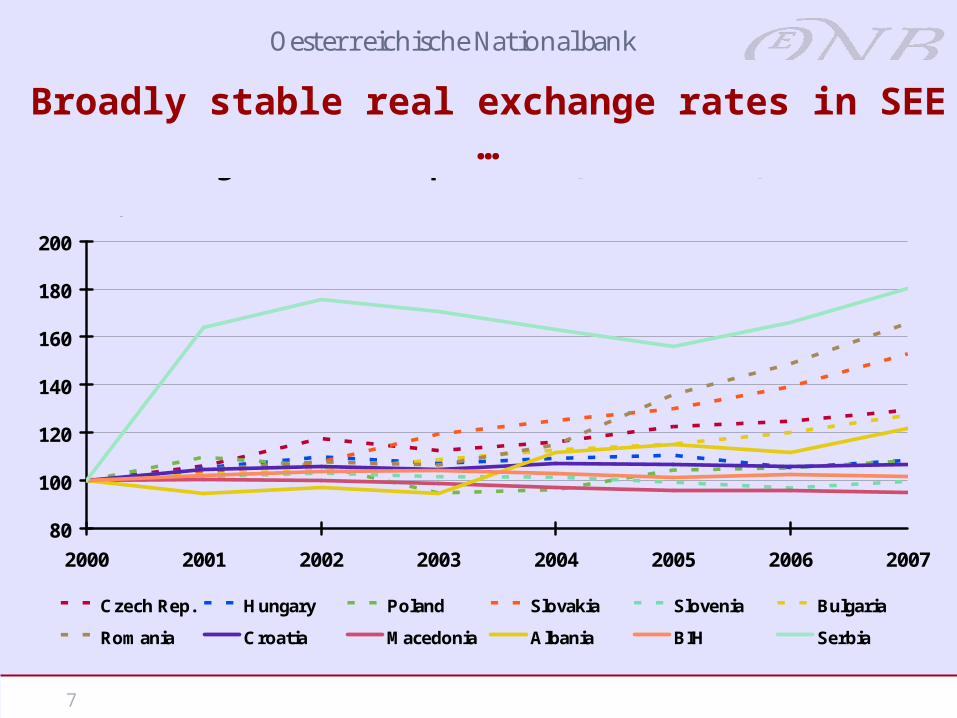
80
100
120
140
160
180
200
2000 2001 2002 2003 2004 2005 2006 2007
Czech Rep. Hungary Poland Slovakia Slovenia Bulgaria
Romania Croatia Macedonia Albania BIH Serbia
Real exchange rates - EUR per NCU (PPI deflated) Index, 2000 = 100
Source: WIIW.
Broadly stable real exchange rates in SEE …
8
Oesterreichische National bank
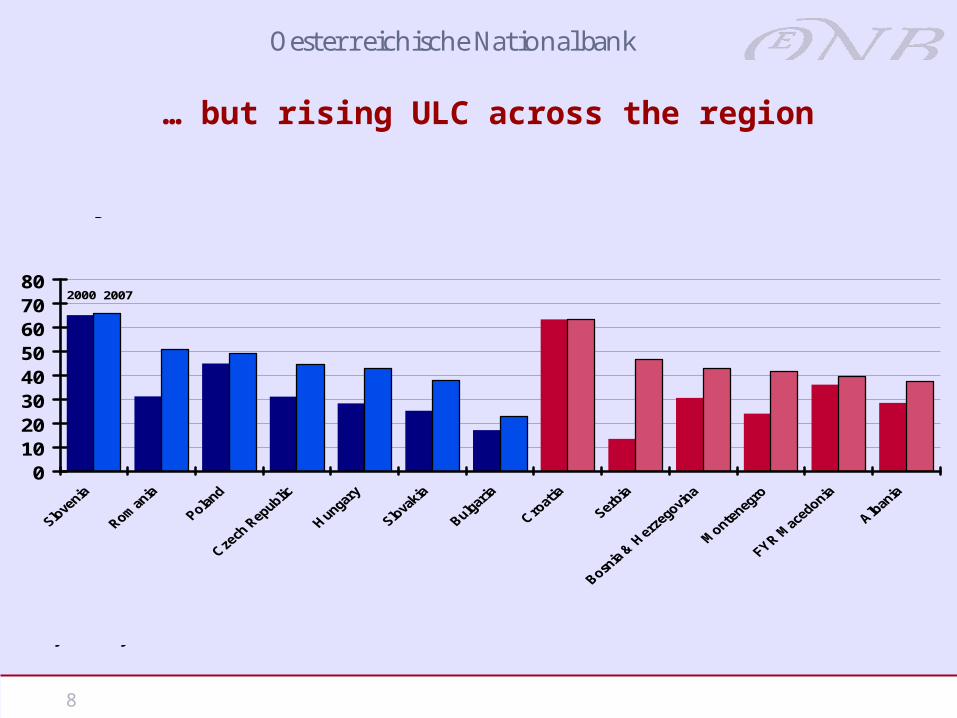
2000 2007
01020304050607080
Unit Labor CostsPPP adjusted, Austria=100
Source: wiiw.
Data for Turkey not available.
… but rising ULC across the region
9
Oesterreichische National bank
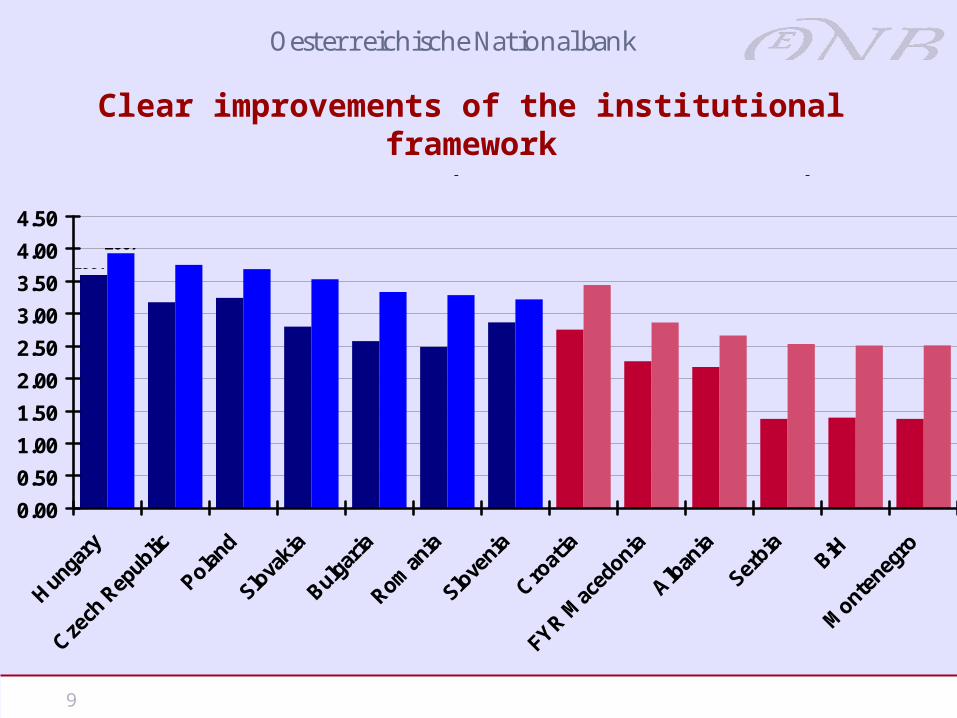
Clear improvements of the institutional framework
0.00
0.50
1.00
1.50
2.00
2.50
3.00
3.50
4.00
4.50
EBRD Transition Indicators (overall transition score)
Source: EBRD.
19972007

10
Oesterreichische National bank
Competitive Advantages of SEE Countries
• Critical issue: „Hard factors“ point more towards a certain loss in price competitiveness
• But „soft factors“ draw a more favourable picture:
• Continuously improving infrastructure supports trade with the EU markets
• Geographical location, closeness to the enlarged EU
• EU accession process
• Progress in regional cooperation and integration
• Attractiveness for FDI
11
Oesterreichische National bank
The Competitive Position of SEE within Europe:
Elements of a Dynamic View

12
Oesterreichische National bank
0102030405060708090
Exports of Goods and Services in % of GDP
Source: wiiw.
2000 2007
Note: Montenegro, FYR Macedonia, BiH, Serbia, Albania data of 2003 instead of 2000. In 2003, Serbia and Montenegro are not considered separately.
Progress in Trade Integration
13
Oesterreichische National bank
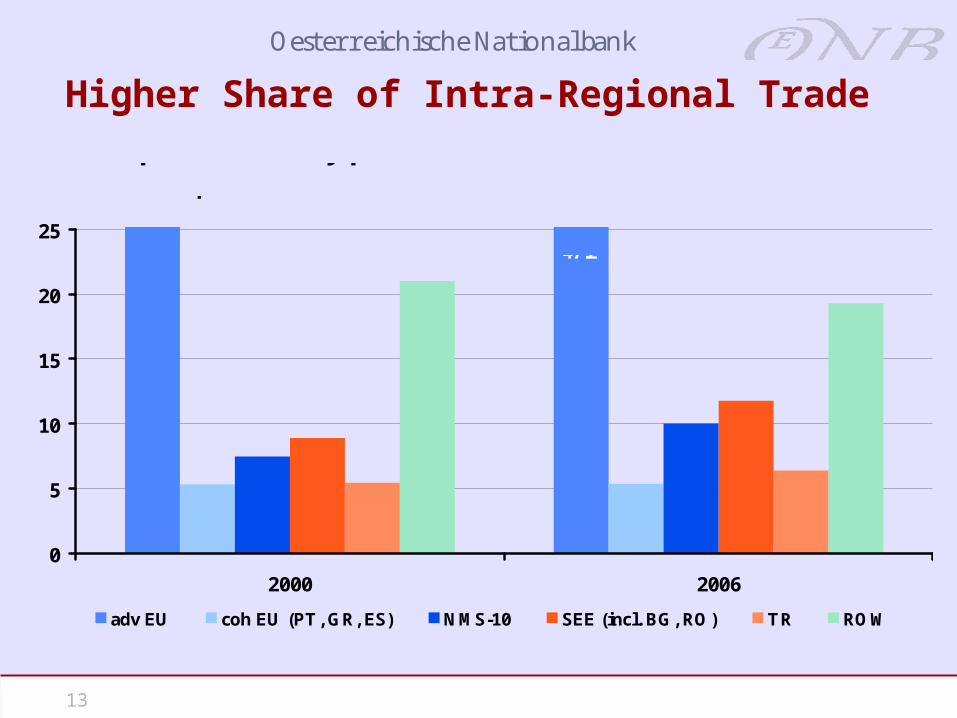
Higher Share of Intra-Regional Trade
0
5
10
15
20
25
2000 2006
adv EU coh EU (PT, GR, ES) NMS-10 SEE (incl. BG, RO) TR ROW
SEE export shares by partnersin % of total exports
Source: UN COMTRADE.
51.9 47.2
14
Oesterreichische National bank
0.0
0.5
1.0
1.5
2.0
2.5
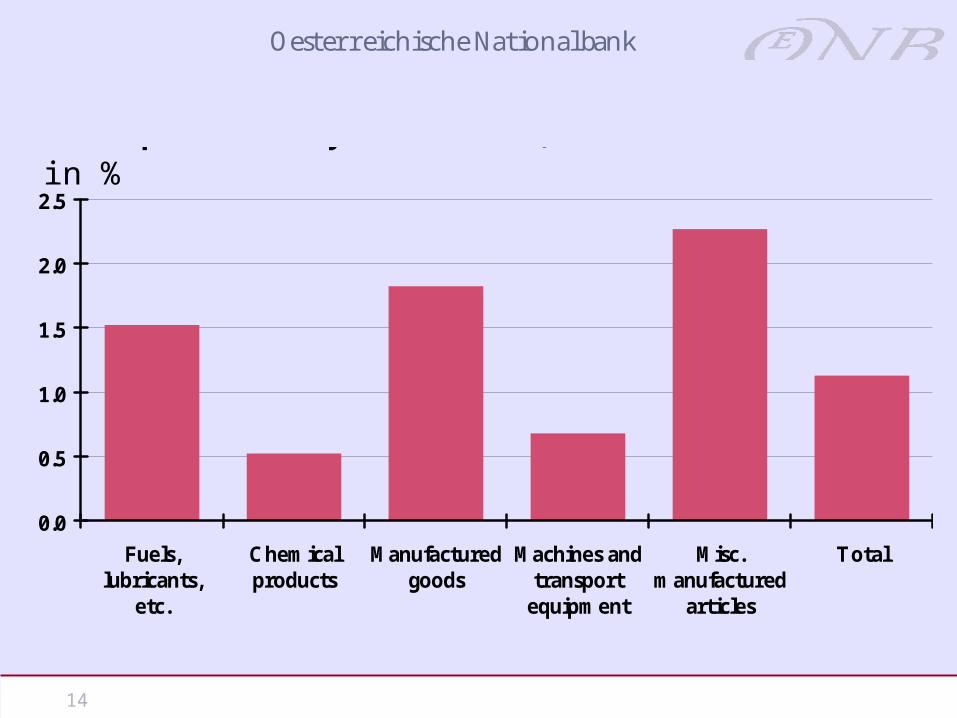
Fuels,lubricants,
etc.
Chemicalproducts
Manufacturedgoods
Machines andtransportequipment
Misc.manufactured
articles
Total
SEE export shares by commodities, 2006
Source: UN COMTRADE.
in %
15
Oesterreichische National bank
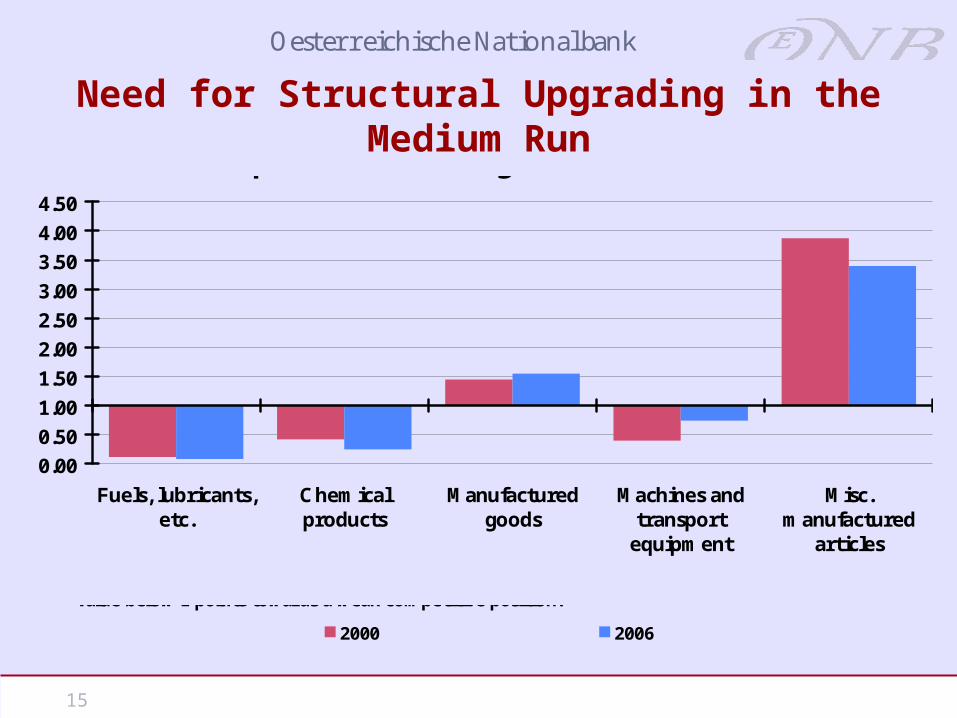
Need for Structural Upgrading in the Medium Run
0.00
0.50
1.00
1.50
2.00
2.50
3.00
3.50
4.00
4.50
Fuels, lubricants,etc.
Chemicalproducts
Manufacturedgoods
Machines andtransportequipment
Misc.manufactured
articles
2000 2006
Revealed Comparative Advantages of SEE on advEU Market
Source: UN COMTRADE, own calculations.
A positive deviation from 1 implies a comparative advantage in the respective commodity group, a value below 1 points towards a weak competitive position.
16
Oesterreichische National bank
0.0
10.0
20.0
30.0
40.0
50.0
60.0
70.0
80.0
90.0
100.0
2000
2001
2002
2003
2004
2005
2006
2007
2000
2001
2002
2003
2004
2005
2006
2007
2000
2001
2002
2003
2004
2005
2006
2007
2000
2001
2002
2003
2004
2005
2006
2007
2000
2001
2002
2003
2004
2005
2006
2007
2000
2001
2002
2003
2004
2005
2006
2007
2000
2001
2002
2003
2004
2005
2006
2007
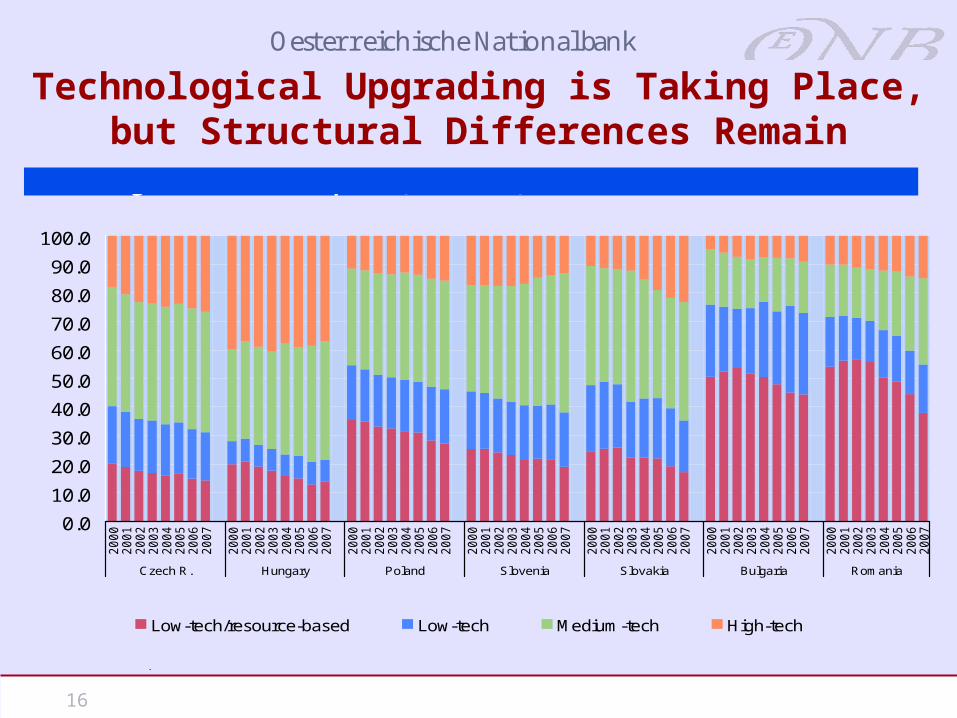
Czech R. Hungary Poland Slovenia Slovakia Bulgaria Romania
Low-tech/resource-based Low-tech Medium-tech High-tech
Technological content of exports (2000-2007)in % of classified exports (covering around 90% of total exports)
Source: Eurostat, OeNB.
Technological Upgrading is Taking Place, but Structural Differences Remain

17
Oesterreichische National bank
The Permanent Challenge of Trade and
Current Account Balances
18
Oesterreichische National bank
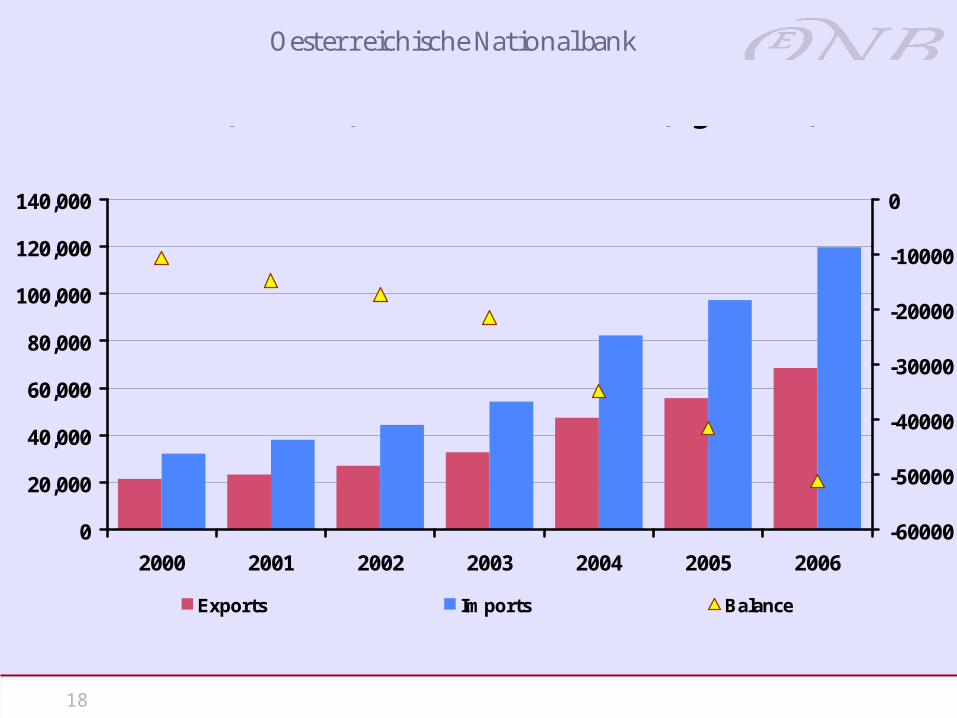
0
20,000
40,000
60,000
80,000
100,000
120,000
140,000
2000 2001 2002 2003 2004 2005 2006
-60000
-50000
-40000
-30000
-20000
-10000
0
Exports Imports Balance
Trade Flows (left axis) and Trade Balance (right axis) of SEEin Mio USD
Source: UN COMTRADE.
19
Oesterreichische National bank
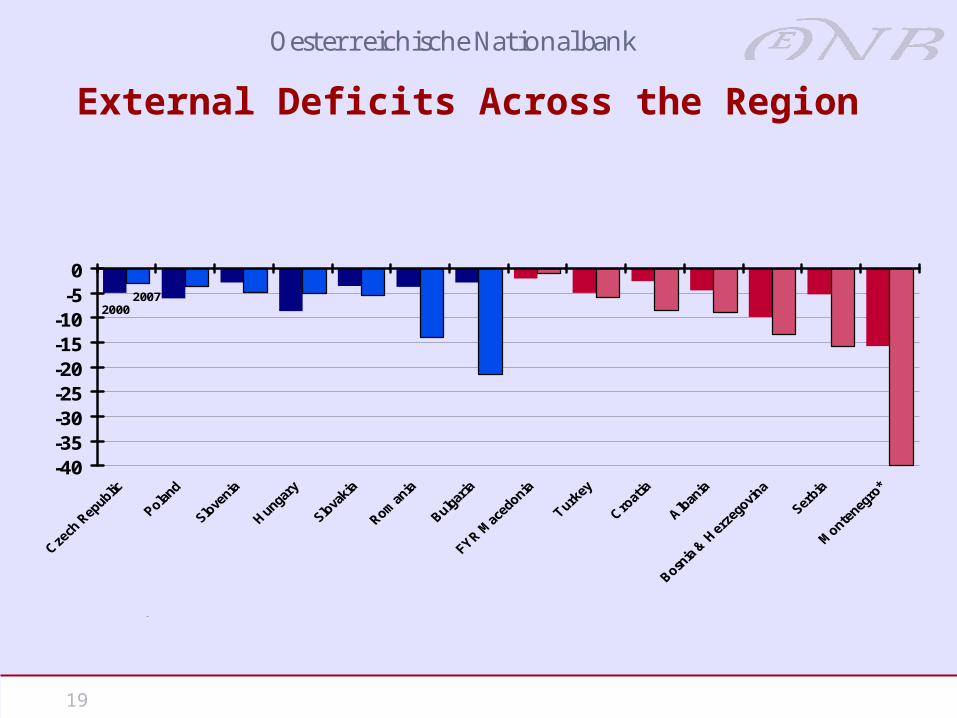
20002007
-40-35-30-25-20-15-10-50
Current Account Balancein % of GDP
Source: Eurostat, wiiw.
* 2001
External Deficits Across the Region
20
Oesterreichische National bank
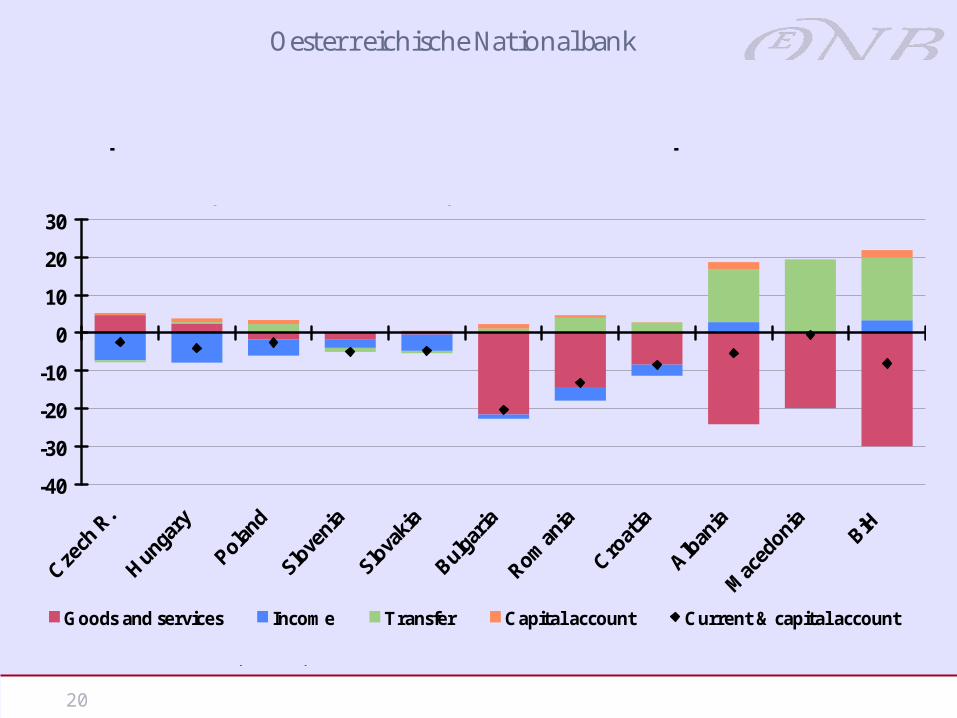
-40
-30
-20
-10
0
10
20
30
Goods and services Income Transfer Capital account Current & capital account
Composition of the combined current and capital account
% of GDP, 2007 (AL, MK and BIH 2006)
Source: National central banks, Eurostat, OeNB.

21
Oesterreichische National bank
-500500
1500250035004500550065007500
FDI Stock per Capitain EUR
Source: wiiw.
2003 2007
High and increasing FDI stock
22
Oesterreichische National bank
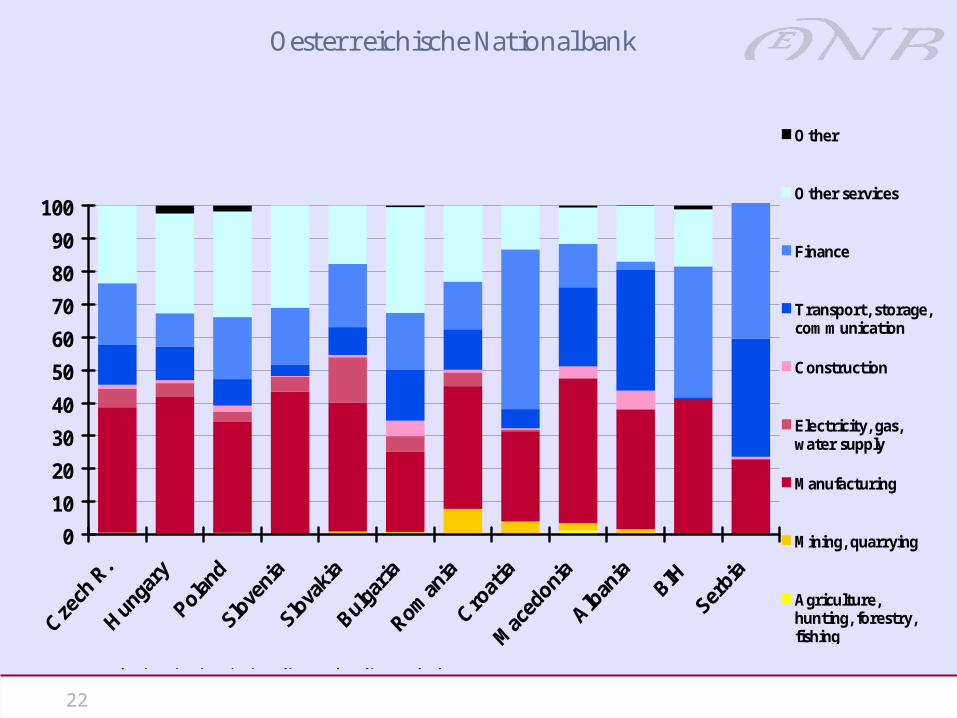
0
10
20
30
40
50
60
70
80
90
100
Other
Other services
Finance
Transport, storage,communication
Construction
Electricity, gas,water supply
Manufacturing
Mining, quarrying
Agriculture,hunting, forestry,fishing
Sectoral structure of inward FDI stock, latest available data
in % of total inward FDI stock
Note: 2006 (CZ, HU, PL, RO, SI, MK), 2005 (BIH), 2004 (AL)

23
Oesterreichische National bank
Where does the region go to?
• SEE still with significant cost/price advantage compared to the European Union
• EU is main trading partner - but low share in total EU imports points to considerable growth potential
• Trade with the CEE-5 region as well as interregional trade is rising (and these regions show stronger growth than the rest of the EU)
• Specialisation of production on low-tech and basic goods sector faces strong competition from Asian countries (in particular China)
• Obvious need for technological upgrading to gain in long-term competitiveness

24
Oesterreichische National bank
Euroization as a particularFeature of SEE?

25
Oesterreichische National bank
Why Euroization in SEE Countries?
• Competitiveness is not only a question of wages, prices and productivity – it is also a question of the exchange rate
• Under certain (specific) conditions: Expectations are stabilized by fixed exchange-rate policies
• Historical experience: Austria’s “hard currency policy” – a particular example of pegging a country’s currency
• Today: ERM II and Monetary Union
• For most SEE countries the introduction of the Euro is still a long way to go
• People and policy makers might chose different ways to go
• Euroization is a peculiarity of this region
26
Oesterreichische National bank
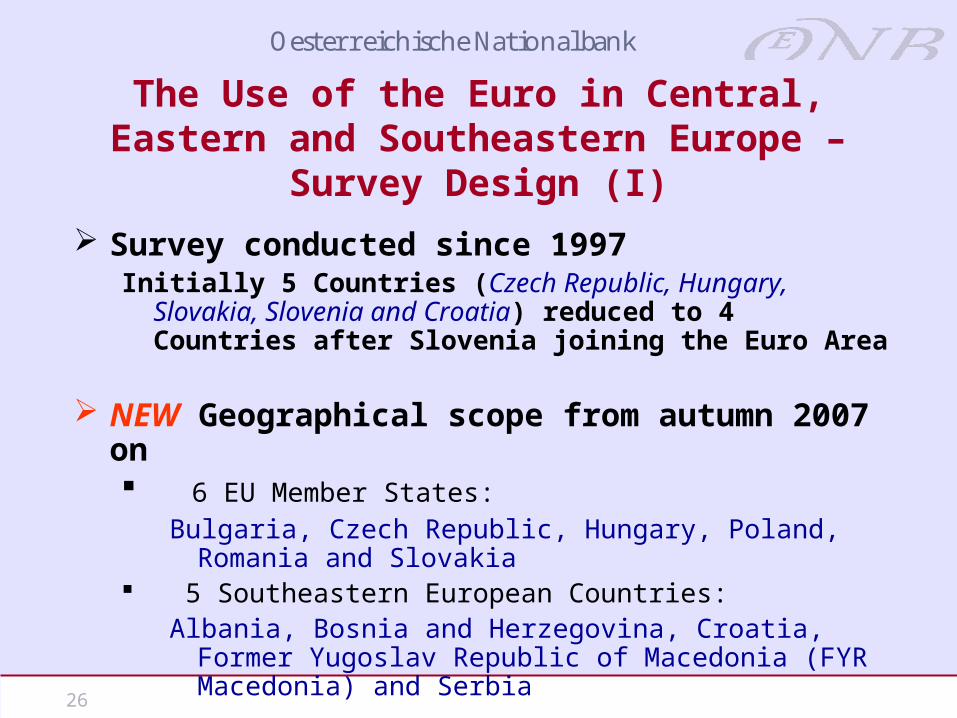
Survey conducted since 1997Initially 5 Countries (Czech Republic, Hungary, Slovakia,
Slovenia and Croatia) reduced to 4 Countries after Slovenia joining the Euro Area
NEW Geographical scope from autumn 2007 on 6 EU Member States:
Bulgaria, Czech Republic, Hungary, Poland, Romania and Slovakia
5 Southeastern European Countries: Albania, Bosnia and Herzegovina, Croatia, Former Yugoslav
Republic of Macedonia (FYR Macedonia) and Serbia
The Use of the Euro in Central, Eastern and Southeastern Europe – Survey Design (I)

27
Oesterreichische National bank
The Use of the Euro in Central, Eastern and Southeastern Europe – Survey Design (II)
In each country about 1000 persons over the age of 14 are interviewed (in Poland only the population of the 10 largest cities); 2 waves per year (spring and autumn)
Overall 26 questions plus socio-demographics, including also nonregular questions on specific topics (for example on foreign currency loans)
Central questions:■ amounts and composition of foreign currency cash holdings■ foreign currency denominated deposits■ as well as motives for holding them

28
Oesterreichische National bank
0
10
20
30
40
50
60
Hungary Poland Slovakia CzechRepublic
Bulgaria Romania Bosnia-Herzegovina
Croatia Albania Serbia FYRMacedonia
EURUSDGBPOTHER
Share of respondents holding foreign cash
in % of respondents (multiple answers possible)
Quelle: Source: OeNB Euro Survey 2007.
Note: GBP only asked in Poland.
29
Oesterreichische National bank
-2.0 -1.5 -1.0 -0.5 0.0 0.5 1.0 1.5 2.0
Serbia
Croatia
Bosnia-Herzegovina
FYR Macedonia
Romania
Albania
Bulgaria
Slovakia
Poland
Czech Republic
Hungary
as a general reserve to make payments in my country to make payments abroad, for holidays
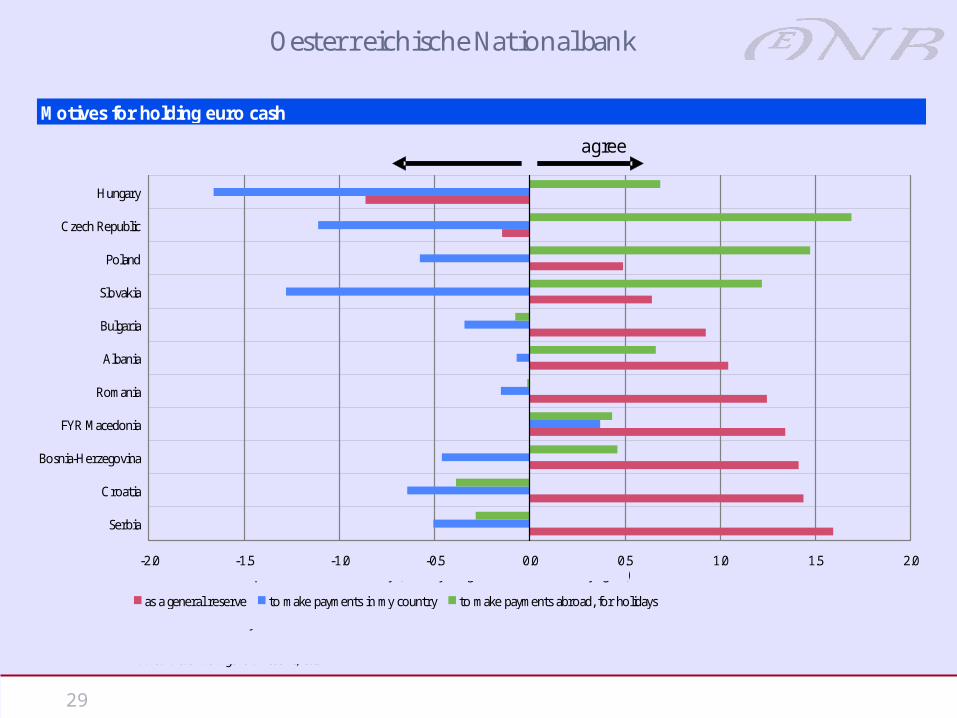
Motives for holding euro cash
normalized sample means for each country (-3.5 fully disagree, 0 neutral, +3.5 fully agree)
Source: OeNB Euro Survey 2007.
Note: Respondents who held euro cash were asked whether they agree or disagree on a scale from 1 (fully agree) to 6 (fully disagree) to the statement that they hold euro cash as a general reserve, etc.
agreedisagree
30
Oesterreichische National bank
0
10
20
30
40
50
60
70
80
90
Hungary Poland Slovakia CzechRepublic
Romania FYRMacedonia
Bulgaria Albania Serbia Bosnia-Herzegovina
Croatia
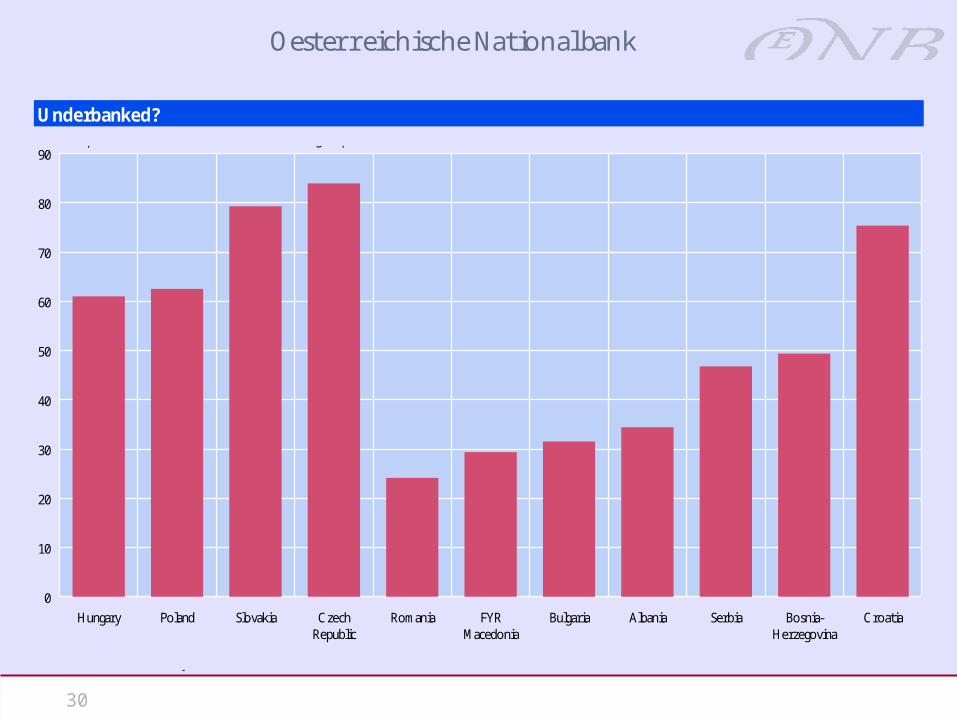
Underbanked? % of respondents with a transaction account or savings deposit
Source: OeNB Euro Survey 2007.
31
Oesterreichische National bank
0
10
20
30
40
50
60
Hungary Poland Slovakia CzechRepublic
Bulgaria Romania Croatia Albania FYRMacedonia
Serbia Bosnia-Herzegovina
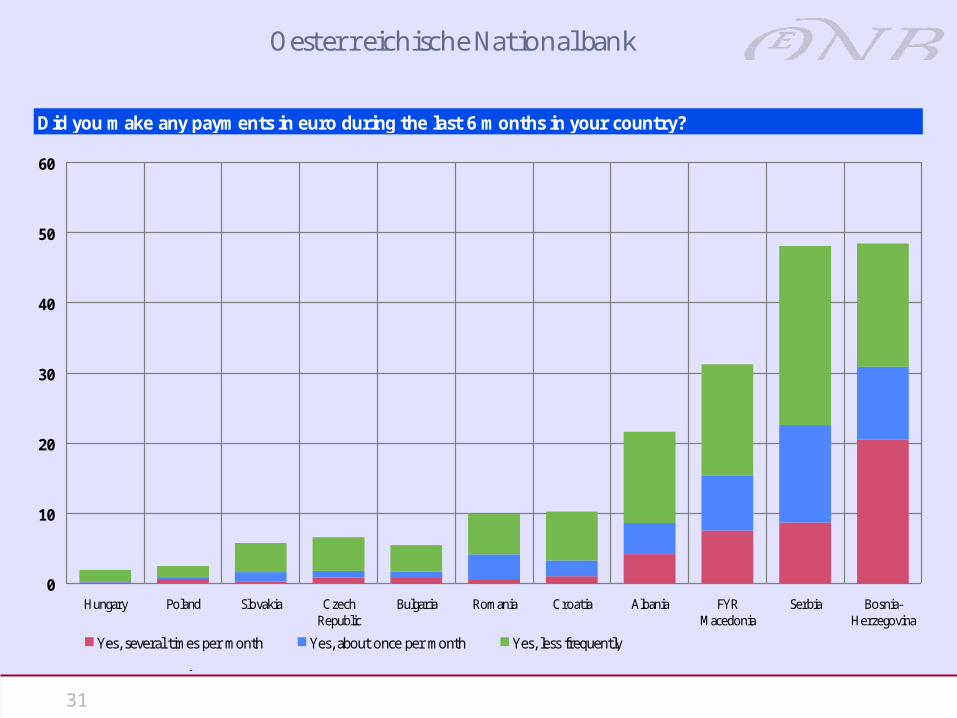
Yes, several times per month Yes, about once per month Yes, less frequently
Did you make any payments in euro during the last 6 months in your country?in % of respondents
Source: OeNB Euro Survey 2007.

32
Oesterreichische National bank
Summary of First Survey Results
• The euro plays a predominant role in foreign currency denominated assets held by residents throughout the region.
• In general, euro cash holdings are more important in Southeastern European Countries than in EU Member States.
• Key motives to hold euro cash: – Southeastern Europe, BU and RO as a store of value, – other EU Member States for holidays and shopping
purposes abroad.

33
Oesterreichische National bank
■ Focus on European Economic IntegrationMain results will be provided in an article on a regularly basis (semi-annual); first one in FEEI 1/2008 (July)
■ Research and information platform on the internet (July 2008) Details on the Survey, sample, technical report, questionnaire Selected results and complete list of publications www.oenb.at, ceec.oenb.at
■ The International Role of the EuroBox prepared for the European Central Bank’s report
■ Occasional newsletter on special topics
■ Ongoing research activities■ Stix, H. 2008. Euroization: What Factors Drive its Persistence?
Household Data Evidence for Croatia, Slovenia and Slovakia. OeNB Working Paper No. 140.
■ Presentation of papers by Doris Ritzberger-Gruenwald and Helmut Stix at the Annual Meeting of the Austrian Economic Association 2008
Where to find more information…..

34
Oesterreichische National bank
Thank you very Thank you very much for your much for your
Attention!Attention!