1 Clustering NTSB Accidents Data Lishuai Li, Rafael Palacios, R. John Hansman JUP Quarterly Meeting...
18
1 Clustering NTSB Accidents Data Lishuai Li, Rafael Palacios, R. John Hansman JUP Quarterly Meeting Jan. 2010
-
date post
20-Dec-2015 -
Category
Documents
-
view
218 -
download
0
Transcript of 1 Clustering NTSB Accidents Data Lishuai Li, Rafael Palacios, R. John Hansman JUP Quarterly Meeting...

1
Clustering NTSB Accidents Data
Lishuai Li, Rafael Palacios,
R. John Hansman
JUP Quarterly Meeting
Jan. 2010

2
Introduction
Aviation safety has been improved significantly over the past 50 years.
It is difficult to improve safety by making up for problems occurred in individual accident for the current systems.
Each accident is often induced by various anomalies. To identify patterns, correlations, and trends in large amounts of aviation accidents data can help us to understand problems and to prevent future incidents.
Boeing, Statistical Summary of Commercial Jet Airplane Accidents, July 2009
1989
1991
1993
1995
1997
1999
2001
2003
2005
2007
0
20
40
60
80
100
120
140
Accident Rates for Civil Aviation (1989-2008)
Commercial Airlines
General Aviation
Year
Ac
cid
en
ts p
er
Mil
lio
n F
lig
ht
Ho
urs
Data Source: National Transportation Safety Board

3
Methodology
Research Method:
• Use data-mining techniques to identify patterns in accidents data• Identify accidents with similar characteristics• Incorporate findings with narratives to find causalities
Data:
• Subset of NTSB accident database system (ADMS2000) Event Type: Accident only, excluding incident FAR Part: Part 91 (General Aviation); Part 121 (Air Carriers) Aircraft Type: Airplanes only Year: from 2000 to 2005
• Other database will be considered in future work
Data-mining tools:
• Clustering (e.g. k-means): use a distance function to search for partitioning of records such that the intra-cluster distance is minimal and the inter-cluster distance is maximum
• Other data-mining techniques will be considered and used in future study

4
Clustering Method
K-means clustering is a partitioning method.
Data can be partitioned into k mutually exclusive clusters.
K-means clustering finds a partition in which objects within each cluster are as close to each other as possible, and as far from objects in other clusters as possible.
Each data point represents an accident. The attributes of that accident determine where the data point is. K-means clustering can be used to find accidents with similar attributes.
-4 -3 -2 -1 0 1 2 3 4-5
-4
-3
-2
-1
0
1
2
3
4
Cluster 1Cluster 2Centroids
-4 -3 -2 -1 0 1 2 3 4-5
-4
-3
-2
-1
0
1
2
3
4

5
Preliminary Results of Clustering NTSB Accidents Data
For this preliminary study, we want to test if k-means clustering can be used to identify accidents with similar attributes specified.
Apply k-means clustering method to the subset of NTSB data (Part 91 & Part 121 Accidents from 2000 to 2005)
Accidents attributes used in clustering:
• Flight Plan Type, Injury Level, Visibility, Phase of Flight• Location, Day of The Year

6
Phase of Flight & Visibility Characteristics for Part 91 Accidents
(2000-2005)
General characteristics of accidents regarding individual variable are commonly known
• Accidents are more likely to happen in very low visibility conditions• High rate of accidents during taking-offs and landings
All events with visibility >10 are put into the same grouped as the ones with visibility =0
0 1000 2000 3000 4000 5000 6000
1
2
3
4
5
6
7
8
9
10
11
Sta
tute
Mile
s
No. of Events
Visibility
0 500 1000 1500 2000 2500
Standing/Taxi/Other
Takeoff
Climb
Cruise
Descent
Maneuver/Hover
Approach
Go-Around
Landing
No. of Events
Phase of Flight

7
Phase of Flight & Visibility Characteristics by Flight Plan Type
0 972 1944 2916 3888 4860
0
1
2
3
4
5
6
7
8
9
10
Sta
tute
Mile
s
VFR/OtherIFR
0 64 128 192 256 320Visibility
0 389 778 1167 1556 1945
Standing/Taxi/Other
Takeoff
Climb
Cruise
Descent
Maneuver/Hover
Approach
Go-Around
Landing
VFR/OtherIFR
0 33 66 99 132 165Phase of Flight
Phase of Flight Distribution of Part 91 Accidents (2000-2005)
VFR vs. IFR
Visibility Distribution of Part 91 Accidents (2000-2005)
VFR vs. IFR

8
Phase of Flight & Visibility Characteristics by Injury Level
0 824 1648 2472 3296 4120
0
1
2
3
4
5
6
7
8
9
10
Sta
tute
Mile
s
Non-FatalFatal
0 212 424 636 848 1060Visibility
0 405 810 1215 1620 2025
Standing/Taxi/Other
Takeoff
Climb
Cruise
Descent
Maneuver/Hover
Approach
Go-Around
Landing
Non-FatalFatal
0 80 160 240 320 400Phase of Flight
Phase of Flight Distribution of Part 91 Accidents (2000-2005)
Non-Fatal vs. Fatal
Visibility Distribution of Part 91 Accidents (2000-2005)
Non-Fatal vs. Fatal
9
VFR/other IFR
Non-Fatal
Fatal
1
2
3
4
5
6
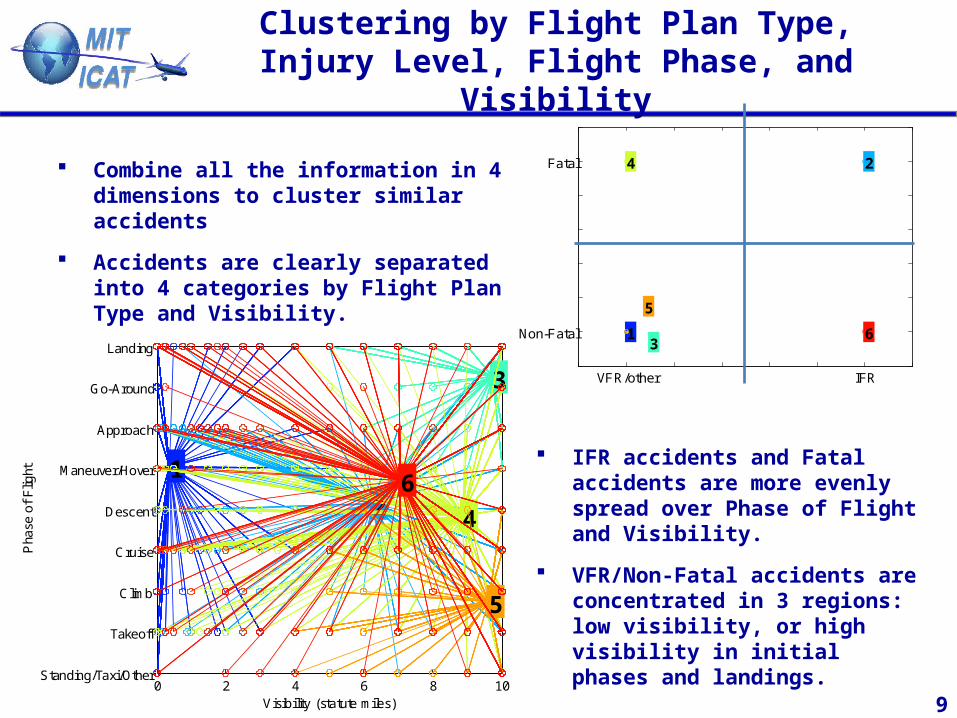
Clustering by Flight Plan Type, Injury Level, Flight Phase, and Visibility
Combine all the information in 4 dimensions to cluster similar accidents
Accidents are clearly separated into 4 categories by Flight Plan Type and Visibility.
IFR accidents and Fatal accidents are more evenly spread over Phase of Flight and Visibility.
VFR/Non-Fatal accidents are concentrated in 3 regions: low visibility, or high visibility in initial phases and landings.
0 2 4 6 8 10Standing/Taxi/Other
Takeoff
Climb
Cruise
Descent
Maneuver/Hover
Approach
Go-Around
Landing
1
2
3
4
5
6
Visibility (statute miles)
Pha
se o
f F
light

10
Accidents Characteristics by Clusters
0 2 4 6 8 101
2
3
4
5
6
7
8
9
1
3
5
Visibility (statute miles)
Ph
ase
of
Flig
ht
Non-Fatal, VFR/Other
0 2 4 6 8 101
2
3
4
5
6
7
8
9
2
Visibility (statute miles)
Ph
ase
of
Flig
ht
Fatal, IFR
0 2 4 6 8 101
2
3
4
5
6
7
8
9
4
Visibility (statute miles)
Ph
ase
of
Flig
ht
Fatal, VFR/Other
0 2 4 6 8 101
2
3
4
5
6
7
8
9
6
Visibility (statute miles)
Ph
ase
of
Flig
ht
Non-Fatal, IFR
FatalVFR/Other
Non-FatalVFR/Other
Non-FatalIFR
FatalIFR
Phase of FlightVisibility
Phase of FlightVisibility Phase of FlightVisibility
Phase of FlightVisibility
0 50 100 150 200 250 300 350 400
Standing/Taxi/Other
Takeoff
Climb
Cruise
Descent
Maneuver/Hover
Approach
Go-Around
Landing
No. of Events
Cluster 4
0 200 400 600 800 1000
0
1
2
3
4
5
6
7
8
9
10
No. of Events
Vis
ibili
ty (
Sta
tute
Mile
s)
Cluster 4
0 20 40 60 80 100 120
0
1
2
3
4
5
6
7
8
9
10
No. of Events
Vis
ibili
ty (
Sta
tute
Mile
s)
Cluster 2
0 50 100 150 200 250
0
1
2
3
4
5
6
7
8
9
10
No. of Events
Vis
ibili
ty (
Sta
tute
Mile
s)
Cluster 6
0 20 40 60 80 100 120
Standing/Taxi/Other
Takeoff
Climb
Cruise
Descent
Maneuver/Hover
Approach
Go-Around
Landing
No. of Events
Cluster 2
0 20 40 60 80 100 120 140
Standing/Taxi/Other
Takeoff
Climb
Cruise
Descent
Maneuver/Hover
Approach
Go-Around
Landing
No. of Events
Cluster 6
0 500 1000 1500 2000
Standing/Taxi/Other
Takeoff
Climb
Cruise
Descent
Maneuver/Hover
Approach
Go-Around
Landing
No. of Events
Cluster 1Cluster 3Cluster 5
0 500 1000 1500 2000 2500 3000 3500 4000
0
1
2
3
4
5
6
7
8
9
10
No. of Events
Vis
ibili
ty (
Sta
tute
Mile
s)
Cluster 1Cluster 3Cluster 5

11
Locations and Day of The Year of Part 91 Accidents (2000-2005)
Total number of accidents included: 6819
Jan Feb Mar Apr May Jun Jul Aug Sep Oct Nov Dec 0
100
200
300
400
500
600
700
800
900
No.
of
Eve
nts
Location Distribution Time Distribution
12
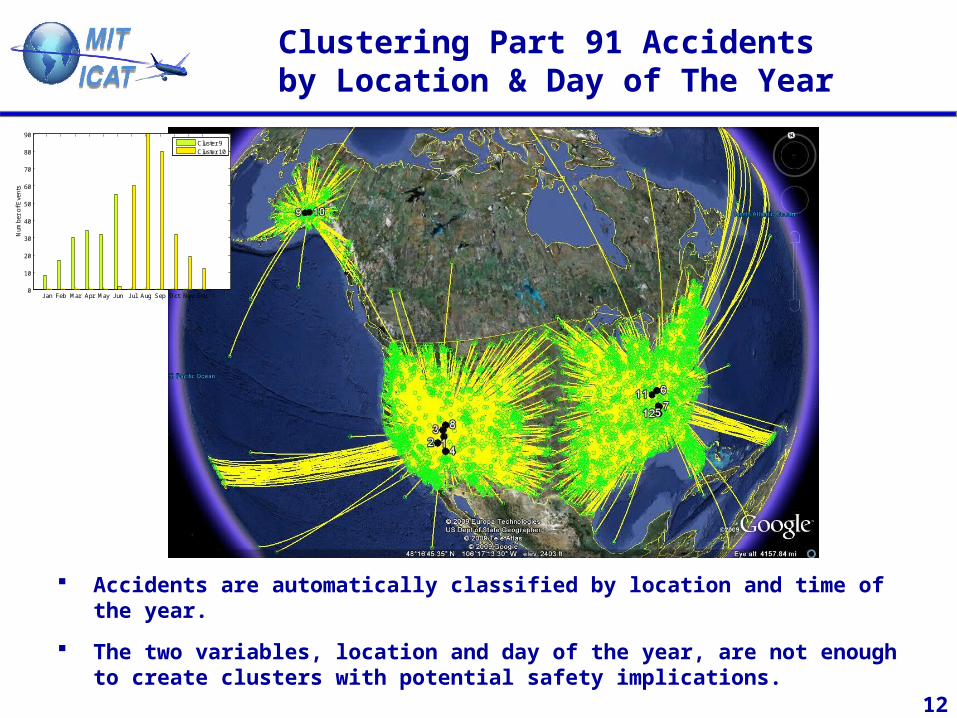
Clustering Part 91 Accidents by Location & Day of The Year
Jan Feb Mar Apr May Jun Jul Aug Sep Oct Nov Dec0
10
20
30
40
50
60
70
80
90
Num
ber
of
Eve
nts
Cluster 9Cluster 10
Accidents are automatically classified by location and time of the year.
The two variables, location and day of the year, are not enough to create clusters with potential safety implications.

13
Locations and Day of The Year of Part 121 Accidents (2000-2005)
Total number of accidents included: 157
Jan Feb Mar Apr May Jun Jul Aug Sep Oct Nov Dec 0
2
4
6
8
10
12
14
16
18
No.
of
Eve
nts
Location Distribution Time Distribution

14
Clustering Part 121 Accidents by Location & Day of the Year
Accidents sharing similar locations and time information are clustered together (12 clusters)
1 2 3 4 5 6 7 8 9 10 11 120
50
100
150
200
250
300
350
400
Cluster ID
Day
of
Th
e Y
ear
CentroidActual Data

15
Accidents in Cluster 2
Cluster 2 includes 5 Caribbean accidents• Accidents on 4/22/2002, 2/25/2003, 4/6/2003 4/24/2003 were caused by
turbulence• Accident on 2/8/2003 was caused by passenger stair handrail collapsing

16
Summary & Future Work
Data-mining method can combine multiple-dimensional information at the same time.
Accidents can be partitioned by clustering methods with specified attributes.
Future Work:
• Develop a systemic approach to include important variables in clustering method
• Explore other data-mining techniques to review safety data in a new way
• Investigate other possible safety data sources, e.g. accidents, ATC operation errors
• Identify patterns in accidents, or various anomalies, which can reveal subtle causalities underlying in the large amount of data

17
Thank You !
Questions?

18
Backup Slides