1 CHAPTER 13 Molecular Structure by Nuclear Magnetic Resonance (NMR)
20
1 CHAPTER 13 Molecular Structure by Nuclear Magnetic Resonance (NMR)
-
Upload
elmer-horn -
Category
Documents
-
view
222 -
download
0
Transcript of 1 CHAPTER 13 Molecular Structure by Nuclear Magnetic Resonance (NMR)

1
CHAPTER 13
Molecular Structureby Nuclear Magnetic Resonance (NMR)
2
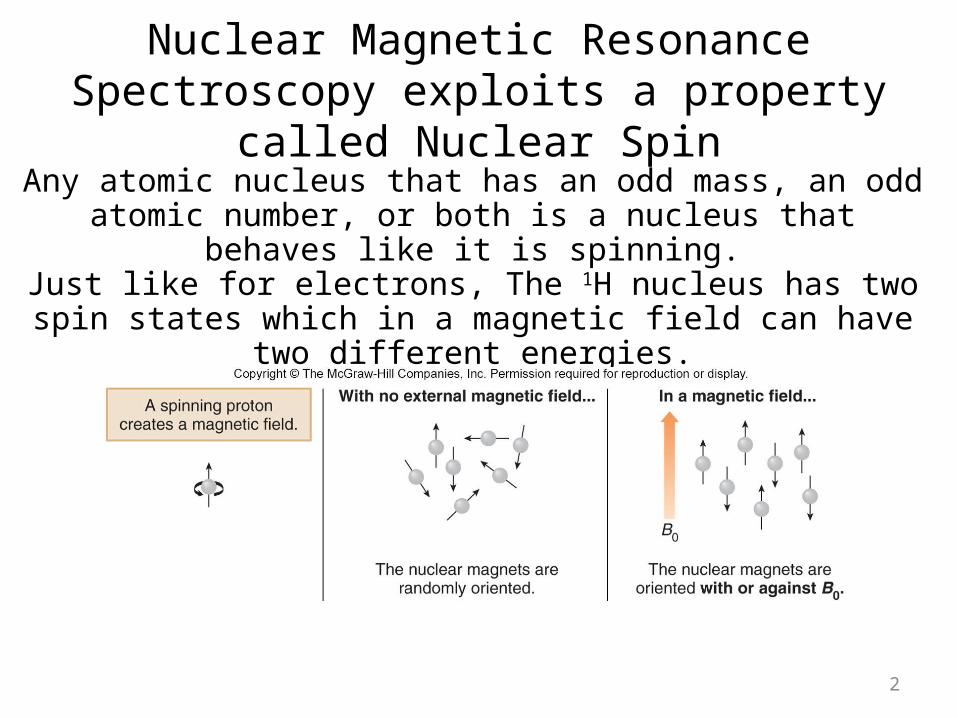
Nuclear Magnetic Resonance Spectroscopy exploits a property called Nuclear Spin
Any atomic nucleus that has an odd mass, an odd atomic number, or both is a nucleus that behaves like it is spinning.
Just like for electrons, The 1H nucleus has two spin states which in a magnetic field can have two different energies.
3
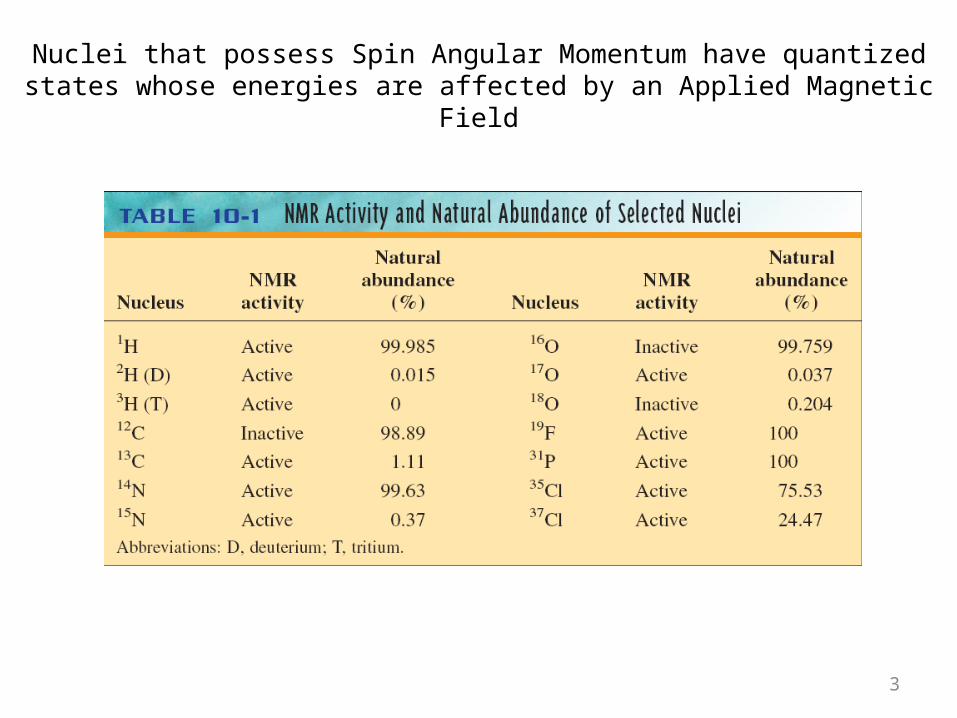
Nuclei that possess Spin Angular Momentum have quantized states whose energies are affected by an Applied Magnetic Field

4
The stronger the Applied Magnetic Field the larger the energy difference between the Spin States of the Nucleus
14,000 G (1.4 T) 60 MHz
70,500 G (7.0 T) 300 MHz
The actual energy difference is small. At 300 MHz, the energy difference for a proton is about 3 x 10⁻⁵ kcal mol-1.

When the protons are placed in a homogenous magnetic field and a pulse of the correct energy is applied, the small excess of nuclei with the
lower energy spin state absorb energy and the change in spin state is detected by the spectrometer
5Image from www2.chemistry.msu.edu
6
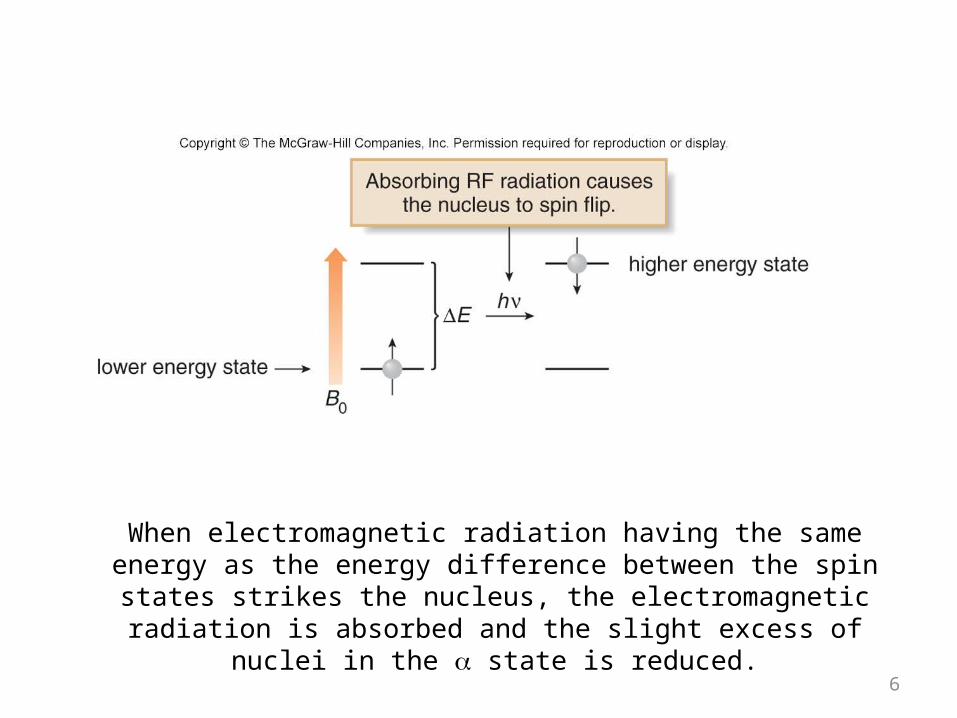
When electromagnetic radiation having the same energy as the energy difference between the spin states strikes
the nucleus, the electromagnetic radiation is absorbed and the slight excess of nuclei in the state is reduced.

7
Figure 14.1
NMR Schematic
8
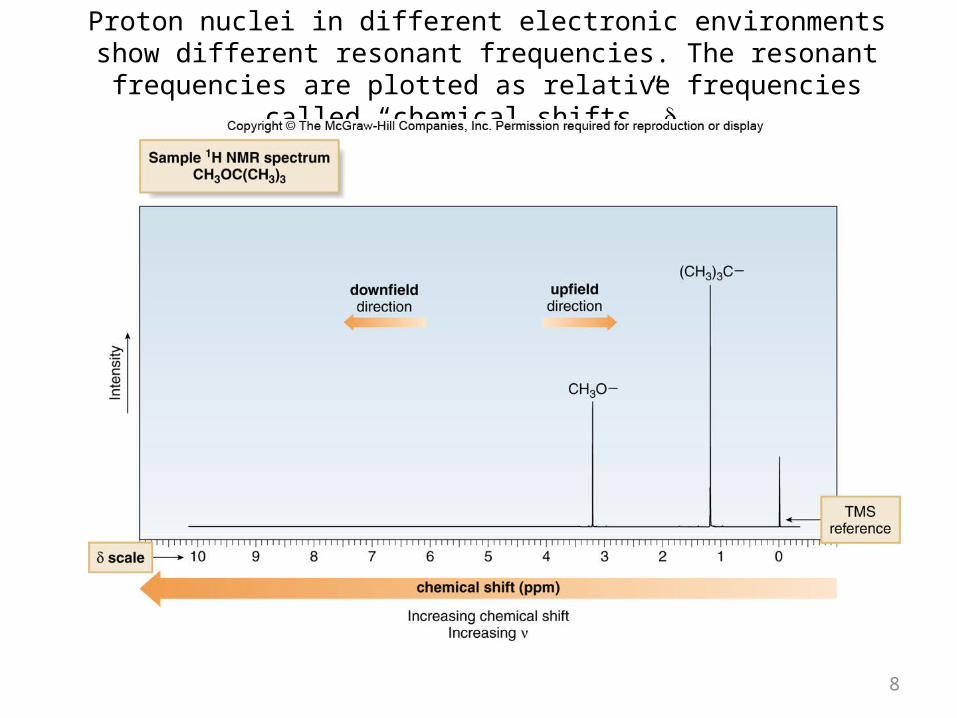
Proton nuclei in different electronic environments show different resonant frequencies. The resonant frequencies are plotted as relative frequencies
called “chemical shifts” d.

9
CHEMICAL SHIFT (): the shift in ppm of an NMR signal from the signal of TMS
dA = ( nA – nTMS) ÷ Operating frequency in MHz
Tetramethyl silane (TMS)
0.9
10
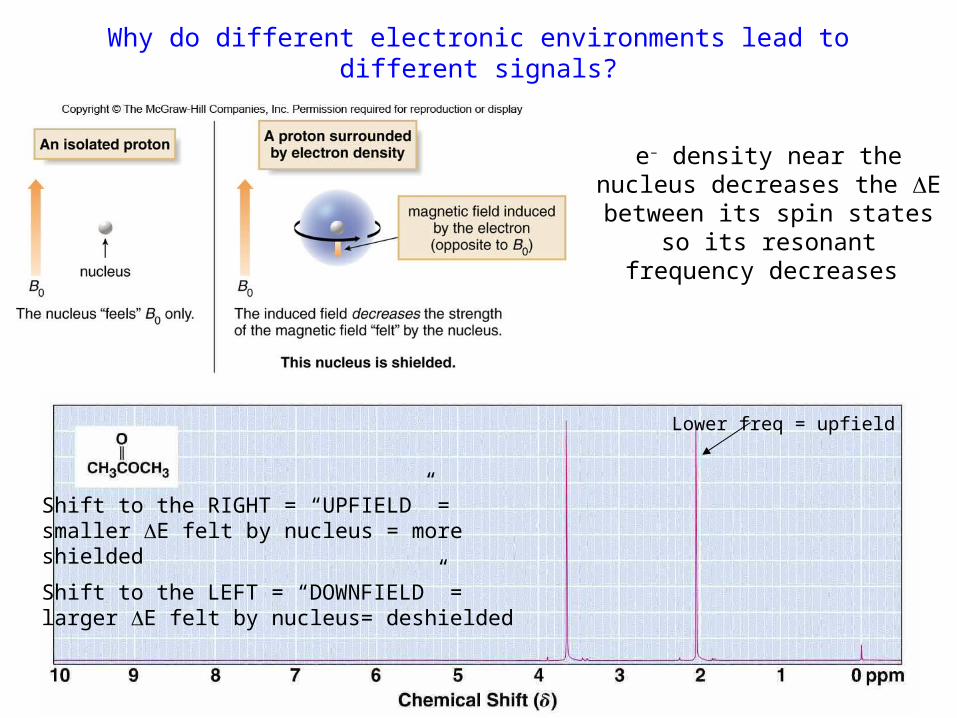
Why do different electronic environments lead to different signals?
Shift to the RIGHT = “UPFIELD” = smaller E felt by nucleus = more shielded
Shift to the LEFT = “DOWNFIELD” = larger E felt by nucleus= deshielded
Lower freq = upfield
e– density near the nucleus decreases the DE between its
spin states so its resonant frequency decreases
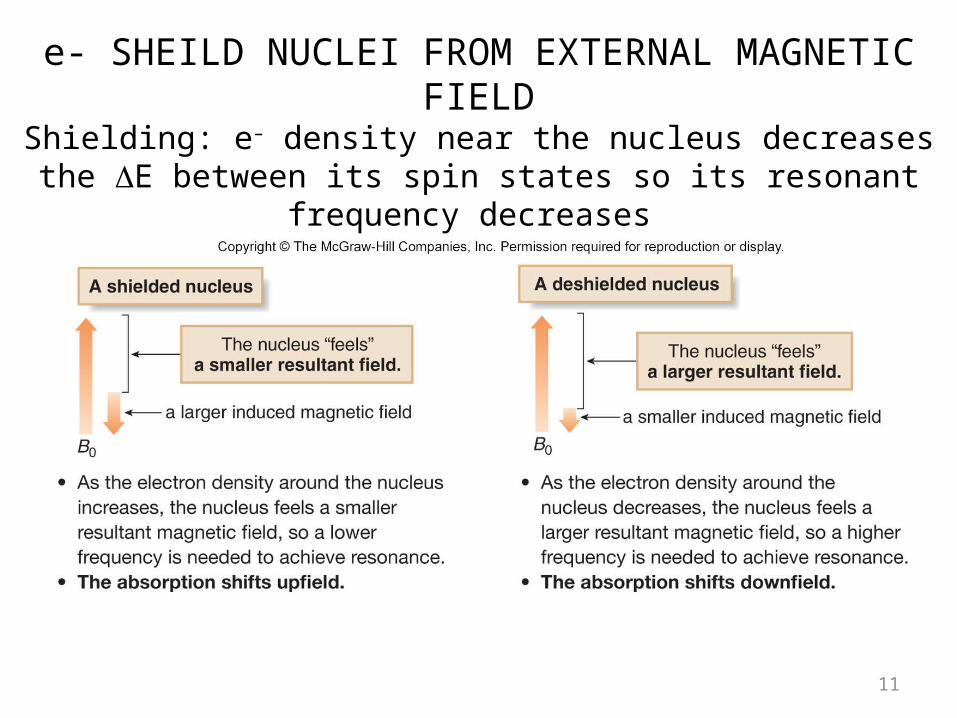
e- SHEILD NUCLEI FROM EXTERNAL MAGNETIC FIELDShielding: e– density near the nucleus decreases the DE between its spin
states so its resonant frequency decreases
11
12
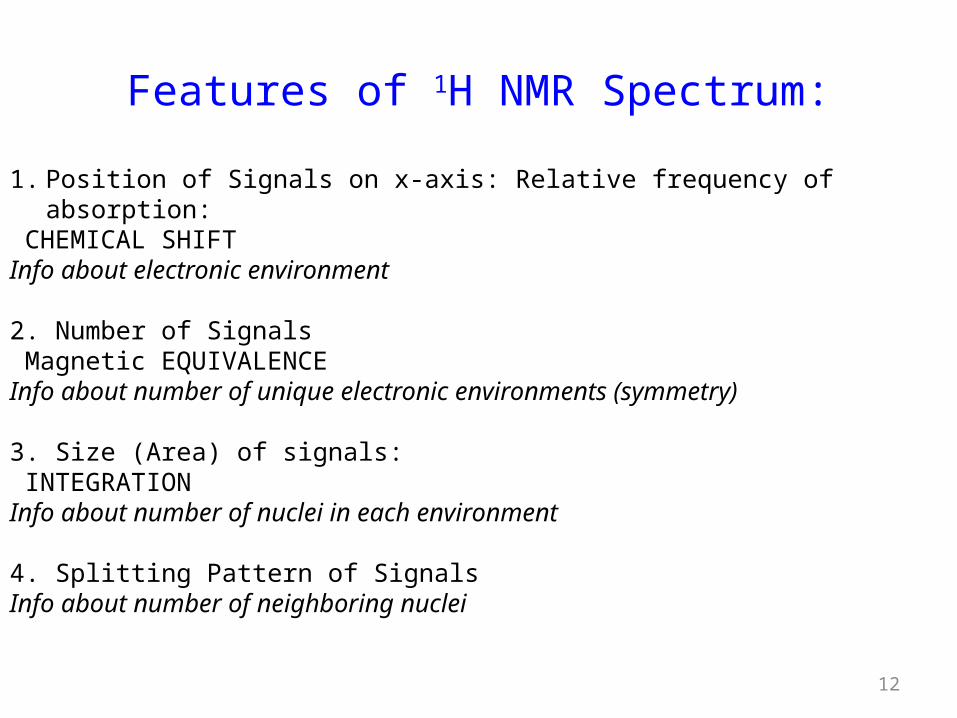
Features of 1H NMR Spectrum:
1. Position of Signals on x-axis: Relative frequency of absorption: CHEMICAL SHIFTInfo about electronic environment
2. Number of Signals Magnetic EQUIVALENCEInfo about number of unique electronic environments (symmetry)
3. Size (Area) of signals: INTEGRATIONInfo about number of nuclei in each environment
4. Splitting Pattern of SignalsInfo about number of neighboring nuclei

13
Chemical Shift: Characteristic of neighboring Functional groups (e- shielding)
14
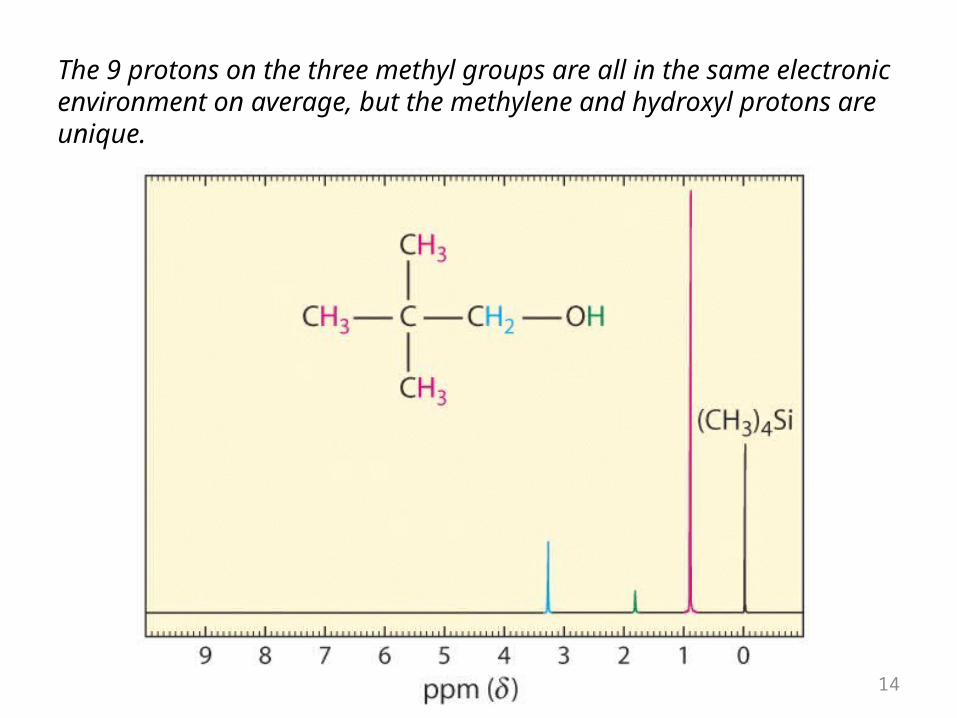
The 9 protons on the three methyl groups are all in the same electronic environment on average, but the methylene and hydroxyl protons are unique.

15
For a compound with the molecular formula C4H10, how many isomers are there?How many chemically distinct environments are there in each case?
Features of NMR Spectrum:Number of unique electronic environments
≤ number of chemically distinct proton sites on the molecule.
How many distinct environments are there for the protons on each of the following molecules?
3 signals 5 signals 4 signals
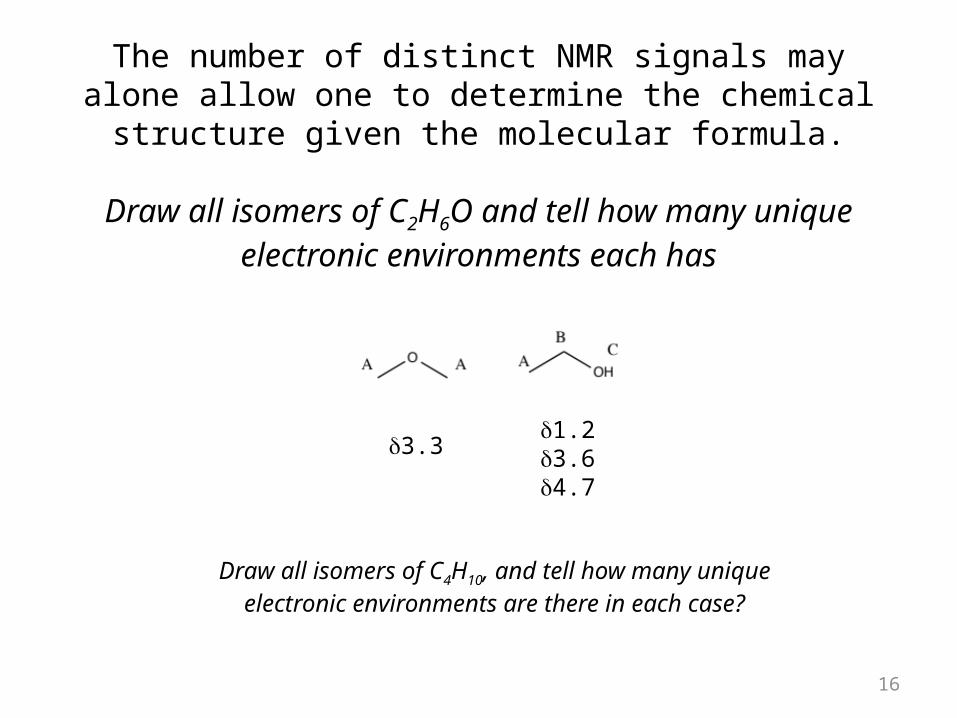
The number of distinct NMR signals may alone allow one to determine the chemical structure given the molecular
formula.
Draw all isomers of C2H6O and tell how many unique electronic environments each has
16
d3.3d1.2d3.6d4.7
Draw all isomers of C4H10, and tell how many unique electronic environments are there in
each case?

Both isomers of C4H10 have two signals, but their relative intensities and shapes differ
17
18
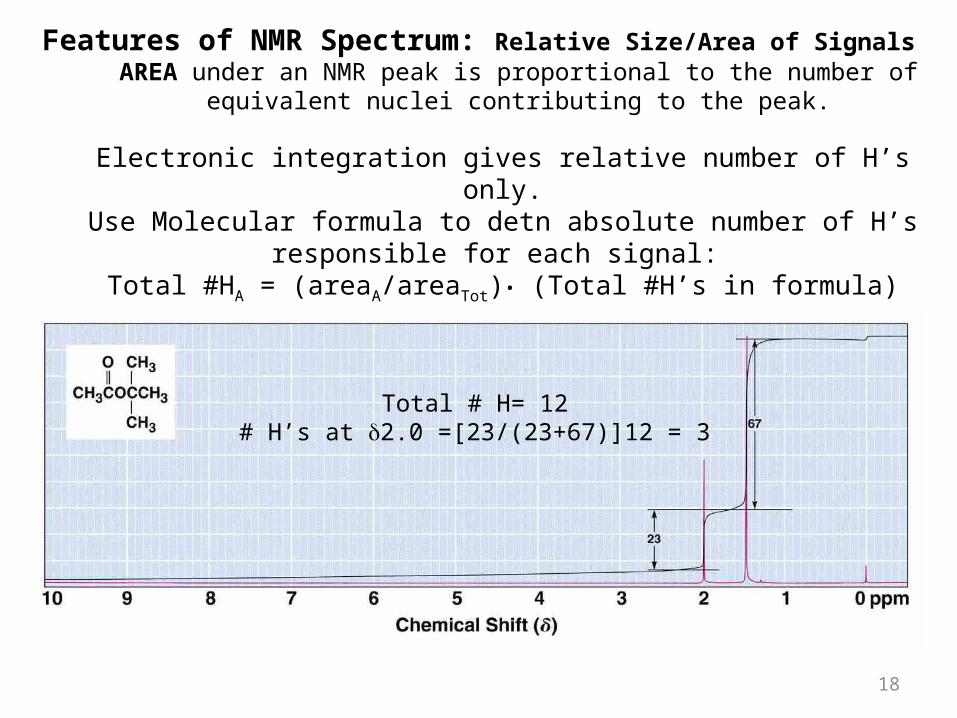
Features of NMR Spectrum: Relative Size/Area of SignalsAREA under an NMR peak is proportional to the number of
equivalent nuclei contributing to the peak.
Electronic integration gives relative number of H’s only.Use Molecular formula to detn absolute number of H’s responsible
for each signal: Total #HA = (areaA/areaTot)• (Total #H’s in formula)
Total # H= 12# H’s at 2.0 =[23/(23+67)]12 = 3
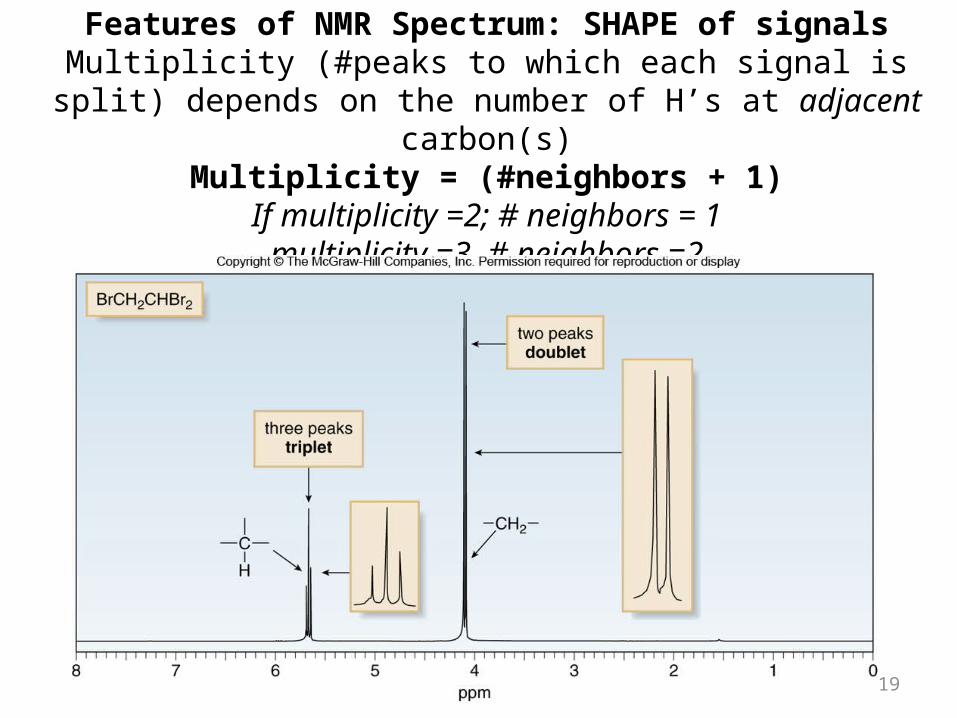
Features of NMR Spectrum: SHAPE of signalsMultiplicity (#peaks to which each signal is split) depends on the
number of H’s at adjacent carbon(s)Multiplicity = (#neighbors + 1)
If multiplicity =2; # neighbors = 1multiplicity =3, # neighbors =2
19
20
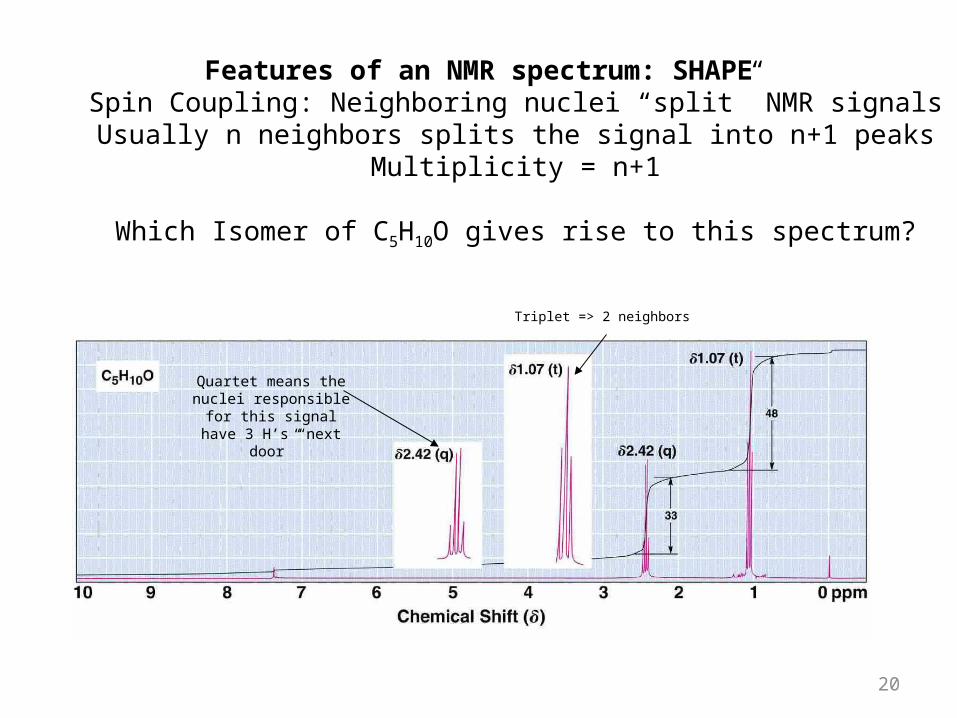
Features of an NMR spectrum: SHAPESpin Coupling: Neighboring nuclei “split” NMR signals
Usually n neighbors splits the signal into n+1 peaksMultiplicity = n+1
Which Isomer of C5H10O gives rise to this spectrum?
Quartet means the nuclei responsible for this signal have 3 H’s
“next door”
Triplet => 2 neighbors