DO NOW: IN YOUR OPINION, WHAT DO THINK BRINGS HAPPINESS? Chapter 3: Lesson 2.
1
CHAPTER 1: INTRODUCTION
The introduction chapter brings an interest to the subject of the study by
starting with a discussion on the background information. The definition of the
research problem and the purpose of the study are also presented. This
chapter also presents the significance and scope of the study. Finally, the
organization of the report is presented to give the reader an overview of the
structure of the thesis.
1.1 Overview of the Grocery Industry
Retail is the largest single industry in most countries throughout the world,
with the grocery sector being most important in terms of value and volume
(Burt and Sparks, 1994). The sale of groceries has traditionally been the
venue of the traditional provision shop located in the neighbourhood.
However, much to the dismay of traditional retailers, most of the grocery
products can now be found at many places such as discount stores,
supercentres, specialty grocers, warehouse clubs, convenience stores,
Internet retailers and drug stores (Morganosky, 1997; Kim and Jin, 2001;
Carpenter and Moore, 2006).
In addition to grocery products, some of the retailers such as hypermarkets,
supercentres, and discount stores also offer a wide variety of other product
categories such as apparel, household goods, pharmaceuticals, cosmetics,
home furnishing and sporting goods in the same place. This move offers the
consumers the convenience of ―one-stop shopping‖ as they no longer need to
shop at various places or stores for several products. Thus, the consumers
2
fulfill as many shopping needs as possible when visiting the same store. As a
result, most consumers prefer to shop at the new retail formats such as
hypermarkets or supercentres.
Changes in the grocery sector are evidenced by the popularity of
hypermarkets, supercentres, large scales supermarkets and convenience
stores. It is found that the new retail formats pose a serious threat to
traditional grocery stores (Morganosky, 1997; Farhangmehr et. al., 2000;
Seiders and Tigert, 2000). According to Seiders and Tigert (2000),
hypermarkets in Europe have replaced thousands of small neighbourhood
grocery stores, as the hypermarkets are able to offer a large assortment and
competitive pricing.
Morganosky (1997) found that consumers are making fewer visits to
traditional grocery stores and are spending less per trip. In contrast, the
percentage of shoppers visiting warehouse clubs, supercentres and
convenience stores for grocery items continue grow. This shows that
consumers are no longer depending on the traditional grocery stores for their
groceries. Instead, they are visiting other retail formats for the purchase of
their groceries.
Although consumers have changed their store choice decision by shopping at
the new retail format, no research has found that consumers rely on a single
format for their shopping needs. This indicates that the shoppers are relying
on multiple retail formats to accommodate their lifestyles and to meet their
3
shopping needs. They prefer to shop at different formats as each type of
format has various store attributes, which they perceive as important. Store
attribute such as low price, a wide variety of merchandise, convenience, good
quality and services are factors that will contribute to consumers‘ image
formation and will affect their store choice decision. (Farhangmehr et. al.,
2000; Seiders and Tigert, 2000; Jin and Kim, 2003; Carpenter and Moore,
2006; Carpenter, 2008).
However, Rhee and Dell (2002) found that while shoppers often shop at more
than one store, they typically have a primary affiliation to a ―main store‖ that
captures the majority of their purchases. Being the first choice store is
important for retailers, because consumers tend to shop at the store more
often and will spend twice as much in the store compared to others (Knox and
Denison, 2000). Thus, it is important for the retailers to understand the factors
that affect consumers store choice decision. This information is vital in turning
the consumers into loyal customers.
1.2 Research Problem
Malaysia has also experienced the format change in retailing in recent
decades, with the emergence of large-scales retailer in the early 1990s. Retail
formats in Malaysia include the traditional grocery retailers, hypermarkets,
supermarkets, convenience stores, and specialty stores. Traditional stores still
dominate the grocery market, but it can be seen that the new retail formats
such as hypermarkets, supermarkets and convenience stores are slowly
replacing traditional retail outlets. Table 1.1 summarizes the market share of
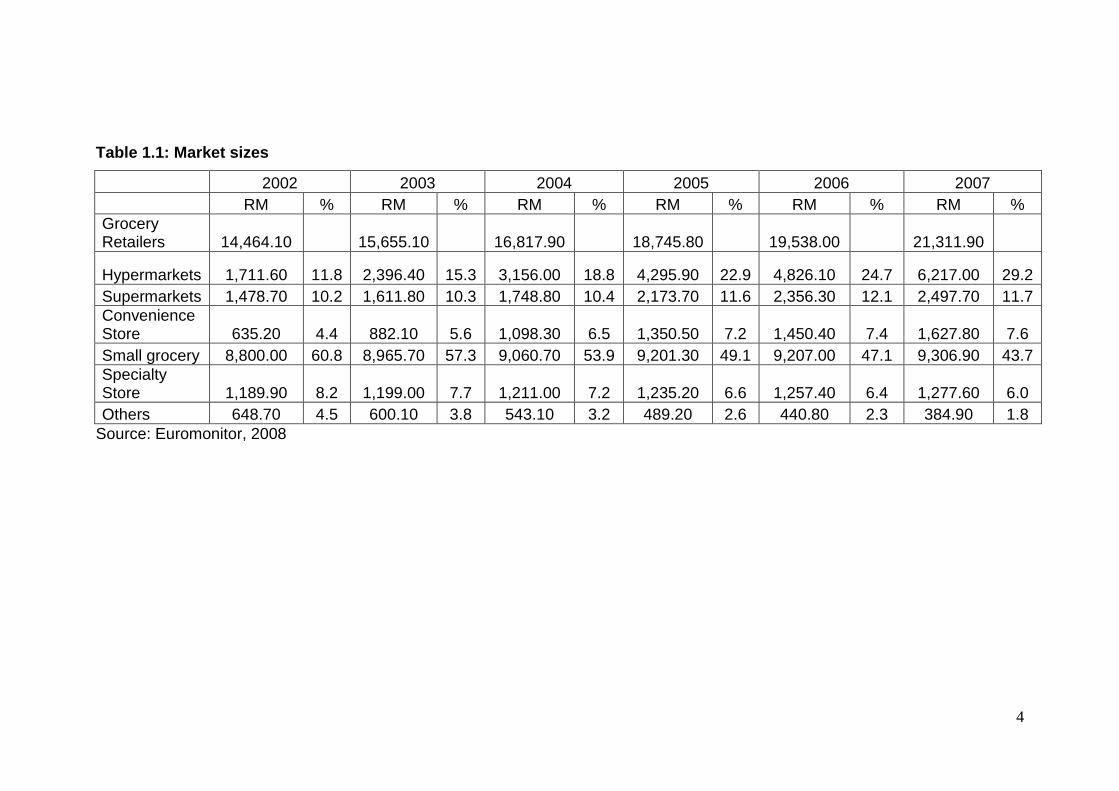
4
Table 1.1: Market sizes
2002 2003 2004 2005 2006 2007
RM % RM % RM % RM % RM % RM %
Grocery Retailers 14,464.10
15,655.10
16,817.90
18,745.80
19,538.00
21,311.90
Hypermarkets 1,711.60 11.8 2,396.40 15.3 3,156.00 18.8 4,295.90 22.9 4,826.10 24.7 6,217.00 29.2
Supermarkets 1,478.70 10.2 1,611.80 10.3 1,748.80 10.4 2,173.70 11.6 2,356.30 12.1 2,497.70 11.7
Convenience Store 635.20 4.4 882.10 5.6 1,098.30 6.5 1,350.50 7.2 1,450.40 7.4 1,627.80 7.6
Small grocery 8,800.00 60.8 8,965.70 57.3 9,060.70 53.9 9,201.30 49.1 9,207.00 47.1 9,306.90 43.7
Specialty Store 1,189.90 8.2 1,199.00 7.7 1,211.00 7.2 1,235.20 6.6 1,257.40 6.4 1,277.60 6.0
Others 648.70 4.5 600.10 3.8 543.10 3.2 489.20 2.6 440.80 2.3 384.90 1.8
Source: Euromonitor, 2008

5
the grocery industry in Malaysia. The market share of traditional stores (small
grocery) has dropped from 60.8 percent in 2002 to 43.7 percent in 2007.
However, a few studies (see Lim et. al, 2003; Nielsen Company, 2007) found
that the traditional retailers still have an advantage in rural areas and smaller
towns. They are losing their market share in larger towns and cities only. Due
to the rapid growth of the modern retail format, retailers need to react to the
changes in order to continue to survive in this competitive industry.
Although there are various types of retail formats that offer similar products, it
was determined that each type of retail format has different store attributes,
which can drive the store choice process for at least one major market
segment. For instance, hypermarkets and supercentres are well-known for
their low price and large assortment, while convenience stores, as the name
implies, are a convenience oriented store. Following that, it is very important
for grocery retailers to use a different strategy to differentiate from their
competitors.
Although consumers often show patronage to various stores, they do have a
primary connection to a ―main store‖ that captures the majority of their
purchases. Woodside and Trappey (1992) found that consumers decide their
primary store based on the attributes of the store. They found that consumers
could quickly name a store when asked what store comes to their mind for
specific attributes such as ―lowest price‖, or ―most convenient‖ to them. Thus,
it is important for the retailers to delve into the factors that will affect
consumers shopping behaviour.
6
Store image attributes are important as they will affect consumers‘ behaviour
towards the store (Woodside and Trappey, 1992). Consumers will prefer to
shop at stores that have attributes that can satisfy their needs. For example,
busy people will prefer to shop at convenience stores, as this retail format is
known for its long operating hours such as open 24 hours per day. On the
other hand, those who prefer low price tend to shop more at hypermarkets as
this format is known for its low pricing. The consumers are more likely to shop
and buy at the store if they are satisfied with the store attributes. Hence, it is
important for the retailers to know which store attributes are important and
how it will affect the consumers‘ behaviour.
1.3 Research Objective
The Malaysian grocery sector has experienced dramatic changes in the last
few decades with the emergence of new retail formats such as hypermarkets,
large scale supermarkets, and convenience stores. As a result, it has affected
the way consumers shop as they have more choices to choose from. Thus, it
is important for the retailers to know the reasons why consumers choose to
shop at a particular store, and also the factors that will influence their
subsequent behaviour. The objective of this study is to investigate consumer
behaviour in the grocery industry. Specifically, this research aims to:
1. understand consumer grocery shopping pattern
2. examine the impact of store attributes on store choice
3. identify the factors that affect consumer behaviour towards the store
4. examine the relationship between store attributes, consumer
satisfaction towards the store and store loyalty
7
1.4 Research Questions
This study attempts to answer the following questions:
1. Which retail format is shopped at most often by consumers?
2. Which store attributes are perceived as most important by consumers
when making their store choice decision?
3. What are the factors (store attributes) that affect consumers‘
satisfaction and loyalty behaviour?
1.5 Significance of the Study
There have been a significant amount of studies that examine the issues of
consumer shopping behaviour and retail marketing strategies to tackle the
intense competition in the present retail channel in the grocery industry.
However, most of the studies have been conducted in Western countries such
as the United States of America, United Kingdom and European countries.
Thus, it is crucial for the retailers to gain a better understanding of the grocery
consumers in Malaysia.
In light of the emergence of many new grocery formats, consumers now have
more choice to compare and decide where to shop for their groceries.
However, most previous studies focus on one or a limited perspective only.
For example, Farhangmehr et. al. (2000) examined the consumers perception
of hypermarkets and traditional retail stores in Portugal; Seiders and Tigerts
(2000) on the supercentres; Koo (2003) and Jin and Kim (2003) have
examined the discount retail environment in Korea. As such, this study will be
helpful in giving a better picture of the retail industry as it has focused on four

8
main channels (hypermarket, supermarket, convenience store and traditional
stores) found in Malaysia.
In addition, this study highlights the importance of store attributes in the
retailing environment. Many researchers have identified that store attributes
play an important role in affecting consumer‘s store choice decision. Thus,
through the identification of the store attributes perceived by consumers,
retailers can establish better marketing strategies for their store.
1.6 Scope of the Study
The grocery sector is used in this study to measure consumer‘s behaviour in
the industry. This is because, as mentioned at the beginning of this chapter,
grocery is the most important sector in terms of volume and value in the
retailing industry. Based on Euromonitor‘s Retailing Report in Malaysia
(2008), four main retail formats (hypermarket, supermarket, convenience
store, and traditional grocery store) are selected to determine the preferred
grocery store format in Malaysia.
The study was conducted in the Klang Valley using non probability and
convenience sampling. The Klang Valley was chosen due to the number and
large variety of choice of formats available and also its highly dense
population (KPMG, 2006).
9
In order to understand the factors that will drive consumers to revisit the store
again, store attributes have been chosen as the factor that will determine
consumer‘s loyalty towards the store.
1.7 Organization of the Report
This report consists of six chapters. It is organized as follows:
Chapter 1: The introduction chapter brings an interest to the subject of the
study by starting with a discussion on the background information. The
definition of the research problem and the purpose of the study are also
presented in this chapter. In addition, the significance and scope of the study
is also discussed. Finally, the disposition is presented to give the reader an
overview of the thesis.
Chapter 2: The chapter explains about the retailing industry. The chapter
starts with an overview of the retailing industry. The definition of various types
of retail channels are also presented here. It is then followed by a discussion
on the retail sector in Malaysia. Finally, the development of the grocery
market in Malaysia is also presented.
Chapter 3: This chapter will review the literature that is related to this study.
The chapter starts with the introduction about consumer behaviour in the
grocery industry. It is followed by store image, customer satisfaction and store
loyalty. Finally, the relationship of store image, customer satisfaction and
store loyalty is discussed.
10
Chapter 4: This chapter outlines the methodology employed in the study. It
begins with a review of the research framework. Then, it provides the
hypotheses developed in this study. Thereafter, the design of the research
instrument and measurements instruments will be discussed. Finally, the data
analysis techniques used are also presented.
Chapter 5: This chapter presents the findings of the survey. It begins with a
description of the general characteristics of the respondents. This is followed
by an analysis on the shopping habits of the respondents. The results of the
validity test and reliability test are also discussed. It is followed by a test on
the hypotheses developed in the previous chapter. After that, the effect of
store attributes on consumer behaviour is also discussed. Finally, the
consumer preference structure of the retail channel is presented.
Chapter 6: The final chapter will provide the conclusion for this research. First,
an overview of the study will be provided. Thereafter, the summary of the
major findings, marketing implications, limitations of the study and further
suggestion are presented. Finally, the chapter ends with the concluding
remarks of the study.
1.8 Conclusion
This chapter discusses the introduction of the study, which includes the
research problem, purpose of the study, importance of the study, research
scope and the thesis organization. Following that, in Chapter 2, an overview
of the retailing industry will be provided.

11
Figure 1.1: Organization of the Report
Chapter 1
Introduction
2.0 Introduction
2.1 Retailing 2.2 Retail Sector in Malaysia 2.3 Development of the Grocery Sector In
Malaysia 2.4 Conclusion
1.0 Introduction
1.1 Overview of the Grocery Industry 1.2 Research Problem 1.3 Research Objectives 1.4 Research Questions 1.5 Significance of the Study 1.6 Scope of the Study 1.7 Organization of the Report 1.8 Conclusion
Chapter 6
Conclusion & Implications
6.0 Introduction 6.1 Overview of the Study 6.2 Summary of the Research Result 6.3 Marketing Implication 6.4 Limitation of the Study 6.5 Suggestion for Future Research 6.6 Concluding Remarks
5.0 Introduction 5.1 Demographic Profile of Respondents 5.2 Consumers‘ Grocery Shopping Pattern 5.3 Validity Test 5.4 Reliability Test 5.5 Test of Hypothesis 5.6 Multiple Regression Analysis 5.7 Consumer‘s Preference Structure 5.8 Conclusion
Chapter 5
Data Analysis
4.0 Introduction 4.1 Research Framework 4.2 Hypotheses Development 4.3 Research Design 4.4 Measurement Instrument 4.5 Data Analysis Techniques 4.6 Conclusion
Chapter 4
Research
Methodology
3.0 Introduction 3.1 Consumer Behaviour in Grocery Shopping 3.2 Store Image 3.3 Store Attributes 3.4 Customer Satisfaction 3.5 Customer Loyalty 3.6 The Relationship of Store Image,
Customer Satisfaction and Store Loyalty 3.7 Conclusion
Chapter 3
Literature Review
Chapter 2
Retailing Industry
in Malaysia
12
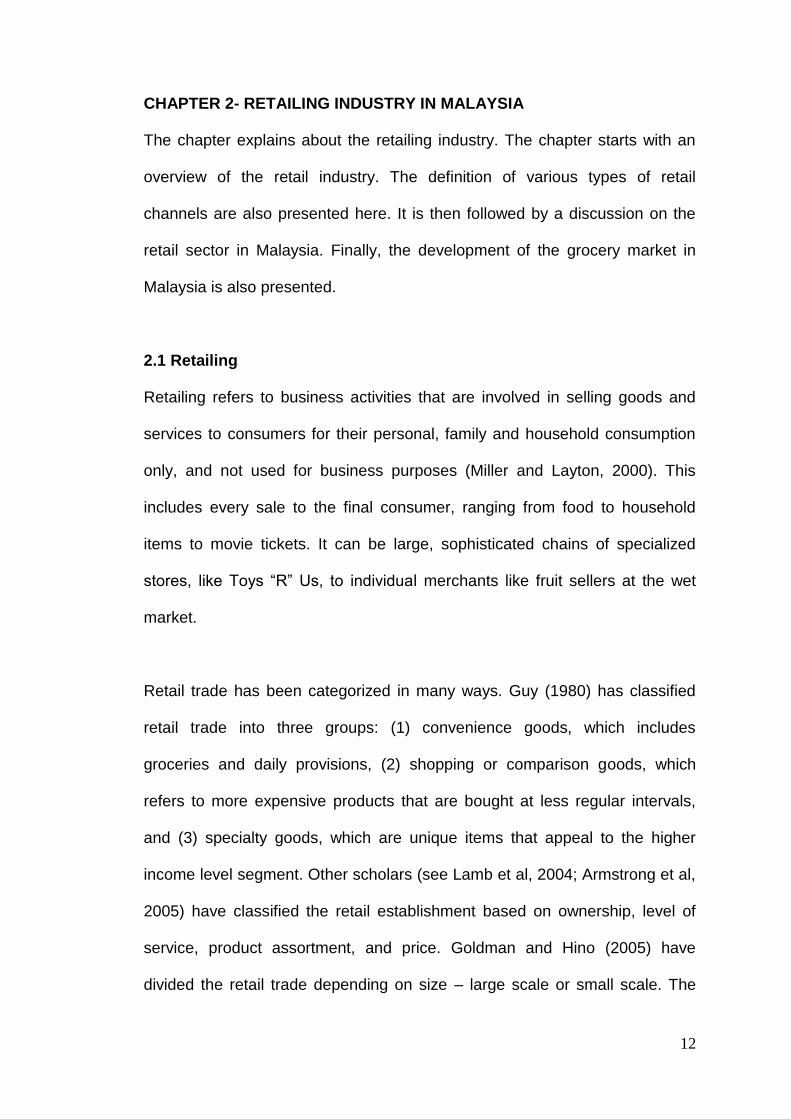
CHAPTER 2- RETAILING INDUSTRY IN MALAYSIA
The chapter explains about the retailing industry. The chapter starts with an
overview of the retail industry. The definition of various types of retail
channels are also presented here. It is then followed by a discussion on the
retail sector in Malaysia. Finally, the development of the grocery market in
Malaysia is also presented.
2.1 Retailing
Retailing refers to business activities that are involved in selling goods and
services to consumers for their personal, family and household consumption
only, and not used for business purposes (Miller and Layton, 2000). This
includes every sale to the final consumer, ranging from food to household
items to movie tickets. It can be large, sophisticated chains of specialized
stores, like Toys ―R‖ Us, to individual merchants like fruit sellers at the wet
market.
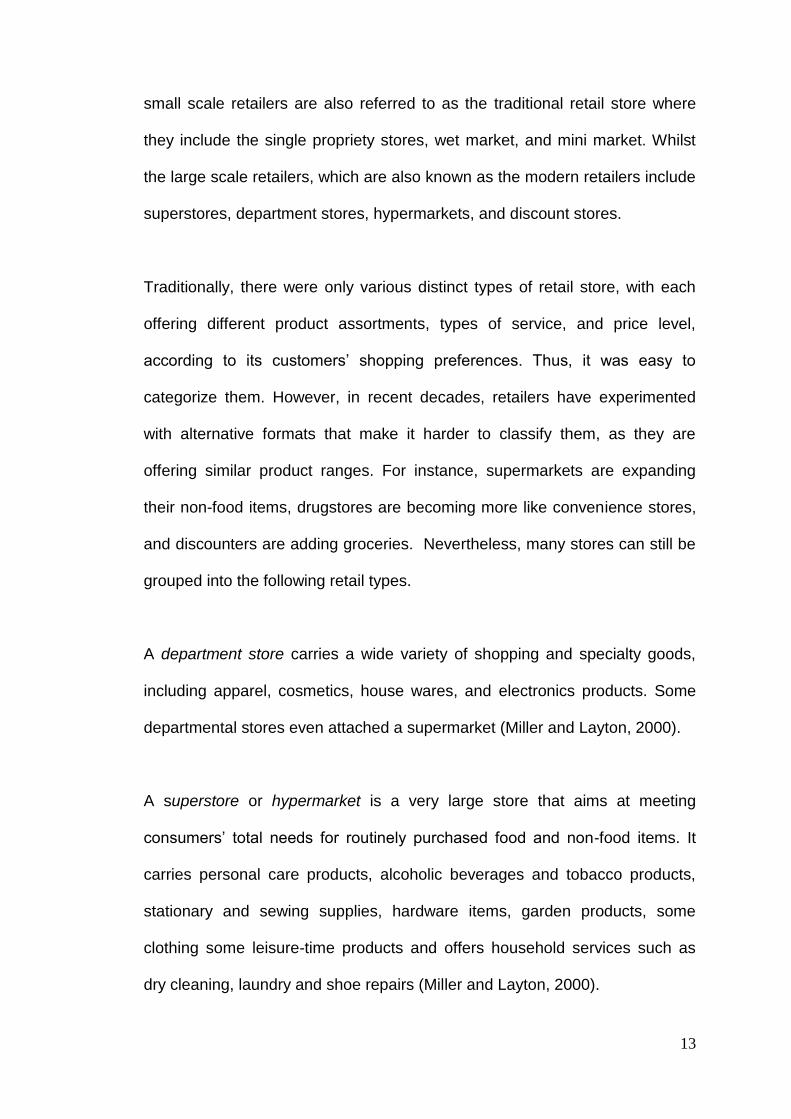
Retail trade has been categorized in many ways. Guy (1980) has classified
retail trade into three groups: (1) convenience goods, which includes
groceries and daily provisions, (2) shopping or comparison goods, which
refers to more expensive products that are bought at less regular intervals,
and (3) specialty goods, which are unique items that appeal to the higher
income level segment. Other scholars (see Lamb et al, 2004; Armstrong et al,
2005) have classified the retail establishment based on ownership, level of
service, product assortment, and price. Goldman and Hino (2005) have
divided the retail trade depending on size – large scale or small scale. The
13
small scale retailers are also referred to as the traditional retail store where
they include the single propriety stores, wet market, and mini market. Whilst
the large scale retailers, which are also known as the modern retailers include
superstores, department stores, hypermarkets, and discount stores.
Traditionally, there were only various distinct types of retail store, with each
offering different product assortments, types of service, and price level,
according to its customers‘ shopping preferences. Thus, it was easy to
categorize them. However, in recent decades, retailers have experimented
with alternative formats that make it harder to classify them, as they are
offering similar product ranges. For instance, supermarkets are expanding
their non-food items, drugstores are becoming more like convenience stores,
and discounters are adding groceries. Nevertheless, many stores can still be
grouped into the following retail types.
A department store carries a wide variety of shopping and specialty goods,
including apparel, cosmetics, house wares, and electronics products. Some
departmental stores even attached a supermarket (Miller and Layton, 2000).
A superstore or hypermarket is a very large store that aims at meeting
consumers‘ total needs for routinely purchased food and non-food items. It
carries personal care products, alcoholic beverages and tobacco products,
stationary and sewing supplies, hardware items, garden products, some
clothing some leisure-time products and offers household services such as
dry cleaning, laundry and shoe repairs (Miller and Layton, 2000).

14
A discount store is a retailer that competes on the basis of low price, high
turnover and high volume (Miller and Layton, 2000).
Supermarkets are large, low cost, low margin, high volume, self-service stores
that cater to serve the consumer‘s total needs for food and household
products (Miller and Layton, 2000).
Specialty stores are stores that carry narrow product lines with a deep
assortment within those lines. They specialize in a given type of merchandise.
Examples include children‘s clothing, candy, baked goods, gourmet coffee,
and organic foods (Miller and Layton, 2000).
Convenience stores are small stores that are located near residential areas,
open long hours seven days a week, and carry a limited line of high turnover
convenience products at slightly higher prices (Miller and Layton, 2000).
2.2 Retail Sector in Malaysia
The rapid expansion of the Malaysian economy over the last few decades,
combined with external and social influences has led to a boom in the retail
industry. Consequently, the retail industry in Malaysia is highly fragmented, as
there are a lot of retailers entering the competitive market each year.
Moreover, more and more international companies are aiming at having a
share in this industry by opening more outlets to strengthen their position in
the world.
15
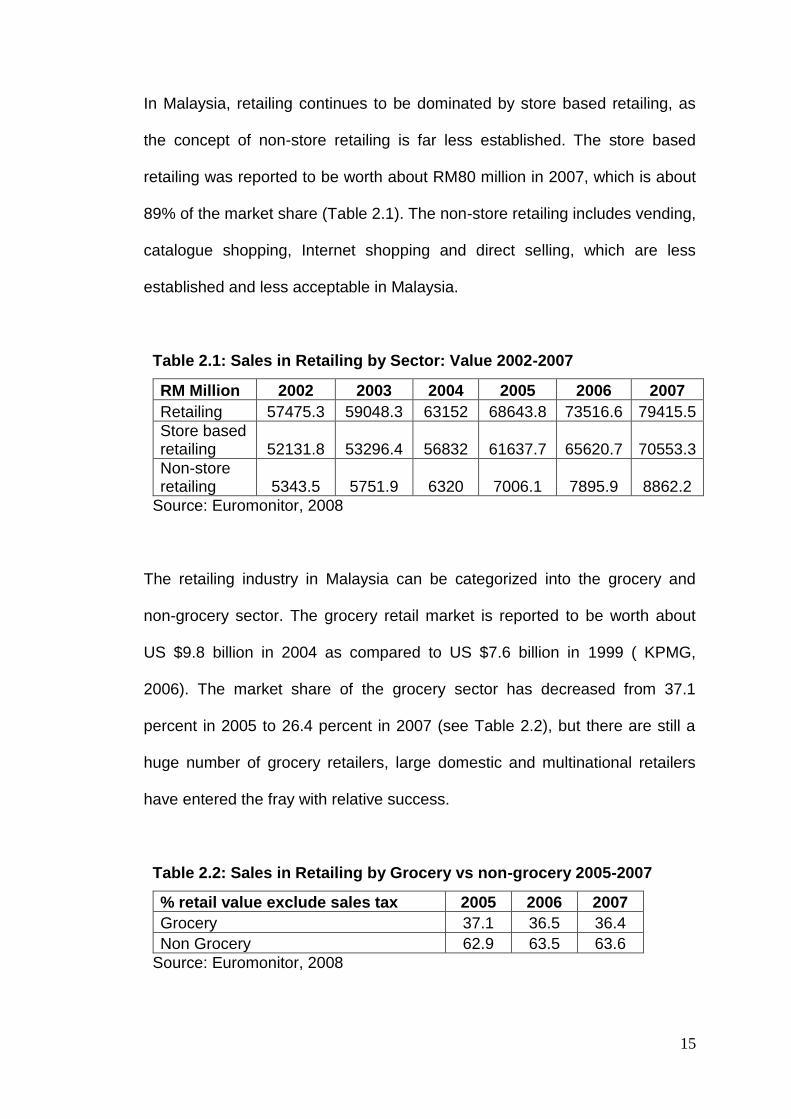
In Malaysia, retailing continues to be dominated by store based retailing, as
the concept of non-store retailing is far less established. The store based
retailing was reported to be worth about RM80 million in 2007, which is about
89% of the market share (Table 2.1). The non-store retailing includes vending,
catalogue shopping, Internet shopping and direct selling, which are less
established and less acceptable in Malaysia.
Table 2.1: Sales in Retailing by Sector: Value 2002-2007
RM Million 2002 2003 2004 2005 2006 2007
Retailing 57475.3 59048.3 63152 68643.8 73516.6 79415.5
Store based retailing 52131.8 53296.4 56832 61637.7 65620.7 70553.3
Non-store retailing 5343.5 5751.9 6320 7006.1 7895.9 8862.2
Source: Euromonitor, 2008
The retailing industry in Malaysia can be categorized into the grocery and
non-grocery sector. The grocery retail market is reported to be worth about
US $9.8 billion in 2004 as compared to US $7.6 billion in 1999 ( KPMG,
2006). The market share of the grocery sector has decreased from 37.1
percent in 2005 to 26.4 percent in 2007 (see Table 2.2), but there are still a
huge number of grocery retailers, large domestic and multinational retailers
have entered the fray with relative success.
Table 2.2: Sales in Retailing by Grocery vs non-grocery 2005-2007
% retail value exclude sales tax 2005 2006 2007
Grocery 37.1 36.5 36.4
Non Grocery 62.9 63.5 63.6
Source: Euromonitor, 2008
16
2.3 Development of the Grocery Retailing in Malaysia
Malaysia has witnessed the emergence of different types of grocery retailing
formats in recent decades. The grocery industry is made up of a variety of
formats such as wet markets, night markets, convenience stores, specialty
stores, supermarkets, and hypermarkets. The different channels cater to the
different segments of the Malaysian population, as each channel has different
store attributes, and is able to attract a different market segment to visit the
store.
The structure of the industry has changed with the increasing presence of
hypermarkets, supermarkets and non-store based retailing. This move has
provided the consumers more places to consider for their grocery shopping.
As a result, Malaysian consumers‘ behaviour has also been affected. A
survey of Malaysians‘ shopping habits in 1997 indicated that supermarket
shoppers increased by 1.5 times, while hypermarkets shoppers have more
than doubled since 1995 (Eighth Malaysia Plan, 2001-2005).
2.3.1 Traditional Grocery Stores
The traditional store was the first type of retail format to exist in Malaysia. It
includes non-permanent retail facilities such as hawkers, provision shops,
grocery shops, Chinese medical halls, wet markets, mini markets and other
similar retail outlets, which sell a limited range of grocery products on a small
scale. The traditional stores sub-sector is large but highly fragmented. The
traditional store has been affected badly by the emergence of new entrants,
17
as they are unable to compete with the large retailers in terms of pricing and
product assortment.
A research by the Nielsen Company (2007) found that the market share of the
traditional trade has slipped by 5% within three years, from having 55% of the
market share in 2004 to 50% in 2006. This shows that the majority of
Malaysians still continue to shop at traditional stores as this type of outlet is
located near to their homes and still commands a significant share of the retail
market. It was found that although the traditional retailers are still holding on
to customers in rural areas and smaller towns they are losing customers in
larger towns and cities (Lim et. al, 2003; Nielsen Company, 2007).
2.3.2 Supermarkets
Supermarkets were introduced in the early sixties. They soon became a norm
in the Malaysian retail landscape and have been the dominant grocery stores.
The introduction of the hypermarket in the 1990s had an adverse impact on
the growth of supermarkets. Supermarkets are mainly found within in
shopping malls or secondary towns in Malaysia. Hence, this retail format is
especially popular for spontaneous shoppers as well as consumers who shop
for essential items in small volume.
A research by Euromonitor (2008) revealed that the sales of supermarkets
increased 68.9 percent from 2002 to 2007 and forecasted that it will grow
about 30 percent in the following five year period. The supermarket industry in
Malaysia can be divided into two channels – standalone supermarkets such

18
as Giant Supermarket, Econsave and Cold Storage or those located in
department stores such as Isetan and Jusco. Multinational retailers such as
Giant, Cold Storage and Jusco dominate the supermarket environment.
Nonetheless, domestic players such as Billion and Econsave are also
flourishing in the supermarket sector. The success of the domestic players is
largely due to their strength in rural areas, as they only compete with a small
number of supermarket operators.
Despite stiff competition in the grocery industry, the supermarket operators
are using a different strategy to position themselves. Some of the
supermarkets focus on targeting the different consumer segments. Instead of
competing with the hypermarkets to target the price-conscious segment, Cold
Storage, Isetan and Jaya Jusco offer a superior product range and customer
services. These supermarkets focus on the middle and high-income
consumers and also the expatriates. They are also offering an international
shopping experience where food from all over the world is made available.
For example, Cold Storage offers a wide variety of international grocery items
which are unavailable in other grocery stores. Conversely, Isetan offers a
wide variety of Japanese items.
On the other hand, Jusco and Isetan have a better advantage as they are
located within the department stores. This encourages their consumers to
shop under one-roof. At the same time, they also have loyalty programmes
that can be used throughout the department store. Besides operating the
Jusco departmental stores, AEON Co. (M) Bhd is also aggressively
19
expanding in the standalone distribution channel. The company has opened
up Max Valu supermarkets in the residential areas to provide convenience
services for the neighbourhood.
2.3.3 Hypermarkets
In Malaysia, the hypermarket has grown rapidly since the 1990s. The
emergence of hypermarkets has altered the structure of the distributive trade
in Malaysia to some extent. The existence of hypermarkets has allowed the
consumers to do their shopping easily with less hassle as they can purchase
the grocery products and mass merchandise under one-roof. A research
carried out by Euromonitor (2008) revealed that hypermarkets recorded sales
of RM6,217 million in 2007, which represents a 263.2 percent increase since
2002. Euromonitor has forecasted that the sales in hypermarkets will reach
RM11,199.5 million by 2012. The success of the hypermarket chains is largely
due to their low price, wide range of offerings, customer service and strategic
location (Seiders and Tigert, 2000; Carpenter, 2008).
The hypermarket industry is dominated by the foreign retailers, namely,
Carrefour, Giant, and Tesco. This is because multinational companies have a
greater capability in terms of outlet expansion, development of private label
products, and offer extensive ranges of products and value-added services. In
2007, the hypermarket market was led by Giant, followed by Carrefour and
Tesco (Euromonitor, 2008). The dominance of Giant is largely due to the high
number of outlets available in Malaysia.

20
Despite there being only a few key players, the hypermarket environment is
highly competitive. This is because the retailers employ similar positioning
strategy in order to attract more consumers. Most of the hypermarket
operators compete on pricing and promotion to attract more customers. Some
retailers even reduce prices permanently in order to attract more people to the
stores. Major promotions and advertisements are some of the key growth
strategies utilized. For instance, Tesco‘s introduced their famous Clubcard
loyalty programme in 2007. Meanwhile, in order to compete with Tesco, some
of the hypermarket retailers have tied-up promotions with credit card providers
in order to attract the customers and turn them into a loyalty consumer. For
example, Citibank-Giant card holders are able to enjoy a two percent rebate
on the products that they purchase at Giant.
The hypermarket is still in the progress of expansion. However, it is expected
to slow down as the Government has introduced new guidelines on the
opening of new hypermarkets in an attempt to slow down their rapid growth
and to provide some level of protection for small retailers. With the freeze on
hypermarket expansion in the Klang Valley, Penang and Johor, foreign
players are now expanding in urban cities. Nonetheless, with a minimum
population requirement of 350,000, only a few cities qualify for the opening of
new hypermarkets.
2.3.4 Convenience Stores
As the lifestyle of Malaysian consumers becomes more hectic, they are
demanding more convenience-oriented retailing to the benefit of convenience
21
stores. Malaysians are increasingly switching their spending patterns from
traditional grocery stores to modern convenience stores. Consumers are
patronizing convenience stores largely due to the longer opening hours, as
well as the wide range of products and services offered at fair prices.
Convenience stores registered strong growth, largely due to vigorous
expansion in terms of outlets by chained and independent players, coupled
with promotions by chained convenience store operators. According to
Euromonitor (2008), the sales in the convenience stores grew 168 percent
between 2002 and 2007, and it has predicted that it will grow another 55.2
percent in the following five years.
The convenience store market is dominated by 7-Eleven, which is the largest
24 hours convenience store available in Malaysia. It captured almost half of
the convenience store value share in 2007. This is largely due to steady outlet
expansion as well as the creation of greater brand awareness through strong
marketing efforts, such as contests and promotions. For instance, the
company spent around RM1 million on advertising and promotions for one of
the promotions ―Balik Kampung Bonanze contest‖ in 2007.
The positioning of 7-Eleven is to supply essential products at anytime and
anywhere the consumer wants it. In contrast, competitors such as KK Mart
and 99-Speedmart have a low price positioning and tend to be located in
neighbourhood areas. All these players offer a wider range of products at fair
prices in order to compete with others grocery retailers. Besides selling
22
impulse products such as tobacco, ice cream, bread, snacks, and non-
alcoholic drinks, high value products such as rice, baby milk formula and
disposable products are also appearing in some of the convenience stores
such as 99 Speedmart and KK Mart,
2.4 Conclusion
This chapter explains the retailing industry in Malaysia. Four main channels
(hypermarket, supermarket, convenience store and traditional store) found in
Malaysia have been identified and discussed. In the following chapter, the
relevant literature will be reviewed.
23
CHAPTER 3 - LITERATURE REVIEW
Substantial research has been conducted in relation to the retailing field. This
chapter will review the literature that is related to this study. The chapter starts
with an introduction to consumer behaviour in the grocery industry. It is
followed by store image, customer satisfaction and store loyalty. Finally, the
relationship of store image, customer satisfaction and store loyalty is
discussed.
3.1 Consumer Behaviour in the Grocery Industry
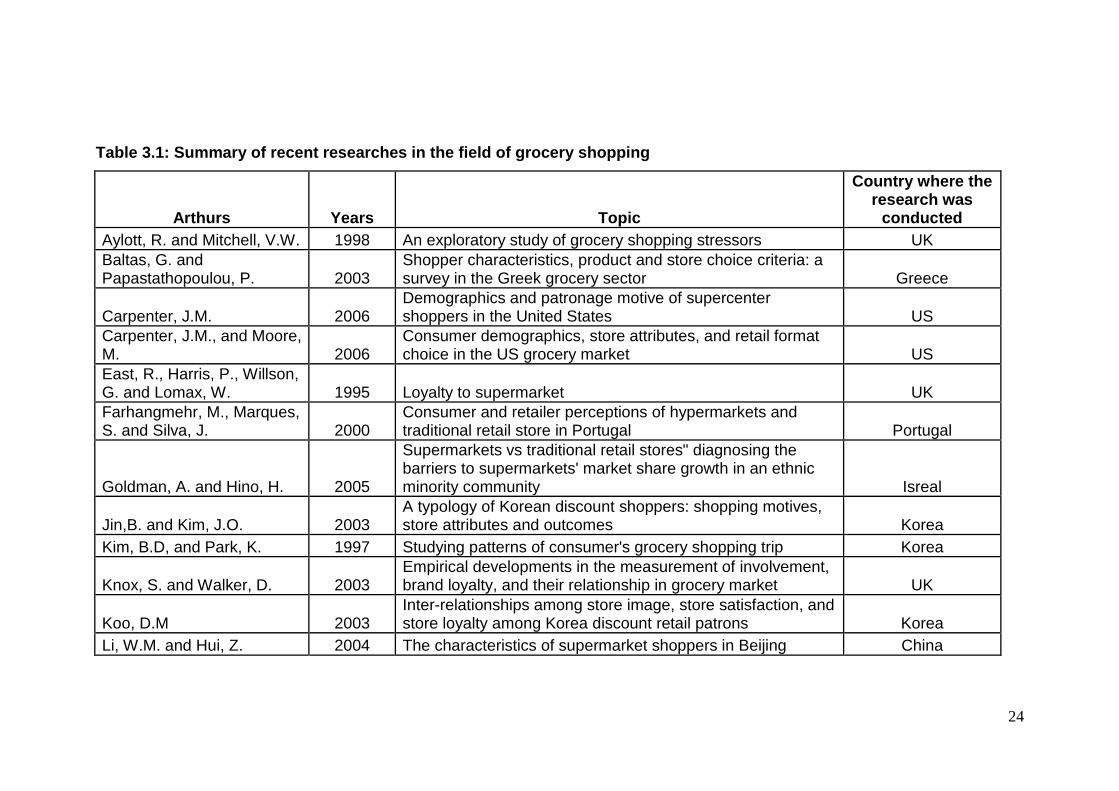
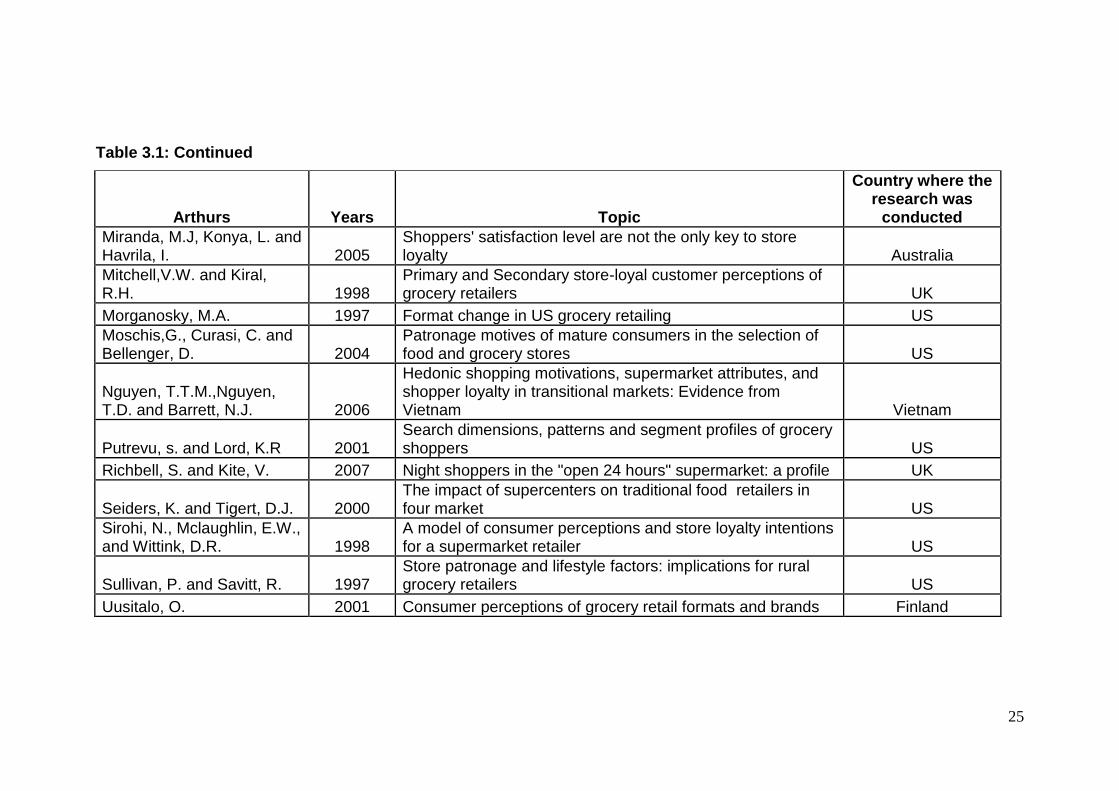
Numerous researches have been conducted in the field of grocery industry to
understand consumer behaviour. Table 3.1 summarize the relevant research
in the field of grocery in the past two decades.
In the process of evaluating which stores to patronise, consumers consider a
variety of factors, often referred to in the retailing literature as store choice
evaluative criteria. The central issue for retailers is, therefore, ―choice‖. As the
outcome of the choice can only be known in the future (after using the store),
it is important for retailers to understand how consumers make decisions.
According to Hawkin et al (2007), there are five steps in the consumer
decision process, which consist of a sequence of activities: problem
recognition, information search, alternative evaluation and selection, outlet
selection and purchase, and post-purchase processes. In the process, outlet
selection is obviously the most important to the retailers. Retailers will want to
know the attributes that will affect the consumer‘s store selection. Thus, many
24
Table 3.1: Summary of recent researches in the field of grocery shopping
Arthurs Years Topic
Country where the research was
conducted
Aylott, R. and Mitchell, V.W. 1998 An exploratory study of grocery shopping stressors UK
Baltas, G. and Papastathopoulou, P. 2003
Shopper characteristics, product and store choice criteria: a survey in the Greek grocery sector Greece
Carpenter, J.M. 2006 Demographics and patronage motive of supercenter shoppers in the United States US
Carpenter, J.M., and Moore, M. 2006
Consumer demographics, store attributes, and retail format choice in the US grocery market US
East, R., Harris, P., Willson, G. and Lomax, W. 1995 Loyalty to supermarket UK
Farhangmehr, M., Marques, S. and Silva, J. 2000
Consumer and retailer perceptions of hypermarkets and traditional retail store in Portugal Portugal
Goldman, A. and Hino, H. 2005
Supermarkets vs traditional retail stores" diagnosing the barriers to supermarkets' market share growth in an ethnic minority community Isreal
Jin,B. and Kim, J.O. 2003 A typology of Korean discount shoppers: shopping motives, store attributes and outcomes Korea
Kim, B.D, and Park, K. 1997 Studying patterns of consumer's grocery shopping trip Korea
Knox, S. and Walker, D. 2003 Empirical developments in the measurement of involvement, brand loyalty, and their relationship in grocery market UK
Koo, D.M 2003 Inter-relationships among store image, store satisfaction, and store loyalty among Korea discount retail patrons Korea
Li, W.M. and Hui, Z. 2004 The characteristics of supermarket shoppers in Beijing China
25
Table 3.1: Continued
Arthurs Years Topic
Country where the research was
conducted
Miranda, M.J, Konya, L. and Havrila, I. 2005
Shoppers' satisfaction level are not the only key to store loyalty Australia
Mitchell,V.W. and Kiral, R.H. 1998
Primary and Secondary store-loyal customer perceptions of grocery retailers UK
Morganosky, M.A. 1997 Format change in US grocery retailing US
Moschis,G., Curasi, C. and Bellenger, D. 2004
Patronage motives of mature consumers in the selection of food and grocery stores US
Nguyen, T.T.M.,Nguyen, T.D. and Barrett, N.J. 2006
Hedonic shopping motivations, supermarket attributes, and shopper loyalty in transitional markets: Evidence from Vietnam Vietnam
Putrevu, s. and Lord, K.R 2001 Search dimensions, patterns and segment profiles of grocery shoppers US
Richbell, S. and Kite, V. 2007 Night shoppers in the "open 24 hours" supermarket: a profile UK
Seiders, K. and Tigert, D.J. 2000 The impact of supercenters on traditional food retailers in four market US
Sirohi, N., Mclaughlin, E.W., and Wittink, D.R. 1998
A model of consumer perceptions and store loyalty intentions for a supermarket retailer US
Sullivan, P. and Savitt, R. 1997 Store patronage and lifestyle factors: implications for rural grocery retailers US
Uusitalo, O. 2001 Consumer perceptions of grocery retail formats and brands Finland

26
retailers have used attributes as a marketing tool to attract consumers to the
store. Researchers have also started to study the effect of store image or
attributes in the grocery industry (Seiders and Tigert, 2000; Jin and Kim,
2003; Koo, 2003; Carpenter and Moore, 2006; Nguyen et al, 2006).
The retailers or marketers‘ job does not end with the consumers‘ decision to
shop at the store. It is important for the retailers to continue to monitor
consumers‘ post-purchase behaviour such as satisfaction level, which will
eventually lead to his or her subsequent behaviour, such as willingness to re-
patronize the store, or become a loyal, committed customer. Thus, some
studies also study the relationship of store attributes, customer satisfaction
and store loyalty (Blomer, Ruyter, 1998; Doreen and Benjamin, 2003; Koo,
2003; Nguyen et al, 2006).
3.2 Store Image
Store image, has been used interchangeably with attitude towards the store to
describe the overall impression a consumer has of it (Farhangmehr et al,
2000). It is the way in which the store is defined in the shopper‘s mind, based
on its functional qualities and psychological attributes (Martineau, 1958).
Store images are not only formed because of the advertising and promotion
efforts of the company, but also include all tangible and intangible attributes
such as merchandise selection, store layout, sense of belonging, and feeling
towards the store. A unique store image is one of the retailer‘s most valuable
marketing assets, as it will help to create a competitive advantage that is not
easily duplicated by its competitors.
27
The importance of studying image is based on the assumption that the store
processing the most congruent attributes with the image preferred by the
consumer will have a better chance of being selected and patronised
(Martineau, 1958). The consumers will only choose to shop at the store if they
perceive the store has the same image desired by them. However, store
image or attributes cannot be determined unless the store dimension is
important to the consumers and there is a noticeable difference across the
chain (Seiders and Tigert, 2000).
However, Lindquist (1974-1975) emphasizes that store image is complex as it
consists of everything that people associate with the store. This is because
image is formed through personal experience with the store and it can be
modified over time. Not only will different consumers perceive the importance
of store attributes differently, but they will also have different perceptions of
the store even if they visit the store at the same time. Consumers will be more
likely to shop at the store when they have a favourable perception of the store
image or attributes. Thus, market segmentation is important in building store
image, and the retail store image should be based upon the priorities of the
store target market (Ortinau and Robert, 1989). In order for a retailer to
sustain itself in this competitive market, they must use those attributes that
can drive the store choice process for at least one major market segment.
3.3 Store Attributes
As mentioned earlier, store attributes are viewed as part of the overall image
of the store. Attributes are those factors that characterize a product or service,
28
what the consumer thinks of the product or service, and what is involved with
its purchase or consumption (Koo, 2003). Past literature has presented
various and varying conceptualizations of store attributes. By summarizing the
key image dimensions of 26 scholars and 19 separate researches from the
field of retail image, Lindquist (1974-1975) determined nine key attributes:
merchandise, services, clientele, physical facilities, convenience, promotion,
store ambience, and institutional factor satisfaction.
On the other hand, Koo (2003) proposes seven components: store
atmosphere, location, convenience facilities, value, employee services, after
sales service, and merchandising, which are important for the formation of
store image. Based on Lindquist and Koo‘s studies, Nguyen et al (2007) also
proposes four components: facilities, employee services, after sales service
and merchandise. Engel et al (1993) also identifies seven store
characteristics: location, assortment breadth and depth, services, store
personnel, price, advertising and sales promotion, and proximity to work.
As can be seen, researchers conceptualize the store images based on
various dimensions. The following section will explain some of the attributes
in detail.
3.3.1 Location
The location of a store is important to the type of customer that the retailers
want to attract. Clarkson et al (1996) and Wood and Browne (2007) focussed
on the conceptualization of techniques for determining the optimal location
29
and sales of the stores. Both studies conclude that location is the most
important decision that a company has to make, as it is the critical factor for
success.
A few researchers found that store location plays an important part in
determining the store choice (Kolodinsky and Cranwell, 2000; Fox et al, 2004;
Singh, et al, 2004). Location suggests customers‘ accessibility to the store
and includes factors such as distance, and time travelled to the store. It was
found that consumers prefer to shop at stores that they have easy access to
and are convenient for them (Fox et al, 2004; Moschis et al, 2004). Thus,
time sensitive shoppers are more willing to shop at drug stores compared to
other formats (Fox et al, 2004).
3.3.2 Products
A number of researchers also examined product assortment issues, as the
products offered in a store are one of the most important attributes that will
attract customers. Morganosky (1997), Seiders and Tigert (2000) and
Carpenter (2008), found that consumer preferences are affected by the
perception of variety within a selection and the store itself. Thus, more and
more retailers are opening new stores with a large footprint in order to be able
to offer a wide variety in their product range. This is because retailers are
afraid that shoppers will be less likely to shop in the store if they feel that the
store has less of a product range compared to others.

30
Besides merchandising assortment, some researchers also found that the
arrangement of the products, the repetition of items, and the availability of
consumers‘ favourite or alternative items will also affect consumers‘
perception of product assortments (Kahn and Lehmann, 1991; Broniarcyzk,
1998; Hoch et al, 1999). Thus, large scale retailers in the form of
hypermarkets, discount stores and supercentres have been very successful
because consumers place importance on the ability to take care of as many
shopping needs as possible when visiting the same store (Carpenter, 2008).
3.3.3 Price
Pricing is a relevant issue to customers as well as for retailers. Bell and Lattin
(1998) describe how pricing strategy is viewed consistently by store managers
as one of the top five priorities in retail management, and how supermarket
retailers are actively engaged in formulating pricing strategies to attract the
consumers to visit their store.
Bell and Lattin (1998) determined two types of pricing strategy (everyday low
price across a wide assortment of product, and temporary deep discount in
certain product categories), which are said to be used by most the
supermarket operators. Consumers will decide which store to go to based on
the pricing strategy and their expected expenditure. Thus, it is important to get
the pricing strategy right. For example, consumers who intend to make large
expenditures prefer to shop at stores that offer ―everyday low price‖, while
small expenditure shoppers will shop at the stores that offer temporary deep
31
discount. This finding was supported by Singh et al (2004), who found that
large basket buyers are more likely to choose the everyday low price strategy.
Price is a very important attribute for consumers, as it is a common and
salient product attribute for most consumers in any purchase decision (Desai
and Talukdar, 2003). Thus, researchers have investigated how consumers
form their perceptions in response to various types of retail pricing and price
related promotion strategies (Lichtenstein et al 1993; Alba et al, 1999; Monroe
and Lee, 1999). Lichtenstein et al (1993) found that consumer perception of
price can influence purchasing behaviour positively or negatively. People are
willing to pay a high price for a product when they perceive price in a positive
role, such as premium price represents prestige, status or high quality. On the
other hand, consumers who perceive price negatively tend to respond to low
price and sales promotion. They are not concerned with the quality they will
get with the price they pay (Moore and Carpenter, 2008).
3.3.4 Promotion
Sales promotions are recognized as a viable competitive weapon for
marketers, with companies investing up to one quarter of the marketing
budget towards promotion efforts (Raghubir et al, 2004). It was found that
promotion will help to build patronage and store traffic (Carpenter and Moore,
2008; Ruiz and Descals, 2008), temporarily increase sales of the promoted
brands (Blatterb et al, 1995), and affect sales of other items (Kumar and
Leonne, 1988; Sivakumar, 2003; Ruiz and Descales, 2008). However,
Martinez and Montaner (2006) found that not all consumers have the same
32
response to sales promotion. Thus, it is important for the marketers to know
which type of promotion can draw the attention of their target segment.
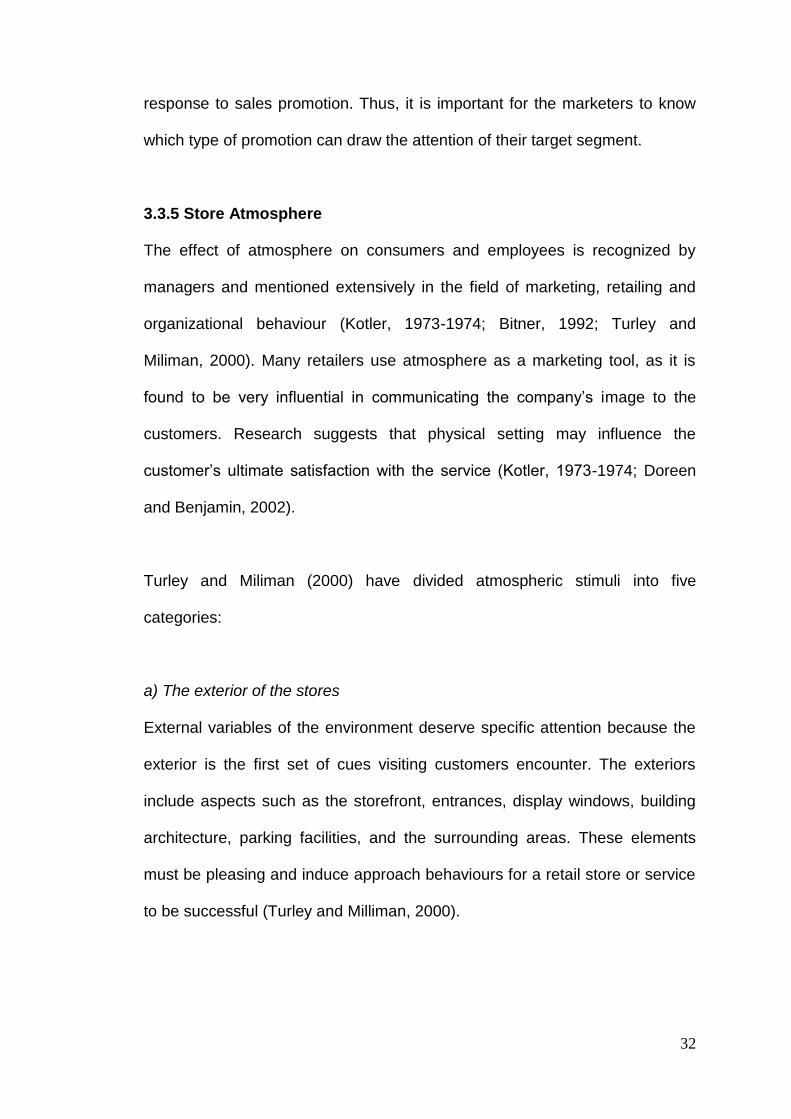
3.3.5 Store Atmosphere
The effect of atmosphere on consumers and employees is recognized by
managers and mentioned extensively in the field of marketing, retailing and
organizational behaviour (Kotler, 1973-1974; Bitner, 1992; Turley and
Miliman, 2000). Many retailers use atmosphere as a marketing tool, as it is
found to be very influential in communicating the company‘s image to the
customers. Research suggests that physical setting may influence the
customer‘s ultimate satisfaction with the service (Kotler, 1973-1974; Doreen
and Benjamin, 2002).
Turley and Miliman (2000) have divided atmospheric stimuli into five
categories:
a) The exterior of the stores
External variables of the environment deserve specific attention because the
exterior is the first set of cues visiting customers encounter. The exteriors
include aspects such as the storefront, entrances, display windows, building
architecture, parking facilities, and the surrounding areas. These elements
must be pleasing and induce approach behaviours for a retail store or service
to be successful (Turley and Milliman, 2000).
33
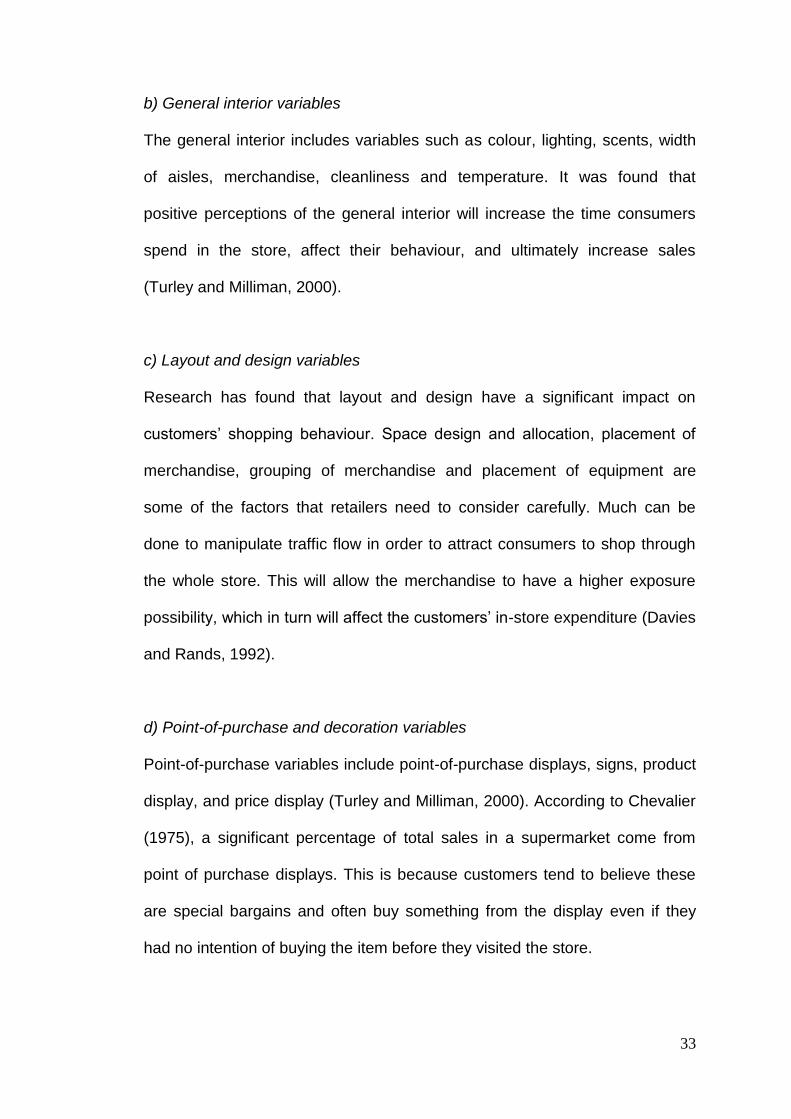
b) General interior variables
The general interior includes variables such as colour, lighting, scents, width
of aisles, merchandise, cleanliness and temperature. It was found that
positive perceptions of the general interior will increase the time consumers
spend in the store, affect their behaviour, and ultimately increase sales
(Turley and Milliman, 2000).
c) Layout and design variables
Research has found that layout and design have a significant impact on
customers‘ shopping behaviour. Space design and allocation, placement of
merchandise, grouping of merchandise and placement of equipment are
some of the factors that retailers need to consider carefully. Much can be
done to manipulate traffic flow in order to attract consumers to shop through
the whole store. This will allow the merchandise to have a higher exposure
possibility, which in turn will affect the customers‘ in-store expenditure (Davies
and Rands, 1992).
d) Point-of-purchase and decoration variables
Point-of-purchase variables include point-of-purchase displays, signs, product
display, and price display (Turley and Milliman, 2000). According to Chevalier
(1975), a significant percentage of total sales in a supermarket come from
point of purchase displays. This is because customers tend to believe these
are special bargains and often buy something from the display even if they
had no intention of buying the item before they visited the store.
34
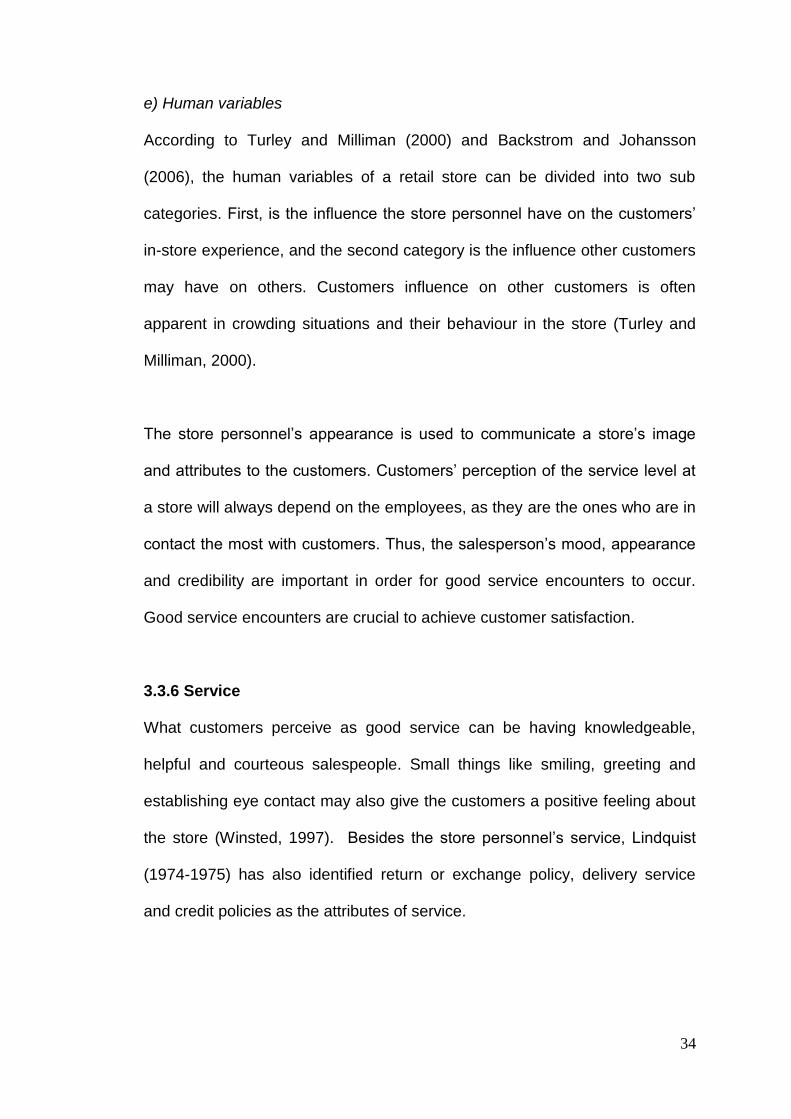
e) Human variables
According to Turley and Milliman (2000) and Backstrom and Johansson
(2006), the human variables of a retail store can be divided into two sub
categories. First, is the influence the store personnel have on the customers‘
in-store experience, and the second category is the influence other customers
may have on others. Customers influence on other customers is often
apparent in crowding situations and their behaviour in the store (Turley and
Milliman, 2000).
The store personnel‘s appearance is used to communicate a store‘s image
and attributes to the customers. Customers‘ perception of the service level at
a store will always depend on the employees, as they are the ones who are in
contact the most with customers. Thus, the salesperson‘s mood, appearance
and credibility are important in order for good service encounters to occur.
Good service encounters are crucial to achieve customer satisfaction.
3.3.6 Service
What customers perceive as good service can be having knowledgeable,
helpful and courteous salespeople. Small things like smiling, greeting and
establishing eye contact may also give the customers a positive feeling about
the store (Winsted, 1997). Besides the store personnel‘s service, Lindquist
(1974-1975) has also identified return or exchange policy, delivery service
and credit policies as the attributes of service.

35
It is difficult to determine the service quality, as it is through personal
experience with the store. However, Wisniewski (2001) has identified service
quality as the difference between customer expectation of service and
perceived service. Thus, if the expectation is greater than performance, then
perceived quality is less than satisfactory and, hence, customer dissatisfaction
occurs.
3.4 Customer Satisfaction
Consumer satisfaction is central to the marketing concept. Hutches and
Moutinho (1998) mention that successful companies view customer
satisfaction as an important profit stimulant, a powerful competitive defence
and a tool of differentiation. Satisfaction is also found to influence consumer‘s
subsequent behaviour, such as turn the consumer into a loyal, committed
customer, one who is willing to repurchase, or a customer who switches
brands or discontinues using the product (Kotler and Keller, 2006; Hawkin et
al, 2007).
Satisfaction is defined as a person‘s feeling of pleasure or disappointment
resulting from comparing a product‘s perceived performances and the
expectation (Kotler and Keller, 2006). It is derived from the consumer‘s
personal experiences and is the function of matching the expectation and the
perceived performance. The smaller the gap between the level of expectation
and the matching of such expectation, the greater the level of satisfaction
experienced by consumers and vice versa. For instance, if the performance
falls below expectations, consumers will be disappointed or dissatisfied with
36
the product; if it meets their expectations, the consumers will be satisfied; if it
exceeds expectations, the consumers will be delighted.
Swan and Trawick (1981) have used the disconfirmation-expectation model to
determine consumer satisfaction in a retail environment. According to them,
this model comprises four important steps. The process starts with the
consumer‘s predetermined expectations, which are the beliefs that the store
will achieve certain performance levels based on a set of attributes. In the
second step, the consumer will compare their expectation with the
performance of the attributes when they shop at the store. Expectations are
thus either positively disconfirmed (performance exceeds expectations),
confirmed (performance meets expectations), or negatively disconfirmed
(performance falls below expectations). In the following step, perceived
disconfirmation determines the consumer satisfaction level with the store. In
the last step, consumers will determine the subsequent behaviour, such as
the re-patronise intention.
According to the buying decision process model, satisfaction plays an
important role in the last step of the decision making – post-purchase
behaviour (Kotler and Keller, 2006; Hawkin et al, 2007). It will make a
difference in whether the consumer will buy the product again and talk
favourably or unfavourably about it to others. If the consumers are satisfied,
they will have a higher probability of purchasing the product again and
recommend it to others. On the other hand, dissatisfied consumers may stop
37
using the product and switch to the competitors. In addition, the dissatisfied
consumer may complain or initiate negative word of mouth communication.
Generally, a grocery store is selected because it is thought to be a better
choice compared to the available substitutes. Whether that store is chosen
due to its superior performance or for other reasons, the consumer has a level
of expectation for it. While shopping at the store, the consumer will evaluate
the performance based on their predetermined expectation. The perceived
performance level could meet the expectation, be above the expectation, or
below the expectation. If the store is able to meet or exceed the shopper‘s
expectation, it will be likely that the shopper will shop at the store again.
However, if the shopper perceives that the performance level is below the
expectation, the shopper might not be willing to shop at the store again and
will shop at other stores. Thus, it is important for the marketer to know the
attributes that consumers perceive as important, which will affect the
satisfaction evaluation process.
3.5 Customer Loyalty
The ultimate goal of any company is to establish a loyal and profitable
customer base in order to ensure future profits and longevity of the business.
Given that increased competition has provided the consumers with more store
choices, what is important now is the way in which the retailer is able to
encourage consumers to visit the store again or turn them into a loyal
customer. Bloemer and Ruyter (1997) suggest that there is a difference
between repeat purchasing behaviour and loyalty.
38
Repeat purchasers are important for the company, but mere repeat
purchasers without any feeling for the brand are a threat to the company.
These consumers purchase the brand out of habit or are affected by other
factors such as it is easily available, or the store located near to the house
only has this brand. These customers are said to have no commitment to the
brand and can easily switch their mind to buy other brands. Bloemer and
Ruyter (1997) mentioned that commitment is important and is a necessary
condition for loyalty to occur. If the customers are not loyal to the brand, they
will easily decide to buy other brands at will or be attracted away by
competitors through certain attributes such as promotion or pricing strategies.
Thus, Oliver (1999, p34) defines loyalty as:
―A deeply held commitment to rebuy or repatronize a preferred product
or service consistently in the future, thereby causing repetitive same-
brand or same brand-set purchasing, despite situational influences and
marketing efforts having the potential to cause switching behaviour‖.
Chaudhuri and Hoibrook (2001) mentioned that the above definition
emphasizes two different aspects of loyalty concept – attitudinal and
behavioural – which have been used in much of the literature. The
behavioural approach conceptualizes loyalty in terms of repeated purchase,
whereas the attitudinal approach posits that loyalty is based on psychological
commitment towards the brand. A consumer is defined as loyal to the brand
he names in response to the question which brand he or she prefers. It is
expected that an increase in attitudinal loyalty will lead to an increase in
behavioural loyalty. For example, for a consumer who has developed a strong
39
emotional tie with a brand leads to greater commitment in the form of
attitudinal loyalty and willingness to repurchase the brand as well as initiate
positive word of mouth communication and recommend it to others.
There is no doubt that a loyal customer base is a competitive asset to any
company. This is because customer loyalty is a key determinant in greater
market share and profitability (Chaudhuri and Hoibrook, 2001). Loyal
customers will continue buying and using the brand again, and it is found that
they will recommend it to others (Kotler and Keller, 2006). Besides that,
retaining existing customers also requires less marketing resources than
recruiting new ones (Koo, 2003; Grace and Cass, 2005).
3.5.1 Store Loyalty
As mentioned earlier, although consumers have changed their store choice
decision by shopping at the new retail format, no research found that
consumers want to rely on a single format for their shopping needs. This
indicates that the shoppers are relying on multiple retail formats to
accommodate their lifestyles and to meet their shopping needs. Thus, it is
difficult to measure consumer loyalty in the retailing concept as it is unlikely
that shoppers only visit one particular store.
Woodside and Trappey (1992) found that although consumers often patronise
various stores, they do have a primary affiliation to a ―main store‖ that
captures the majority of their purchases. Rhee and Dell (2002) also found that
loyal customers would re-patronise and spend a larger budget at the store
40
even though they shop at other places as well. Therefore, some researchers
have defined store loyalty based on the expenditure by the household in the
most preferred store. According to Cunningham (1961), the single store which
has the highest proportion of the household‘s expenditure is identified as their
first or favourite store. In other words, the store loyalty is a measure based on
the consumer‘s expenditure in the store where most money is spent (the first
or favourite store) divided by the total consumer expenditure in the particular
retail category.
3.6 The relationship between store attributes, customer satisfaction and
store loyalty
Most previous studies in retailing suggest that consumer‘s behaviour towards
a store depends on the store attributes (Linquist, 1974-1975; Hansen and
Deutcher, 1977/1978; Westbrook, 1981; Osman, 2001; Doreen and Benjamin,
2003; Koo, 2003; Nguyen et al, 2007). Generally, the more favourable
towards the store image, the higher the chance that the store will be preferred
and visited by the consumers. However, some of the attributes may weigh
more heavily than others in influencing store choice decision. Thus, some
store attributes are more important than others when consumers are deciding
where to shop.
Numerous research has been conducted to examine the impact of store
attributes on customer loyalty (Bloemer and Ruyter, 1998; Osman, 2001; Koo,
2003; Nguyen et al, 2007). Most of the studies found that store attributes have
a positive impact on store loyalty. It is found that the loyalty towards the store
41
is affected by the consumer‘s in store experience with the characteristics of
the store. In other words it is important for the shopper to notice and pay
attention to the attributes, in order to influence their subsequent behaviour
such as re-patronage behaviour. However, a study by Bloemer and Ruyter
(1998) found that store image does not directly influence store loyalty.
Instead, the study suggests that the relationship of store image and store
loyalty is mediated by store satisfaction.
Although most of the previous studies investigated the relationship of store
attributes and customer loyalty in a retail setting, Westbrook (1981) studied
the effect of store attributes from a different perspective. Westbrook examined
the relationship of store attributes and customer satisfaction. The study found
that customer satisfaction is directly affected by their in store experience with
the store characteristics. However, Koo (2003) found that only certain store
attributes (store atmosphere and value) have a positive impact on store
satisfaction.
On the other hand, Oliver (1999) finds that satisfaction is a necessary step in
loyalty formulation. Satisfaction is often regarded as an antecedent of loyalty.
It is found that the re-patronise intention will increase when the consumer
satisfaction increases (Swan and Trawick, 1981; Grace and Cass, 2005).
However, Koo (2003) found that satisfaction has an insignificant positive
effect on store loyalty in the discount retail channel. So, it is worthwhile to
investigate whether satisfaction has a positive impact on store loyalty.

42
3.7 Conclusion
This chapter discusses the relevant literature. Three main topics (store image,
customer satisfaction and store loyalty) are discussed. Besides that, the
relationship of store image, customer satisfaction and store loyalty are also
presented.
In Chapter 4, the discussion will be on the method used in conducting the
research, which includes the research framework, development of hypothesis,
research instruments, sampling and survey method, questionnaire design and
data analysis method.
43
CHAPTER 4- RESEARCH METHODOLOGY
This chapter outlines the methodology employed in the study. It begins with a
review of the research framework. Then, it provides the hypotheses
developed in this study. Thereafter, the design of the research instrument,
scales and measurements, and the data collection procedure will be
discussed. Finally, the data analysis techniques used are also presented.
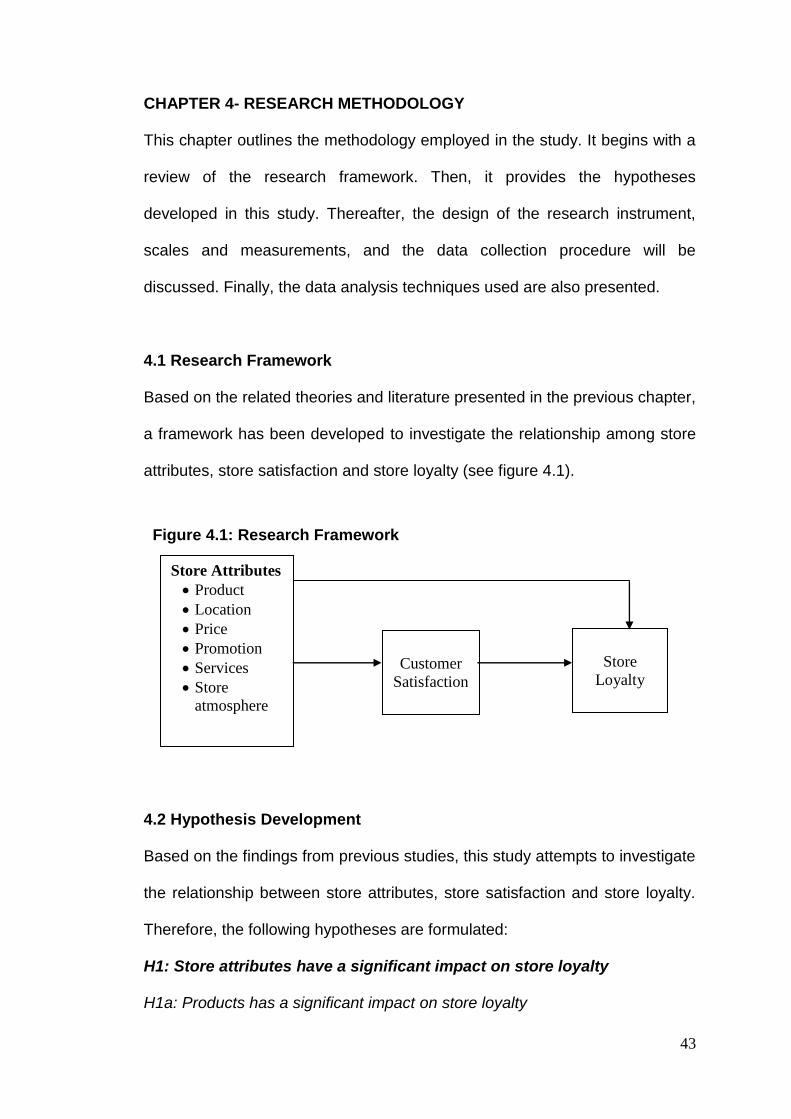
4.1 Research Framework
Based on the related theories and literature presented in the previous chapter,
a framework has been developed to investigate the relationship among store
attributes, store satisfaction and store loyalty (see figure 4.1).
Figure 4.1: Research Framework
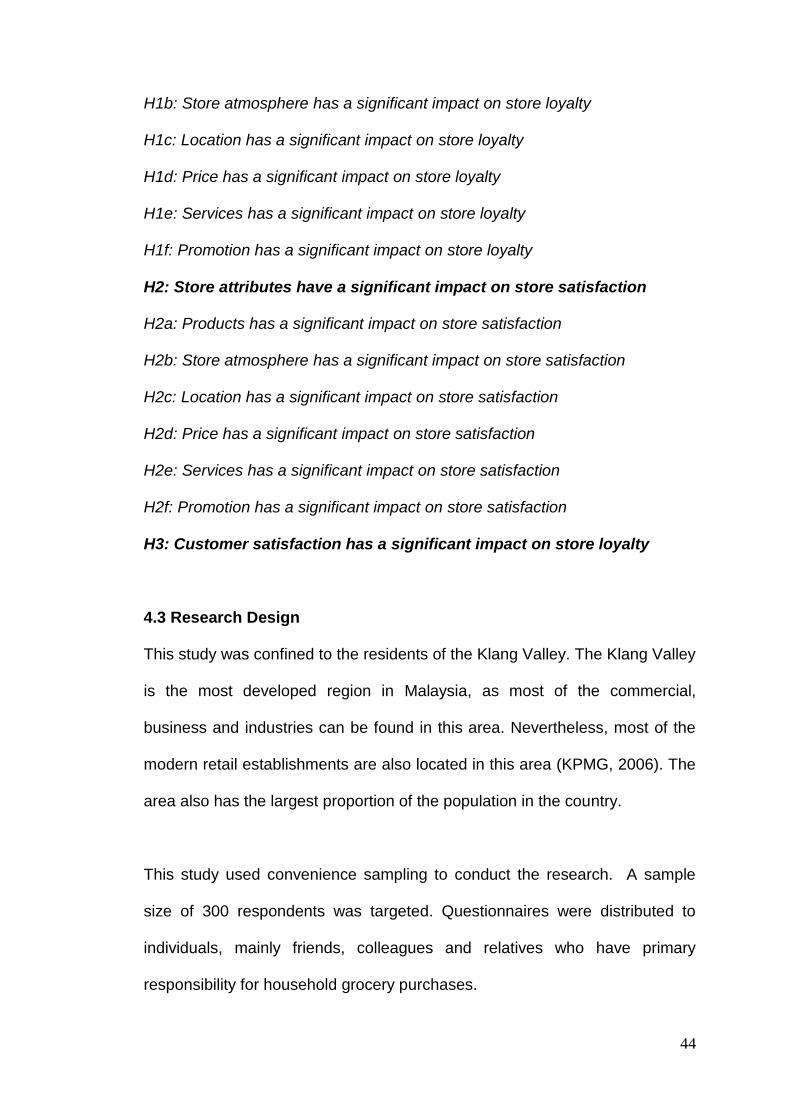
4.2 Hypothesis Development
Based on the findings from previous studies, this study attempts to investigate
the relationship between store attributes, store satisfaction and store loyalty.
Therefore, the following hypotheses are formulated:
H1: Store attributes have a significant impact on store loyalty
H1a: Products has a significant impact on store loyalty
Store Attributes
Product
Location
Price
Promotion
Services
Store
atmosphere
Customer
Satisfaction
Store
Loyalty
44
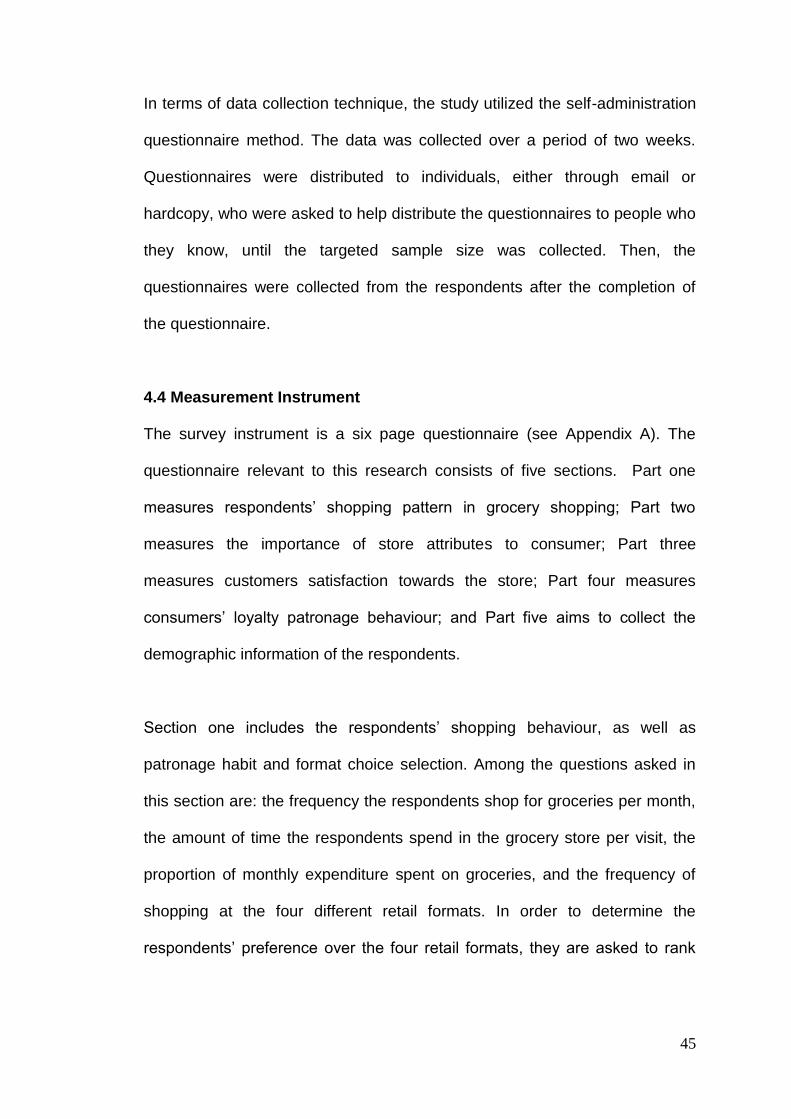
H1b: Store atmosphere has a significant impact on store loyalty
H1c: Location has a significant impact on store loyalty
H1d: Price has a significant impact on store loyalty
H1e: Services has a significant impact on store loyalty
H1f: Promotion has a significant impact on store loyalty
H2: Store attributes have a significant impact on store satisfaction
H2a: Products has a significant impact on store satisfaction
H2b: Store atmosphere has a significant impact on store satisfaction
H2c: Location has a significant impact on store satisfaction
H2d: Price has a significant impact on store satisfaction
H2e: Services has a significant impact on store satisfaction
H2f: Promotion has a significant impact on store satisfaction
H3: Customer satisfaction has a significant impact on store loyalty
4.3 Research Design
This study was confined to the residents of the Klang Valley. The Klang Valley
is the most developed region in Malaysia, as most of the commercial,
business and industries can be found in this area. Nevertheless, most of the
modern retail establishments are also located in this area (KPMG, 2006). The
area also has the largest proportion of the population in the country.
This study used convenience sampling to conduct the research. A sample
size of 300 respondents was targeted. Questionnaires were distributed to
individuals, mainly friends, colleagues and relatives who have primary
responsibility for household grocery purchases.
45
In terms of data collection technique, the study utilized the self-administration
questionnaire method. The data was collected over a period of two weeks.
Questionnaires were distributed to individuals, either through email or
hardcopy, who were asked to help distribute the questionnaires to people who
they know, until the targeted sample size was collected. Then, the
questionnaires were collected from the respondents after the completion of
the questionnaire.
4.4 Measurement Instrument
The survey instrument is a six page questionnaire (see Appendix A). The
questionnaire relevant to this research consists of five sections. Part one
measures respondents‘ shopping pattern in grocery shopping; Part two
measures the importance of store attributes to consumer; Part three
measures customers satisfaction towards the store; Part four measures
consumers‘ loyalty patronage behaviour; and Part five aims to collect the
demographic information of the respondents.
Section one includes the respondents‘ shopping behaviour, as well as
patronage habit and format choice selection. Among the questions asked in
this section are: the frequency the respondents shop for groceries per month,
the amount of time the respondents spend in the grocery store per visit, the
proportion of monthly expenditure spent on groceries, and the frequency of
shopping at the four different retail formats. In order to determine the
respondents‘ preference over the four retail formats, they are asked to rank
46
the format choice according to their preference (1 being the most preferred
and 4 being the least preferred).
Consumer patronage habits are assessed in relation to four different grocery
formats: hypermarkets, supermarkets, convenience stores and traditional
grocery stores. In order to define the formats, respondents are given
examples of stores within each category. For example, hypermarkets refer to
Carrefour, Econsave Giant, or Tesco. Supermarkets included Iseten, Cold
Storage or Jusco.
In the second section, the questionnaire sought to measure the consumer‘s
perception towards the importance of store attributes. Thirty one items were
selected from numerous sources to examine the key attributes. These items
cover a variety of possible reasons that consumers choose to shop at the
store. Based on the literature, the thirty one items can be grouped into six
categories, which are product, store atmosphere, location, price, services and
promotion. Each category of the attribute consists of four to seven items. For
example, items included in the product attributes are ―the store has a variety
of product range‖, ―availability of well known brands‖, ―availability of your
favourite item‖, and ―the availability of alternative item if the favourite item is
not there‖. All of the items are measured on a five-point Likert-type scale,
ranging from ―Not Important at all‖ (1), ―Important‖ (2), ―Neutral‖ (3),
―Important‖ (4) and ―Extremely Important‖ (5).

47
Section three of the questionnaire measures customers‘ satisfaction towards
the store. Six items using a five-point Likert-type scale, ranging from ―strongly
disagree‖ (1), ―disagree‖ (2), ―neutral‖ (3), ―agree‖ (4) and ‗strongly agree‖ (5)
are used. The items in this section were taken from Debra and Cass (2005);
and Koo (2003). Three items were derived from the study of Koo (2003), and
another three items were derived from the study of Debra and Cass (2005).
The fourth section was designed to measure consumer loyalty towards the
store. Five items using a five-point Likert-type scale, ranging from ―strongly
disagree‖ (1), ―disagree‖ (2), ―neutral‖ (3), ―agree‖ (4) and ‗strongly agree‖ (5)
were used. The items in this section originated from Koo (2003). Koo used
two different variables to measure store loyalty – consumer commitment and
revisit intention. However, this study has combined it as a single variable.
The last section was designed to collect the demographic information of the
respondents. Examples of the demographic variables measured include
gender, ethnicity, age, marital status, occupation, education level, income and
household size. The demographic variables were measured using the closed-
ended multiple choice format.
4.5 Data Analysis Techniques
Statistical analysis of the data collected from the survey was accomplished
using the statistical package for social sciences—SPSS version 15.0
software. Data was first entered into the software and was then screened to
48
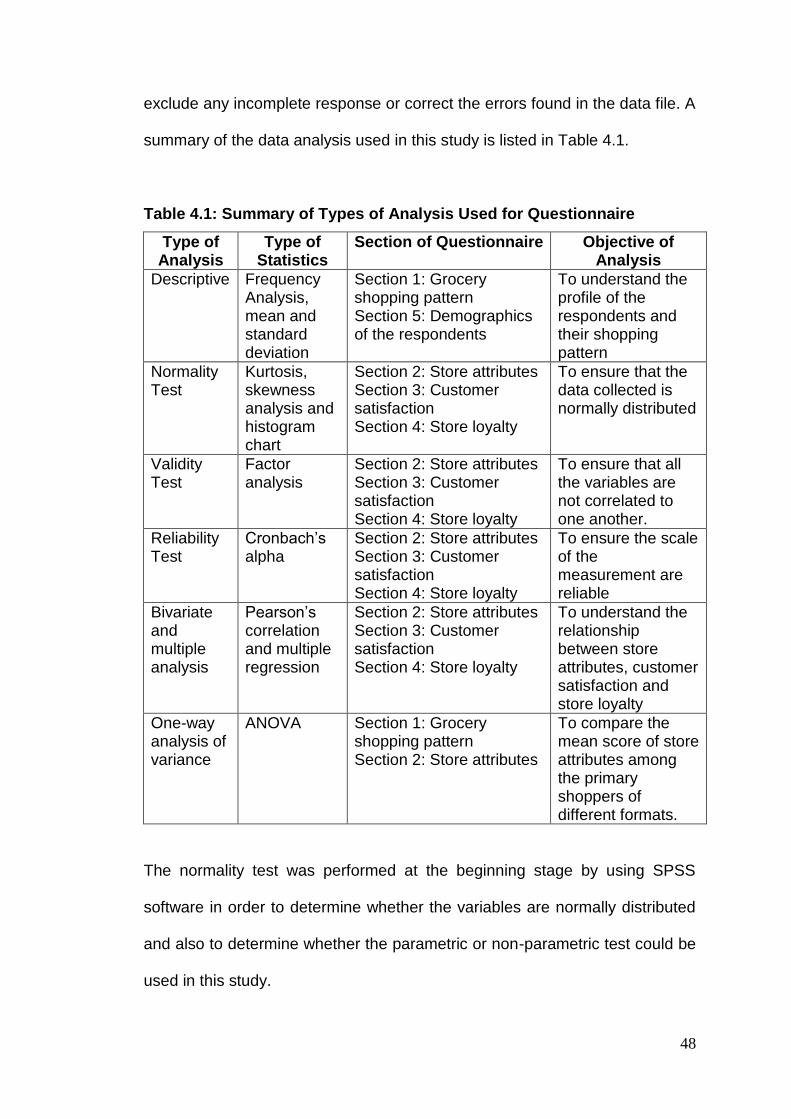
exclude any incomplete response or correct the errors found in the data file. A
summary of the data analysis used in this study is listed in Table 4.1.
Table 4.1: Summary of Types of Analysis Used for Questionnaire
Type of Analysis
Type of Statistics
Section of Questionnaire Objective of Analysis
Descriptive Frequency Analysis, mean and standard deviation
Section 1: Grocery shopping pattern Section 5: Demographics of the respondents
To understand the profile of the respondents and their shopping pattern
Normality Test
Kurtosis, skewness analysis and histogram chart
Section 2: Store attributes Section 3: Customer satisfaction Section 4: Store loyalty
To ensure that the data collected is normally distributed
Validity Test
Factor analysis
Section 2: Store attributes Section 3: Customer satisfaction Section 4: Store loyalty
To ensure that all the variables are not correlated to one another.
Reliability Test
Cronbach‘s alpha
Section 2: Store attributes Section 3: Customer satisfaction Section 4: Store loyalty
To ensure the scale of the measurement are reliable
Bivariate and multiple analysis
Pearson‘s correlation and multiple regression
Section 2: Store attributes Section 3: Customer satisfaction Section 4: Store loyalty
To understand the relationship between store attributes, customer satisfaction and store loyalty
One-way analysis of variance
ANOVA Section 1: Grocery shopping pattern Section 2: Store attributes
To compare the mean score of store attributes among the primary shoppers of different formats.
The normality test was performed at the beginning stage by using SPSS
software in order to determine whether the variables are normally distributed
and also to determine whether the parametric or non-parametric test could be
used in this study.
49
Factor analysis and Cronbach‘s Alpha were conducted to ensure that all the
variables are valid and reliable. This is to ensure that the variables are not
correlated with one another and the scale of measurement is reliable.
Regression analysis was performed in order to test the relationships of the
dependent variables and independent variables. In this study, simple linear
regression and multiple linear regressions with stepwise method was used.
Pearson correlation was used to evaluate the linear relationship between two
variables. On the other hand, multiple linear regressions were used to explore
the relationship between one dependent variable and a number of
independent variables.
ANOVA was used to compare the mean score of store attributes among the
primary shoppers of different formats. This is to understand the factors that
attract the primary shoppers to shop at the particular retail format.
4.6 Conclusion
This chapter provides an overview of the research design, framework and
hypothesis developed for the study. An overview of the questionnaire has also
been discussed. This chapter also discusses the research instrument,
sampling procedure, data collection and data analysis used to conduct the
study.
In the following chapter, the findings of the research will be discussed. It also
identifies the significance of each of the hypotheses as stated in the chapter.
50
CHAPTER 5 – DATA ANALYSIS
This chapter presents the findings of the survey. It begins with a description of
the general characteristics of the respondents. This is followed by an analysis
of the respondents shopping habits. The results of the validity and reliability
tests are also discussed, followed by a test on the hypotheses developed in
the previous chapter. After that, the effect of store attributes on consumer
behaviour is also discussed. Finally, the consumer preference structure of the
retail channel is also presented.
5.1 Demographic Profiles of Respondents
In the data collection process, 380 questionnaires were distributed to
acquaintances within the Klang Valley. However, only 343 questionnaires
were returned. This yielded a return rate of 90.3 percent. Out of which, 27 set
of questionnaires were rejected due to incomplete answers. As a result, the
final questionnaires analyzed consisted of 316 respondents, which yielded a
response rate of 83.2 percent.
Based on the data collected, a demographic profile of the respondents was
constructed. A completed profile of the respondents who participated in the
survey is presented in Table 5.1. Descriptive analysis was carried out in order
to understand the respondents‘ characteristics in number and percentage
form.
There were more females answering the questionnaire than males as 54.7 of
the respondents are female while 45.3 percent are male. In terms of ethnic
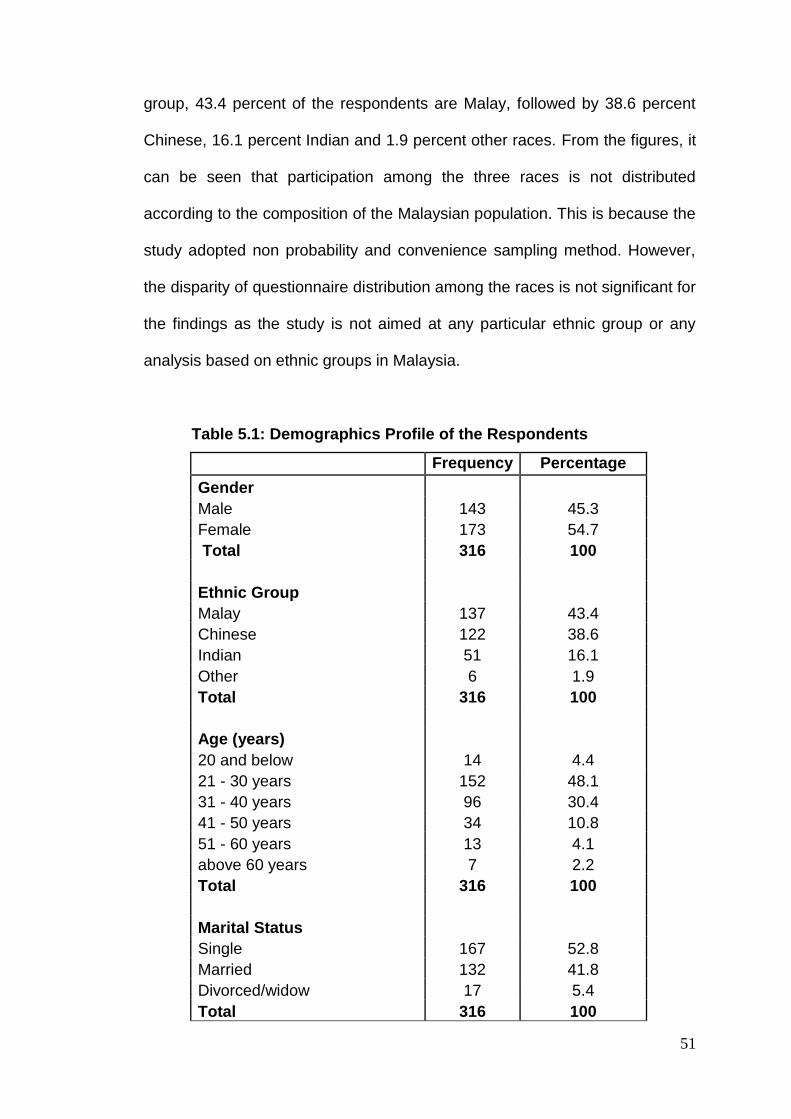
51
group, 43.4 percent of the respondents are Malay, followed by 38.6 percent
Chinese, 16.1 percent Indian and 1.9 percent other races. From the figures, it
can be seen that participation among the three races is not distributed
according to the composition of the Malaysian population. This is because the
study adopted non probability and convenience sampling method. However,
the disparity of questionnaire distribution among the races is not significant for
the findings as the study is not aimed at any particular ethnic group or any
analysis based on ethnic groups in Malaysia.
Table 5.1: Demographics Profile of the Respondents
Frequency Percentage
Gender Male 143 45.3
Female 173 54.7
Total 316 100
Ethnic Group Malay 137 43.4
Chinese 122 38.6
Indian 51 16.1
Other 6 1.9
Total 316 100
Age (years) 20 and below 14 4.4
21 - 30 years 152 48.1
31 - 40 years 96 30.4
41 - 50 years 34 10.8
51 - 60 years 13 4.1
above 60 years 7 2.2
Total 316 100
Marital Status Single 167 52.8
Married 132 41.8
Divorced/widow 17 5.4
Total 316 100
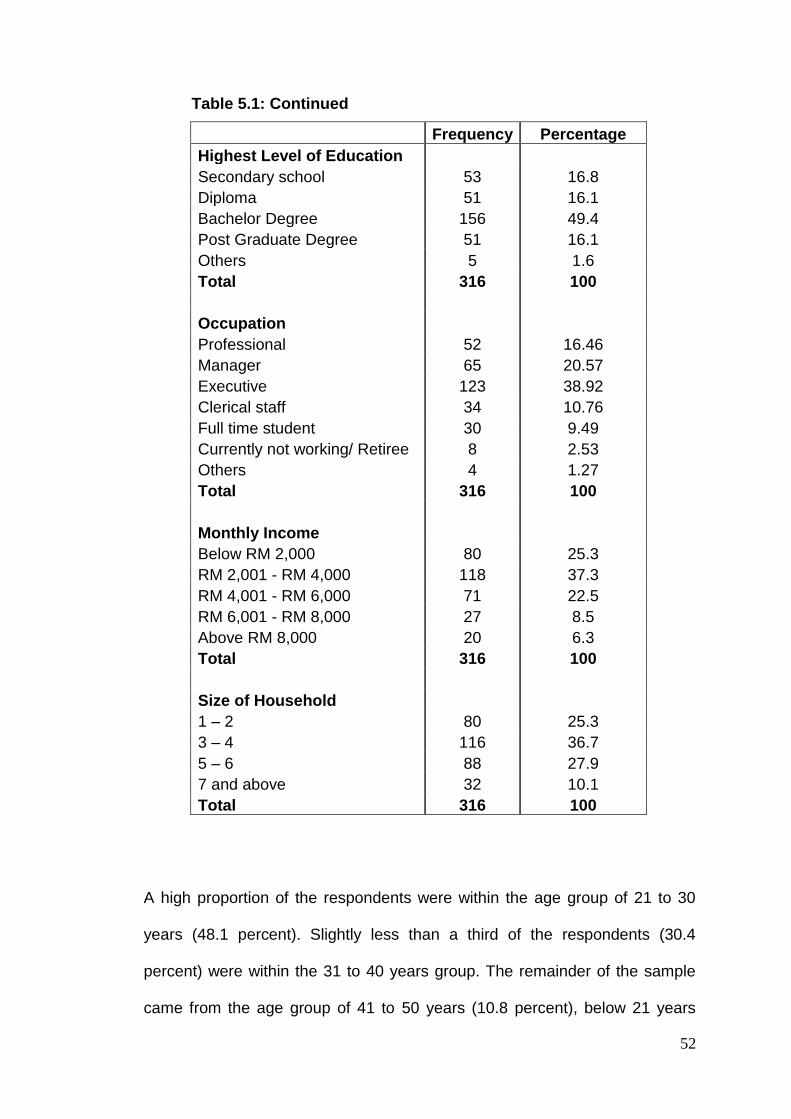
52
Table 5.1: Continued
Frequency Percentage
Highest Level of Education Secondary school 53 16.8
Diploma 51 16.1
Bachelor Degree 156 49.4
Post Graduate Degree 51 16.1
Others 5 1.6
Total 316 100
Occupation Professional 52 16.46
Manager 65 20.57
Executive 123 38.92
Clerical staff 34 10.76
Full time student 30 9.49
Currently not working/ Retiree 8 2.53
Others 4 1.27
Total 316 100
Monthly Income Below RM 2,000 80 25.3
RM 2,001 - RM 4,000 118 37.3
RM 4,001 - RM 6,000 71 22.5
RM 6,001 - RM 8,000 27 8.5
Above RM 8,000 20 6.3
Total 316 100
Size of Household 1 – 2 80 25.3
3 – 4 116 36.7
5 – 6 88 27.9
7 and above 32 10.1
Total 316 100
A high proportion of the respondents were within the age group of 21 to 30
years (48.1 percent). Slightly less than a third of the respondents (30.4
percent) were within the 31 to 40 years group. The remainder of the sample
came from the age group of 41 to 50 years (10.8 percent), below 21 years
53
(4.4 percent), 51 to 60 years (4.1 percent) and those above 60 years (2.2
percent). In terms of marital status, the largest group fell into the single
category, forming 52.8 percent of the sample. This was followed by 41.8
percent married respondents, while 5.4 percent of respondents were divorced
or widowed.
The education level of the respondents shows that most the people have
education up to college or university. About 49.4 percent of the sample were
bachelor degree holders. Another 16.8 percent were diploma holders, 16.8
percent were secondary school holders, and 16.1 were post graduate holders.
The main reason for the high proportion of the degree holders in the sample
was probably due to the characteristics of urban population.
As most of the respondents have a high education level, it is not surprising
that the results also show that most of them held high positions in their office.
About 38.9 percent of the respondents have acquired an executive position,
while 20.6 percent of the sample were at managerial level. Professional and
clerical staff constituted 16.5 percent and 9.5 percent of the sample,
respectively. Another 2.5 percent of the respondents were retired or
unemployed at the time of survey.
Statistics on the monthly personal income of the respondents show that a
large proportion of the respondents have an income in the range of RM2,001
to RM4,000 (37.3 percent). About one-fourth (25.3 percent) of the
respondents indicated that they have a monthly income of less than RM2,000,
54
while 22.5 percent reported figures in the range of RM4,001 to RM6,000.
Another 8.5 percent of the respondents said that they earned between
RM6,001 to RM8,000. The remaining 6.3 percent earn more than RM8,000
per month.
In terms of size of household, the largest group fell into the range of three to
four members in a family (36.7 percent). The second largest group were those
with five to six family members at 27.8 percent. This was followed by those
with less than 3 family members at 25.3 percent, while the remaining 10.1
percent have more than six family members.
5.2 Consumer’s Grocery Shopping Pattern
This section examines the grocery shopping pattern of the respondents.
Specifically, the following habit will be examined: the frequency of the
respondents shop for the groceries, the amount of time the respondents
spend during a visit, the proportion of the monthly expenditure for groceries
(See table 5.2). Besides that, it also determines the frequency of shopping at
the four different retail formats (See Table 5.3), and the respondent‘s
preference between the four retail formats (see Table 5.4).
With regards to the frequency of visiting a grocery store, the study found that
the majority of the respondents (52.8 percent) shopped 2 to 3 times per month
for groceries. This was followed by respondents who shop less than 2 times
per month (20.9 percent). The remaining respondents shopped at least 4 to 5
times per month (18.7 percent) or more than 6 times per month (7.6 percent).

55
This finding shows that grocery shopping might eventually become a major
activity among Malaysians.
Table 5.2: Consumer’s Grocery Shopping Pattern
Frequency Percentage
How often do you shop for groceries for your household (per month)?
0-1 time 66 20.9
2-3 times 167 52.8
4-5 times 59 18.7
More than 6 times 24 7.6
Total 316 100
How much time you spend at the store each time?
Less than 30 minutes 46 14.6
30 – 60 minutes 169 53.5
60 – 90 minutes 79 25.0
More than 90 minutes 22 7.0
Total 316 100
How much money do you spend on groceries per month?
Less than RM 100 51 16.1
RM 101 – RM 200 82 26.0
RM 201 – RM 300 79 25.0
RM 301 – RM 400 44 13.9
RM 401 – RM 500 25 7.9
More than RM 500 35 11.1
Total 316 100
How do you usually go to the store?
Car 282 89.2
Walk 16 5.1
Public Transportation 18 5.7
Total 316 100
The study found that more than half of the respondents (53.5 percent) spent
about 30 to 60 minutes during the store visit. About one fourth (25.0 percent)
56
of the respondents indicated that they spent about 60 to 90 minutes per visit.
Another 14.5 percent of the respondents said that they spent less than 30
minutes to conduct their grocery shopping. The remaining 7.0 percent of the
respondents indicated that they spent more than 90 minutes in the store each
time.
Concerning the monthly expenditure of the respondents examined, about 26
percent of the respondents indicated that they spent around RM101 to RM200
for groceries, while another 25 percent spent between RM201 to RM300 per
month. Nearly 16.1 percent of the respondents mentioned that they spend
less than RM100 per month for groceries. Another 13.9 percent of the
respondents indicated that the grocery expenditure was in the range of
RM301 to RM400 per month, while 11.1 percent of the sample spend more
than RM500 per month. The remaining 7.9 percent of the respondents spend
between RM401 and RM500 per month. This finding shows that Malaysian
consumers spend quite a significant proportion of their monthly expenditure
on groceries.
The study found that most of the respondents (89.2 percent) use private
transportation such as a car to conduct their grocery shopping. More than 10
percent of the respondents use other modes such as public transportation
(5.7 percent) or walking (5.1 percent). This finding indicates that most of the
respondents have private transportation and that it is more convenient for
them to use a car for their groceries.
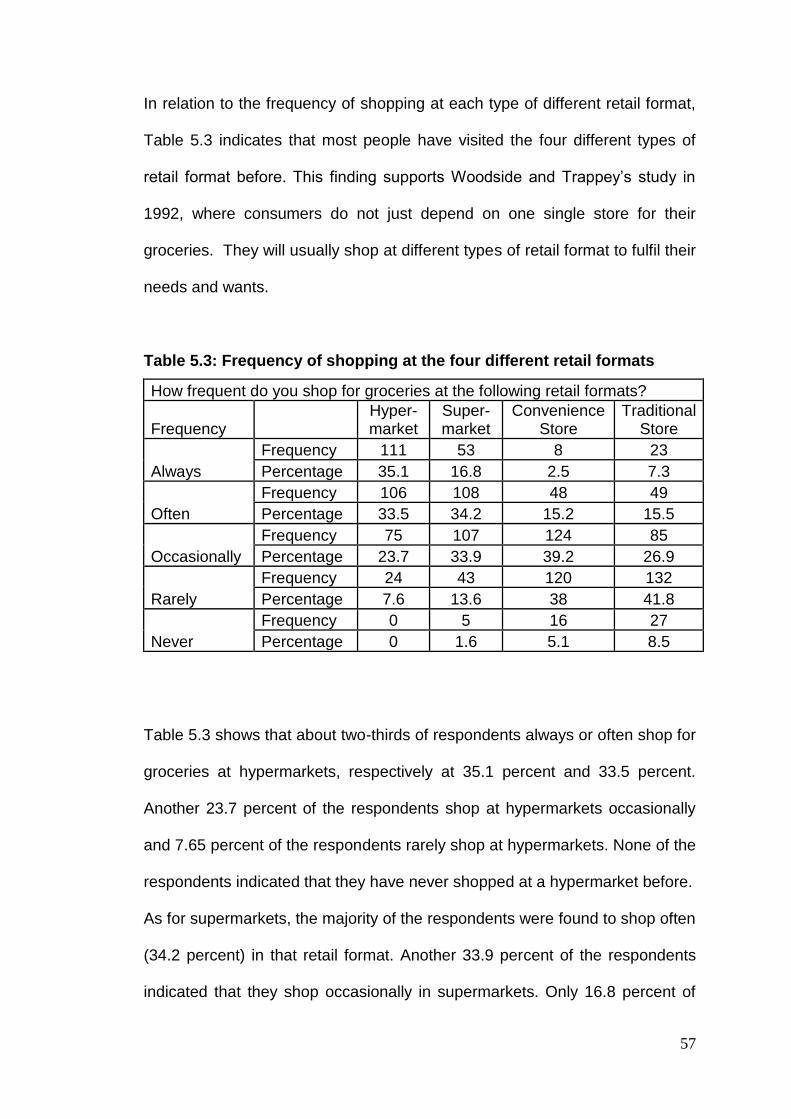
57
In relation to the frequency of shopping at each type of different retail format,
Table 5.3 indicates that most people have visited the four different types of
retail format before. This finding supports Woodside and Trappey‘s study in
1992, where consumers do not just depend on one single store for their
groceries. They will usually shop at different types of retail format to fulfil their
needs and wants.
Table 5.3: Frequency of shopping at the four different retail formats
How frequent do you shop for groceries at the following retail formats?
Frequency Hyper-market
Super- market
Convenience Store
Traditional Store
Always
Frequency 111 53 8 23
Percentage 35.1 16.8 2.5 7.3
Often
Frequency 106 108 48 49
Percentage 33.5 34.2 15.2 15.5
Occasionally
Frequency 75 107 124 85
Percentage 23.7 33.9 39.2 26.9
Rarely
Frequency 24 43 120 132
Percentage 7.6 13.6 38 41.8
Never
Frequency 0 5 16 27
Percentage 0 1.6 5.1 8.5
Table 5.3 shows that about two-thirds of respondents always or often shop for
groceries at hypermarkets, respectively at 35.1 percent and 33.5 percent.
Another 23.7 percent of the respondents shop at hypermarkets occasionally
and 7.65 percent of the respondents rarely shop at hypermarkets. None of the
respondents indicated that they have never shopped at a hypermarket before.
As for supermarkets, the majority of the respondents were found to shop often
(34.2 percent) in that retail format. Another 33.9 percent of the respondents
indicated that they shop occasionally in supermarkets. Only 16.8 percent of
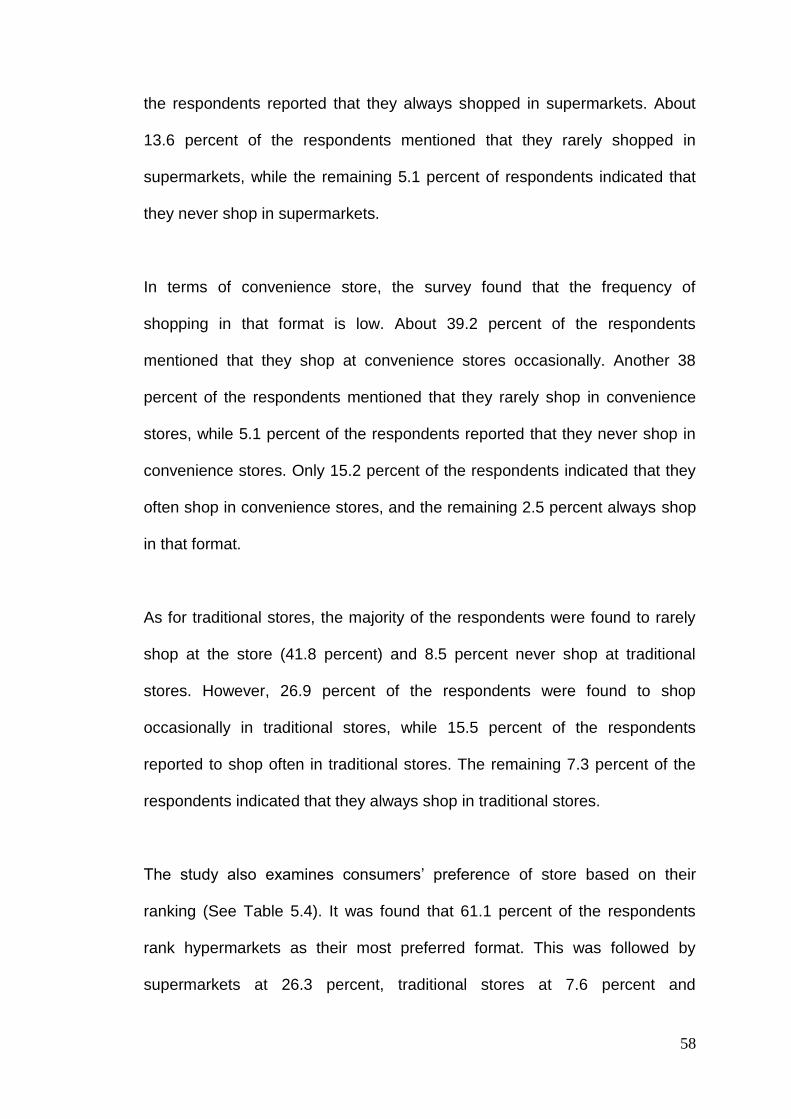
58
the respondents reported that they always shopped in supermarkets. About
13.6 percent of the respondents mentioned that they rarely shopped in
supermarkets, while the remaining 5.1 percent of respondents indicated that
they never shop in supermarkets.
In terms of convenience store, the survey found that the frequency of
shopping in that format is low. About 39.2 percent of the respondents
mentioned that they shop at convenience stores occasionally. Another 38
percent of the respondents mentioned that they rarely shop in convenience
stores, while 5.1 percent of the respondents reported that they never shop in
convenience stores. Only 15.2 percent of the respondents indicated that they
often shop in convenience stores, and the remaining 2.5 percent always shop
in that format.
As for traditional stores, the majority of the respondents were found to rarely
shop at the store (41.8 percent) and 8.5 percent never shop at traditional
stores. However, 26.9 percent of the respondents were found to shop
occasionally in traditional stores, while 15.5 percent of the respondents
reported to shop often in traditional stores. The remaining 7.3 percent of the
respondents indicated that they always shop in traditional stores.
The study also examines consumers‘ preference of store based on their
ranking (See Table 5.4). It was found that 61.1 percent of the respondents
rank hypermarkets as their most preferred format. This was followed by
supermarkets at 26.3 percent, traditional stores at 7.6 percent and
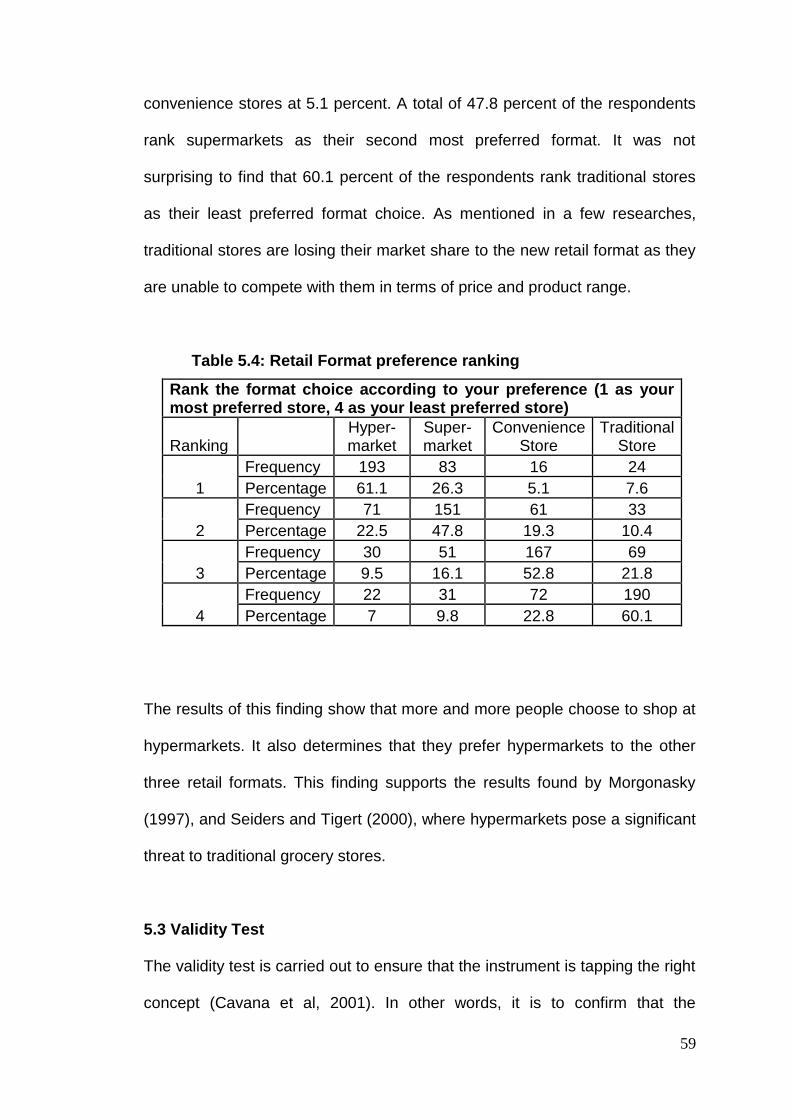
59
convenience stores at 5.1 percent. A total of 47.8 percent of the respondents
rank supermarkets as their second most preferred format. It was not
surprising to find that 60.1 percent of the respondents rank traditional stores
as their least preferred format choice. As mentioned in a few researches,
traditional stores are losing their market share to the new retail format as they
are unable to compete with them in terms of price and product range.
Table 5.4: Retail Format preference ranking
Rank the format choice according to your preference (1 as your most preferred store, 4 as your least preferred store)
Ranking
Hyper- market
Super- market
Convenience Store
Traditional Store
1
Frequency 193 83 16 24
Percentage 61.1 26.3 5.1 7.6
2
Frequency 71 151 61 33
Percentage 22.5 47.8 19.3 10.4
3
Frequency 30 51 167 69
Percentage 9.5 16.1 52.8 21.8
4
Frequency 22 31 72 190
Percentage 7 9.8 22.8 60.1
The results of this finding show that more and more people choose to shop at
hypermarkets. It also determines that they prefer hypermarkets to the other
three retail formats. This finding supports the results found by Morgonasky
(1997), and Seiders and Tigert (2000), where hypermarkets pose a significant
threat to traditional grocery stores.
5.3 Validity Test
The validity test is carried out to ensure that the instrument is tapping the right
concept (Cavana et al, 2001). In other words, it is to confirm that the
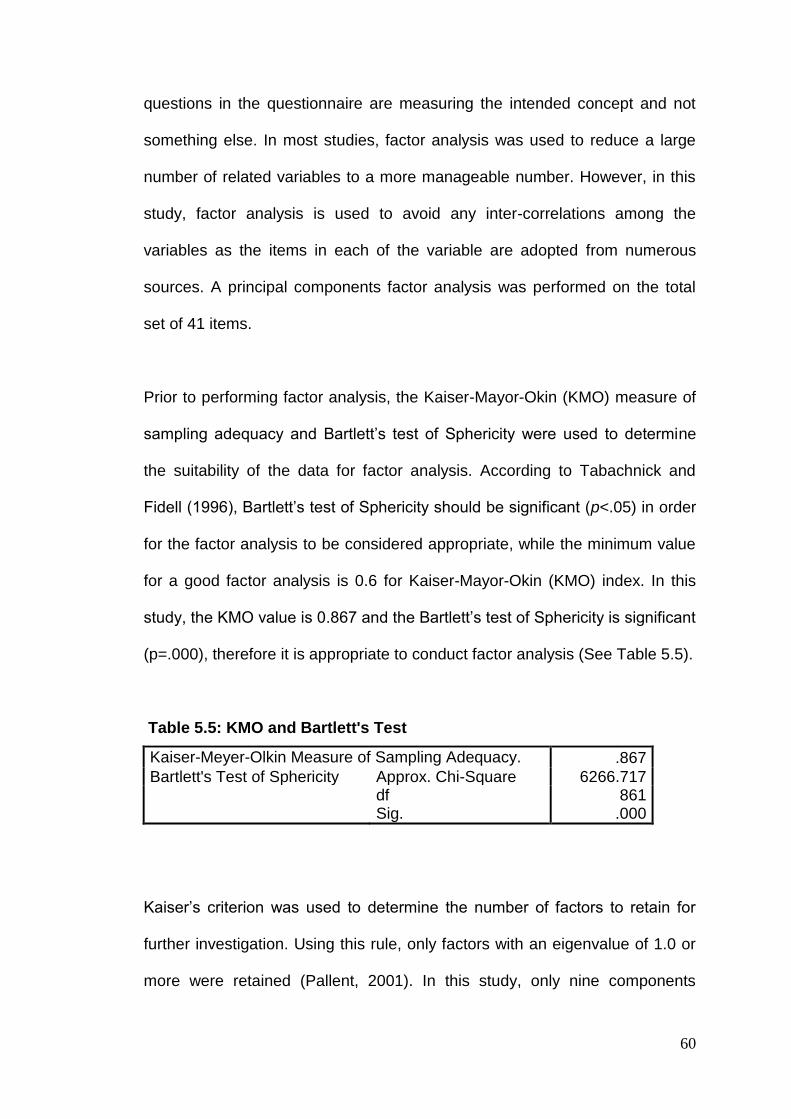
60
questions in the questionnaire are measuring the intended concept and not
something else. In most studies, factor analysis was used to reduce a large
number of related variables to a more manageable number. However, in this
study, factor analysis is used to avoid any inter-correlations among the
variables as the items in each of the variable are adopted from numerous
sources. A principal components factor analysis was performed on the total
set of 41 items.
Prior to performing factor analysis, the Kaiser-Mayor-Okin (KMO) measure of
sampling adequacy and Bartlett‘s test of Sphericity were used to determine
the suitability of the data for factor analysis. According to Tabachnick and
Fidell (1996), Bartlett‘s test of Sphericity should be significant (p<.05) in order
for the factor analysis to be considered appropriate, while the minimum value
for a good factor analysis is 0.6 for Kaiser-Mayor-Okin (KMO) index. In this
study, the KMO value is 0.867 and the Bartlett‘s test of Sphericity is significant
(p=.000), therefore it is appropriate to conduct factor analysis (See Table 5.5).
Table 5.5: KMO and Bartlett's Test
Kaiser-Meyer-Olkin Measure of Sampling Adequacy. .867
Bartlett's Test of Sphericity Approx. Chi-Square 6266.717 df 861 Sig. .000
Kaiser‘s criterion was used to determine the number of factors to retain for
further investigation. Using this rule, only factors with an eigenvalue of 1.0 or
more were retained (Pallent, 2001). In this study, only nine components
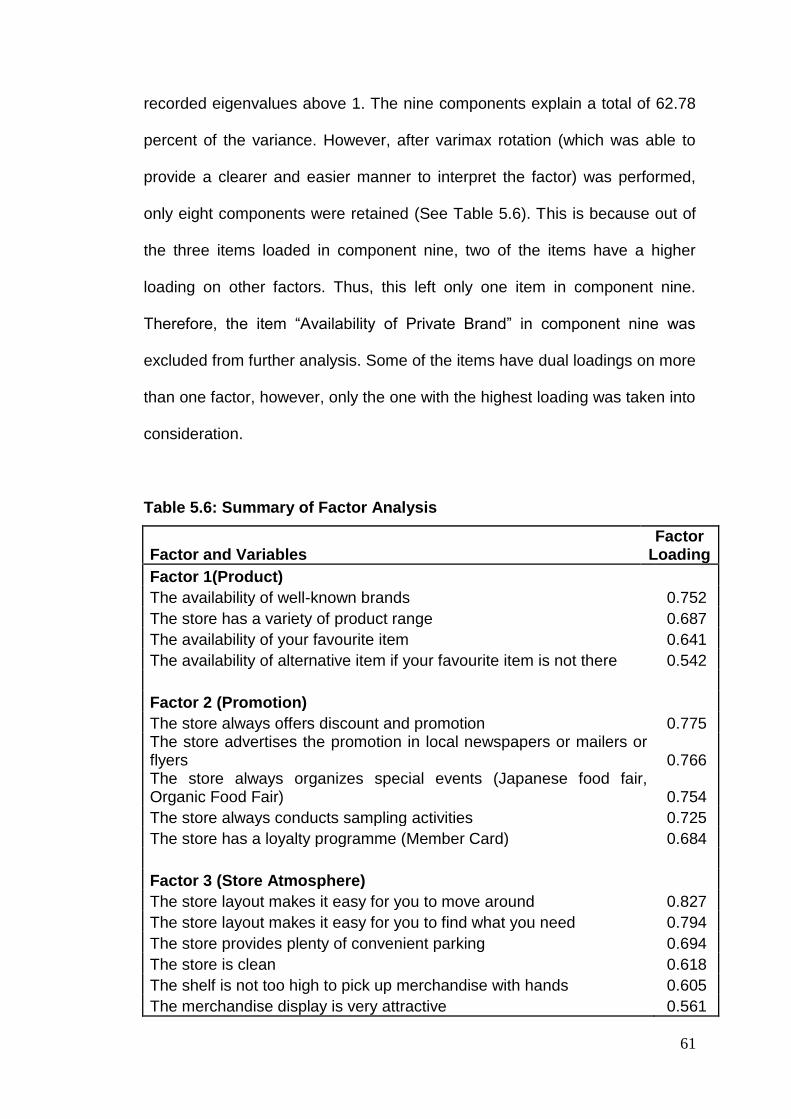
61
recorded eigenvalues above 1. The nine components explain a total of 62.78
percent of the variance. However, after varimax rotation (which was able to
provide a clearer and easier manner to interpret the factor) was performed,
only eight components were retained (See Table 5.6). This is because out of
the three items loaded in component nine, two of the items have a higher
loading on other factors. Thus, this left only one item in component nine.
Therefore, the item ―Availability of Private Brand‖ in component nine was
excluded from further analysis. Some of the items have dual loadings on more
than one factor, however, only the one with the highest loading was taken into
consideration.
Table 5.6: Summary of Factor Analysis
Factor and Variables Factor
Loading
Factor 1(Product)
The availability of well-known brands 0.752
The store has a variety of product range 0.687
The availability of your favourite item 0.641
The availability of alternative item if your favourite item is not there 0.542
Factor 2 (Promotion)
The store always offers discount and promotion 0.775 The store advertises the promotion in local newspapers or mailers or flyers 0.766 The store always organizes special events (Japanese food fair, Organic Food Fair) 0.754
The store always conducts sampling activities 0.725
The store has a loyalty programme (Member Card) 0.684
Factor 3 (Store Atmosphere)
The store layout makes it easy for you to move around 0.827
The store layout makes it easy for you to find what you need 0.794
The store provides plenty of convenient parking 0.694
The store is clean 0.618
The shelf is not too high to pick up merchandise with hands 0.605
The merchandise display is very attractive 0.561
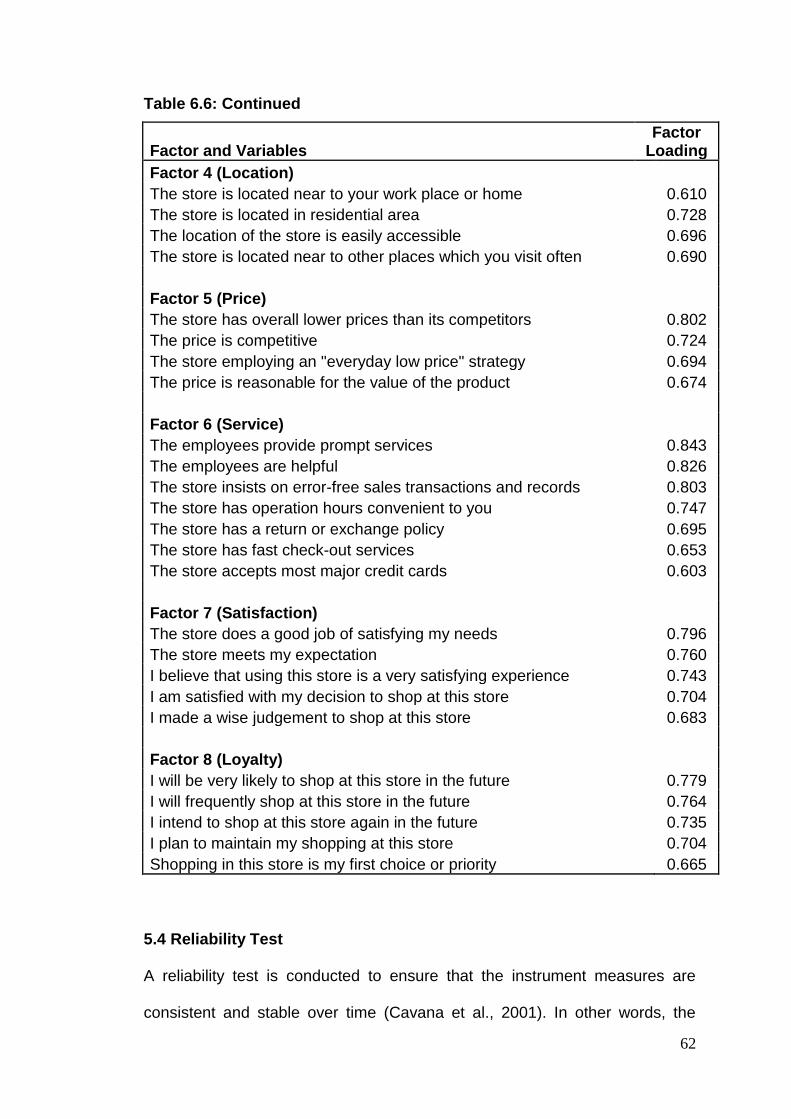
62
Table 6.6: Continued
Factor and Variables Factor
Loading
Factor 4 (Location)
The store is located near to your work place or home 0.610
The store is located in residential area 0.728
The location of the store is easily accessible 0.696
The store is located near to other places which you visit often 0.690
Factor 5 (Price)
The store has overall lower prices than its competitors 0.802
The price is competitive 0.724
The store employing an "everyday low price" strategy 0.694
The price is reasonable for the value of the product 0.674
Factor 6 (Service)
The employees provide prompt services 0.843
The employees are helpful 0.826
The store insists on error-free sales transactions and records 0.803
The store has operation hours convenient to you 0.747
The store has a return or exchange policy 0.695
The store has fast check-out services 0.653
The store accepts most major credit cards 0.603
Factor 7 (Satisfaction)
The store does a good job of satisfying my needs 0.796
The store meets my expectation 0.760
I believe that using this store is a very satisfying experience 0.743
I am satisfied with my decision to shop at this store 0.704
I made a wise judgement to shop at this store 0.683
Factor 8 (Loyalty)
I will be very likely to shop at this store in the future 0.779
I will frequently shop at this store in the future 0.764
I intend to shop at this store again in the future 0.735
I plan to maintain my shopping at this store 0.704
Shopping in this store is my first choice or priority 0.665
5.4 Reliability Test
A reliability test is conducted to ensure that the instrument measures are
consistent and stable over time (Cavana et al., 2001). In other words, the
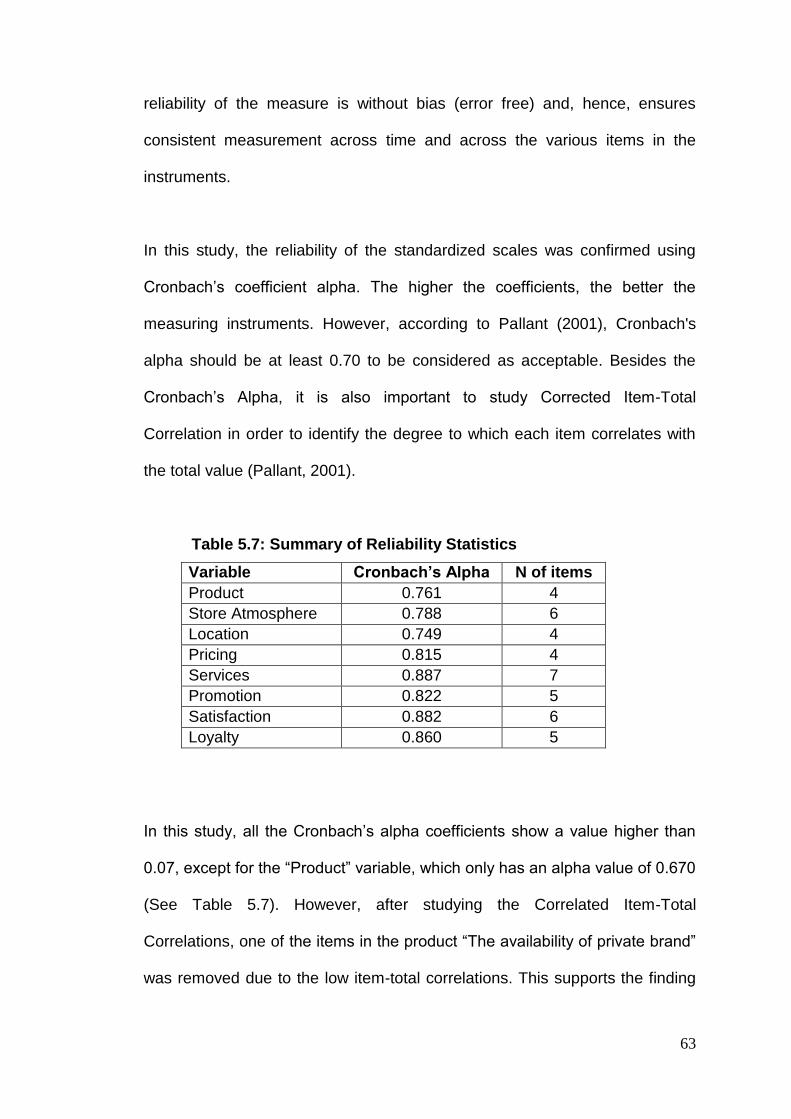
63
reliability of the measure is without bias (error free) and, hence, ensures
consistent measurement across time and across the various items in the
instruments.
In this study, the reliability of the standardized scales was confirmed using
Cronbach‘s coefficient alpha. The higher the coefficients, the better the
measuring instruments. However, according to Pallant (2001), Cronbach's
alpha should be at least 0.70 to be considered as acceptable. Besides the
Cronbach‘s Alpha, it is also important to study Corrected Item-Total
Correlation in order to identify the degree to which each item correlates with
the total value (Pallant, 2001).
Table 5.7: Summary of Reliability Statistics
Variable Cronbach’s Alpha N of items
Product 0.761 4
Store Atmosphere 0.788 6
Location 0.749 4
Pricing 0.815 4
Services 0.887 7
Promotion 0.822 5
Satisfaction 0.882 6
Loyalty 0.860 5
In this study, all the Cronbach‘s alpha coefficients show a value higher than
0.07, except for the ―Product‖ variable, which only has an alpha value of 0.670
(See Table 5.7). However, after studying the Correlated Item-Total
Correlations, one of the items in the product ―The availability of private brand‖
was removed due to the low item-total correlations. This supports the finding
64
in the validity test, as it was loaded alone in a different component. After
removing the item, the alpha value for ―product‖ became 0.761, which then
met the minimum acceptable requirement.
5.5 Test of Hypotheses
5.5.1 Relationship of store attributes, customer satisfaction and store
loyalty
Correlation analysis is used to examine the relationship between two
variables in a linear fashion (Pallet, 2001). This study used the Pearson
product-moment correlation coefficients to measure the relationship of the
store attributes (products, location, store atmosphere, promotion, price and
services), customer satisfaction and store loyalty. In terms of the strength of
the relationships between the two variables, Cohen (1988) has suggested
some guidelines to determine whether the relationship of the variables is
small, medium or large (as per Table 5.8).
Table 5.8: Strength of Relationship between Two Variables
Value of Pearson Correlation (r) Strength of the Relationship
r = .10 to .29 or r = -.10 to -.29 Small
r = .30 to .49 or r = -.30 to -.49 Medium
r = .50 to 1.0 or r = -.50 to -1.0 Large
The summary of the correlation and significance are indicated in Table 5.9.
The results show that all the items in hypothesis 1 are supported. It is shown
that various store attributes have a positive impact on store loyalty. The
strength of the relationship ranges from weak to medium. More specifically,
the strength of the relationships is in the following ranking, from the strongest
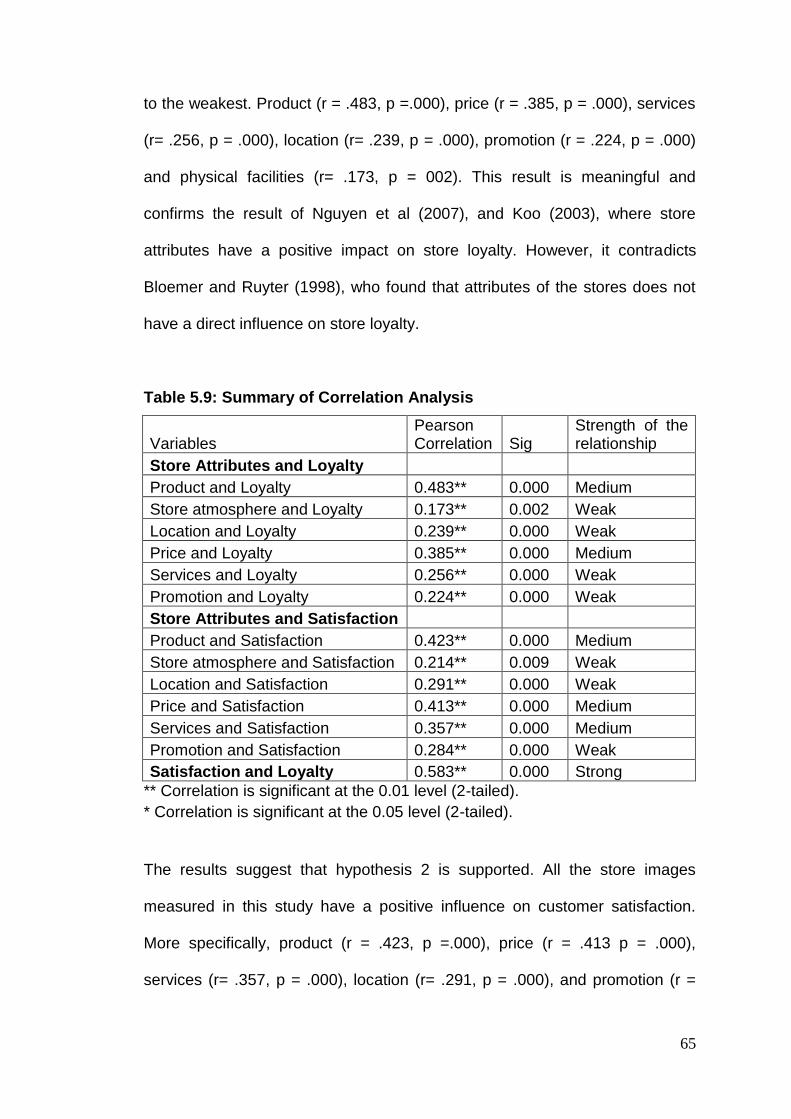
65
to the weakest. Product (r = .483, p =.000), price (r = .385, p = .000), services
(r= .256, p = .000), location (r= .239, p = .000), promotion (r = .224, p = .000)
and physical facilities (r= .173, p = 002). This result is meaningful and
confirms the result of Nguyen et al (2007), and Koo (2003), where store
attributes have a positive impact on store loyalty. However, it contradicts
Bloemer and Ruyter (1998), who found that attributes of the stores does not
have a direct influence on store loyalty.
Table 5.9: Summary of Correlation Analysis
Variables Pearson Correlation Sig
Strength of the relationship
Store Attributes and Loyalty
Product and Loyalty 0.483** 0.000 Medium
Store atmosphere and Loyalty 0.173** 0.002 Weak
Location and Loyalty 0.239** 0.000 Weak
Price and Loyalty 0.385** 0.000 Medium
Services and Loyalty 0.256** 0.000 Weak
Promotion and Loyalty 0.224** 0.000 Weak
Store Attributes and Satisfaction Product and Satisfaction 0.423** 0.000 Medium
Store atmosphere and Satisfaction 0.214** 0.009 Weak
Location and Satisfaction 0.291** 0.000 Weak
Price and Satisfaction 0.413** 0.000 Medium
Services and Satisfaction 0.357** 0.000 Medium
Promotion and Satisfaction 0.284** 0.000 Weak
Satisfaction and Loyalty 0.583** 0.000 Strong
** Correlation is significant at the 0.01 level (2-tailed).
* Correlation is significant at the 0.05 level (2-tailed).
The results suggest that hypothesis 2 is supported. All the store images
measured in this study have a positive influence on customer satisfaction.
More specifically, product (r = .423, p =.000), price (r = .413 p = .000),
services (r= .357, p = .000), location (r= .291, p = .000), and promotion (r =
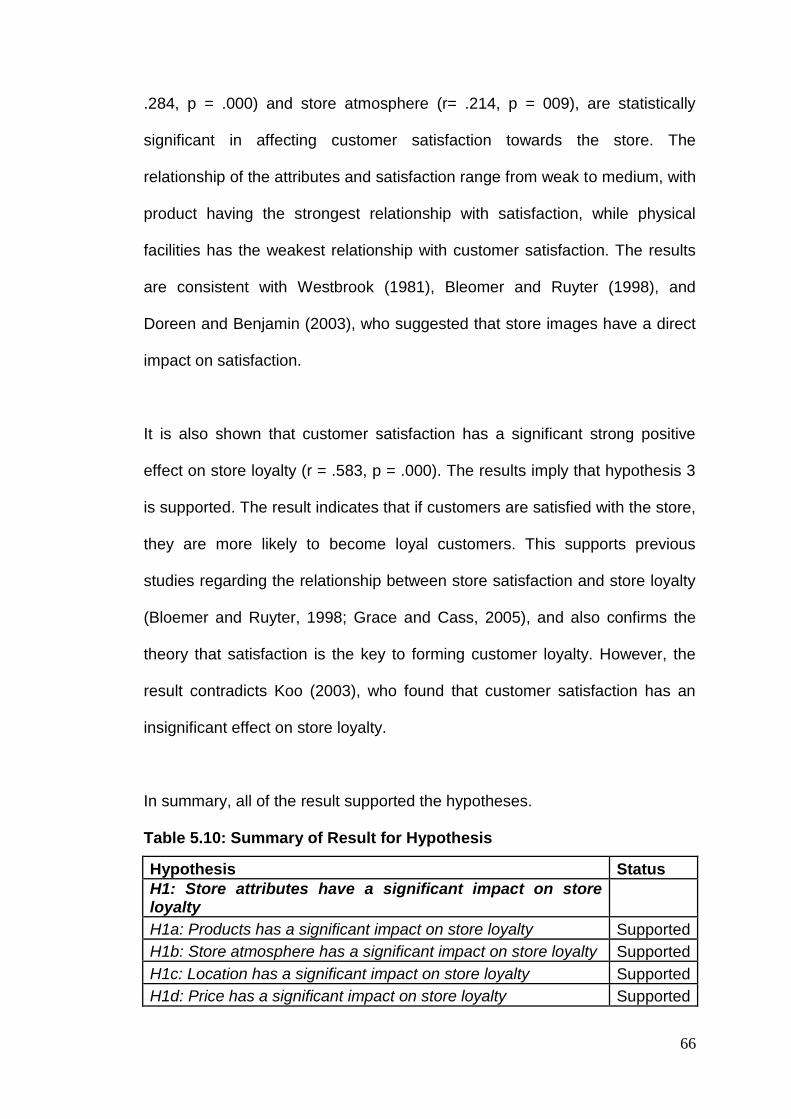
66
.284, p = .000) and store atmosphere (r= .214, p = 009), are statistically
significant in affecting customer satisfaction towards the store. The
relationship of the attributes and satisfaction range from weak to medium, with
product having the strongest relationship with satisfaction, while physical
facilities has the weakest relationship with customer satisfaction. The results
are consistent with Westbrook (1981), Bleomer and Ruyter (1998), and
Doreen and Benjamin (2003), who suggested that store images have a direct
impact on satisfaction.
It is also shown that customer satisfaction has a significant strong positive
effect on store loyalty (r = .583, p = .000). The results imply that hypothesis 3
is supported. The result indicates that if customers are satisfied with the store,
they are more likely to become loyal customers. This supports previous
studies regarding the relationship between store satisfaction and store loyalty
(Bloemer and Ruyter, 1998; Grace and Cass, 2005), and also confirms the
theory that satisfaction is the key to forming customer loyalty. However, the
result contradicts Koo (2003), who found that customer satisfaction has an
insignificant effect on store loyalty.
In summary, all of the result supported the hypotheses.
Table 5.10: Summary of Result for Hypothesis
Hypothesis Status
H1: Store attributes have a significant impact on store loyalty
H1a: Products has a significant impact on store loyalty Supported
H1b: Store atmosphere has a significant impact on store loyalty Supported
H1c: Location has a significant impact on store loyalty Supported
H1d: Price has a significant impact on store loyalty Supported
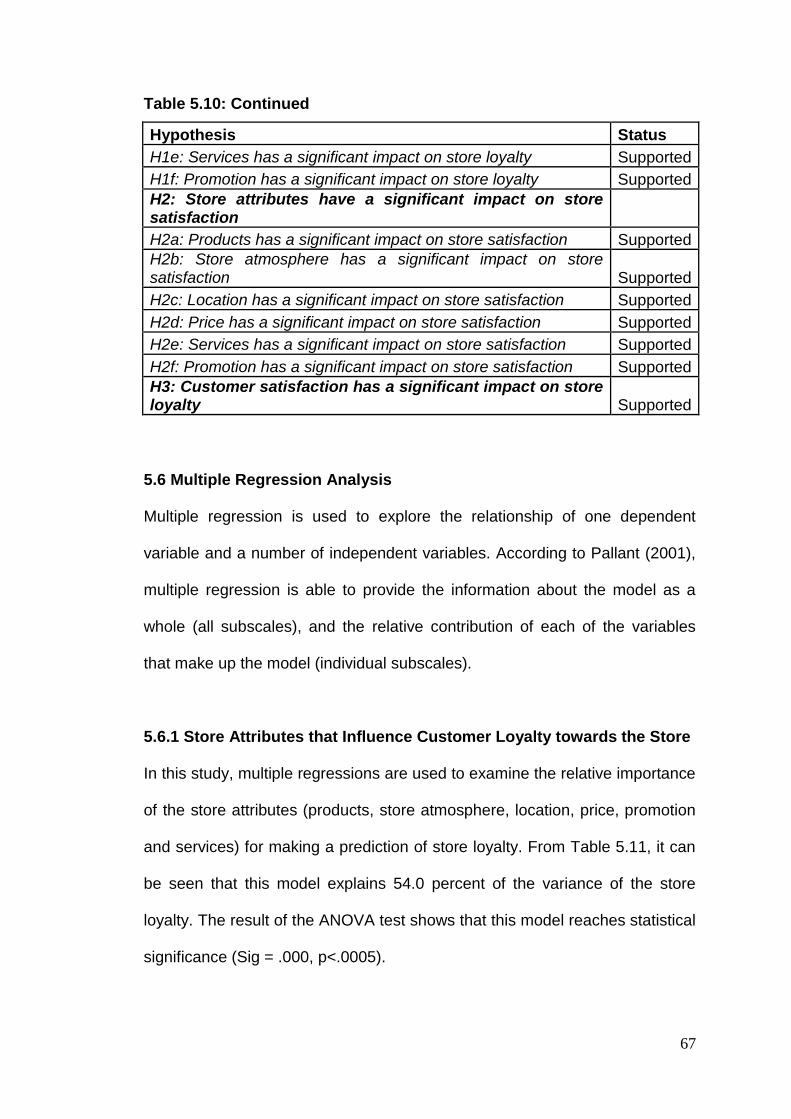
67
Table 5.10: Continued
Hypothesis Status
H1e: Services has a significant impact on store loyalty Supported
H1f: Promotion has a significant impact on store loyalty Supported
H2: Store attributes have a significant impact on store satisfaction
H2a: Products has a significant impact on store satisfaction Supported
H2b: Store atmosphere has a significant impact on store satisfaction Supported
H2c: Location has a significant impact on store satisfaction Supported
H2d: Price has a significant impact on store satisfaction Supported
H2e: Services has a significant impact on store satisfaction Supported
H2f: Promotion has a significant impact on store satisfaction Supported
H3: Customer satisfaction has a significant impact on store loyalty Supported
5.6 Multiple Regression Analysis
Multiple regression is used to explore the relationship of one dependent
variable and a number of independent variables. According to Pallant (2001),
multiple regression is able to provide the information about the model as a
whole (all subscales), and the relative contribution of each of the variables
that make up the model (individual subscales).
5.6.1 Store Attributes that Influence Customer Loyalty towards the Store
In this study, multiple regressions are used to examine the relative importance
of the store attributes (products, store atmosphere, location, price, promotion
and services) for making a prediction of store loyalty. From Table 5.11, it can
be seen that this model explains 54.0 percent of the variance of the store
loyalty. The result of the ANOVA test shows that this model reaches statistical
significance (Sig = .000, p<.0005).
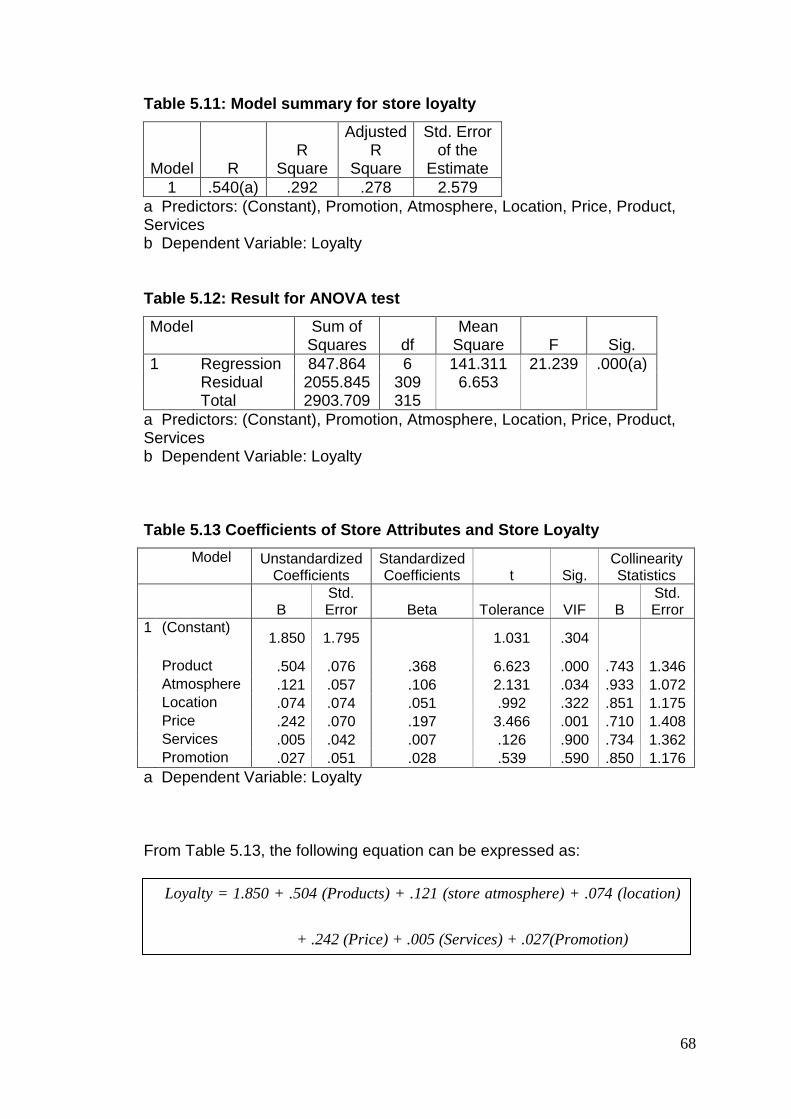
68
Table 5.11: Model summary for store loyalty
Model R R
Square
Adjusted R
Square
Std. Error of the
Estimate
1 .540(a) .292 .278 2.579
a Predictors: (Constant), Promotion, Atmosphere, Location, Price, Product, Services b Dependent Variable: Loyalty
Table 5.12: Result for ANOVA test
Model
Sum of Squares df
Mean Square F Sig.
1 Regression 847.864 6 141.311 21.239 .000(a) Residual 2055.845 309 6.653 Total 2903.709 315
a Predictors: (Constant), Promotion, Atmosphere, Location, Price, Product, Services b Dependent Variable: Loyalty Table 5.13 Coefficients of Store Attributes and Store Loyalty
Model
Unstandardized Coefficients
Standardized Coefficients t Sig.
Collinearity Statistics
B Std. Error Beta Tolerance VIF B
Std. Error
1 (Constant) 1.850 1.795 1.031 .304
Product .504 .076 .368 6.623 .000 .743 1.346 Atmosphere .121 .057 .106 2.131 .034 .933 1.072 Location .074 .074 .051 .992 .322 .851 1.175 Price .242 .070 .197 3.466 .001 .710 1.408 Services .005 .042 .007 .126 .900 .734 1.362
Promotion .027 .051 .028 .539 .590 .850 1.176
a Dependent Variable: Loyalty
From Table 5.13, the following equation can be expressed as:
Loyalty = 1.850 + .504 (Products) + .121 (store atmosphere) + .074 (location)
+ .242 (Price) + .005 (Services) + .027(Promotion)
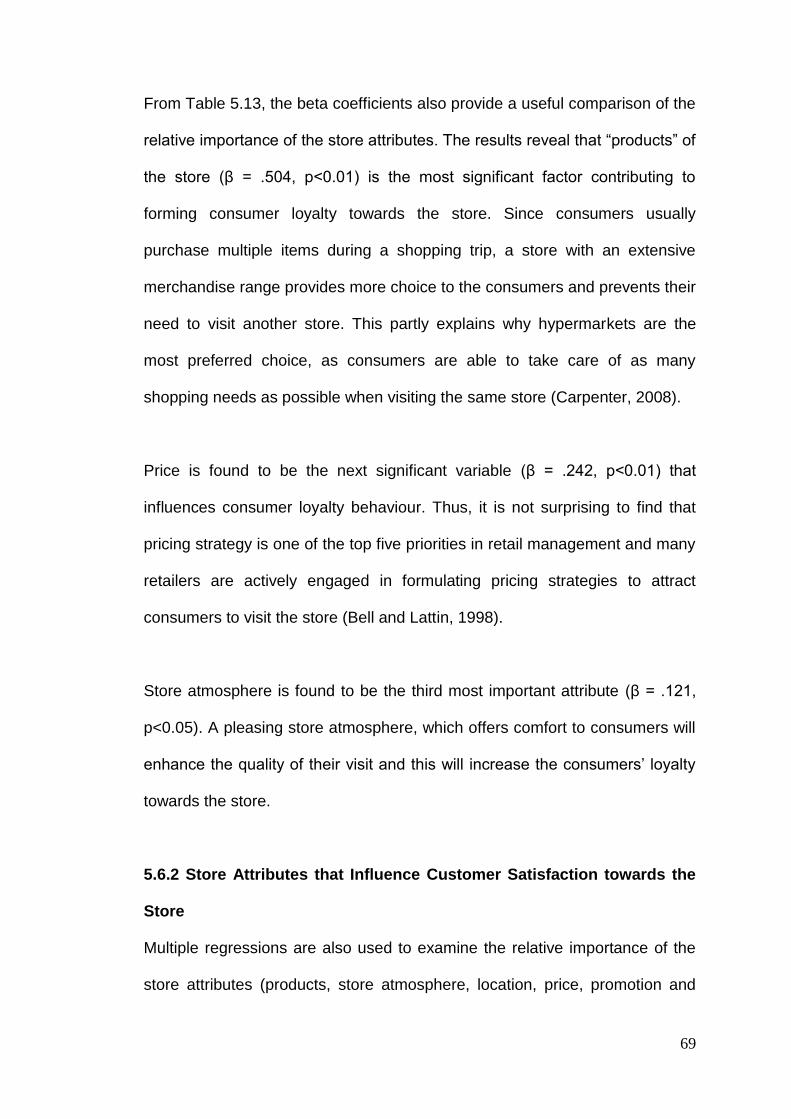
69
From Table 5.13, the beta coefficients also provide a useful comparison of the
relative importance of the store attributes. The results reveal that ―products‖ of
the store (β = .504, p<0.01) is the most significant factor contributing to
forming consumer loyalty towards the store. Since consumers usually
purchase multiple items during a shopping trip, a store with an extensive
merchandise range provides more choice to the consumers and prevents their
need to visit another store. This partly explains why hypermarkets are the
most preferred choice, as consumers are able to take care of as many
shopping needs as possible when visiting the same store (Carpenter, 2008).
Price is found to be the next significant variable (β = .242, p<0.01) that
influences consumer loyalty behaviour. Thus, it is not surprising to find that
pricing strategy is one of the top five priorities in retail management and many
retailers are actively engaged in formulating pricing strategies to attract
consumers to visit the store (Bell and Lattin, 1998).
Store atmosphere is found to be the third most important attribute (β = .121,
p<0.05). A pleasing store atmosphere, which offers comfort to consumers will
enhance the quality of their visit and this will increase the consumers‘ loyalty
towards the store.
5.6.2 Store Attributes that Influence Customer Satisfaction towards the
Store
Multiple regressions are also used to examine the relative importance of the
store attributes (products, store atmosphere, location, price, promotion and
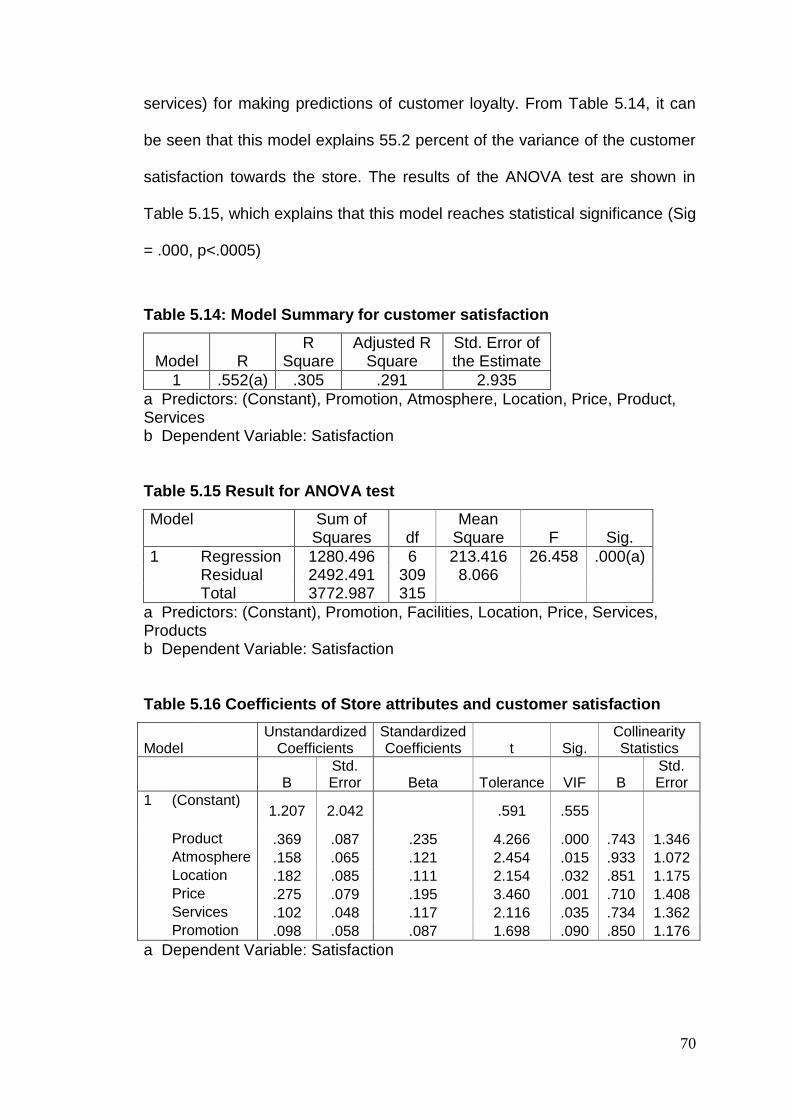
70
services) for making predictions of customer loyalty. From Table 5.14, it can
be seen that this model explains 55.2 percent of the variance of the customer
satisfaction towards the store. The results of the ANOVA test are shown in
Table 5.15, which explains that this model reaches statistical significance (Sig
= .000, p<.0005)
Table 5.14: Model Summary for customer satisfaction
Model R R
Square Adjusted R
Square Std. Error of the Estimate
1 .552(a) .305 .291 2.935
a Predictors: (Constant), Promotion, Atmosphere, Location, Price, Product, Services b Dependent Variable: Satisfaction
Table 5.15 Result for ANOVA test
Model
Sum of Squares df
Mean Square F Sig.
1 Regression 1280.496 6 213.416 26.458 .000(a) Residual 2492.491 309 8.066 Total 3772.987 315
a Predictors: (Constant), Promotion, Facilities, Location, Price, Services, Products b Dependent Variable: Satisfaction Table 5.16 Coefficients of Store attributes and customer satisfaction
Model
Unstandardized Coefficients
Standardized Coefficients t Sig.
Collinearity Statistics
B Std. Error Beta Tolerance VIF B
Std. Error
1 (Constant) 1.207 2.042 .591 .555
Product .369 .087 .235 4.266 .000 .743 1.346 Atmosphere .158 .065 .121 2.454 .015 .933 1.072 Location .182 .085 .111 2.154 .032 .851 1.175 Price .275 .079 .195 3.460 .001 .710 1.408 Services .102 .048 .117 2.116 .035 .734 1.362 Promotion .098 .058 .087 1.698 .090 .850 1.176
a Dependent Variable: Satisfaction
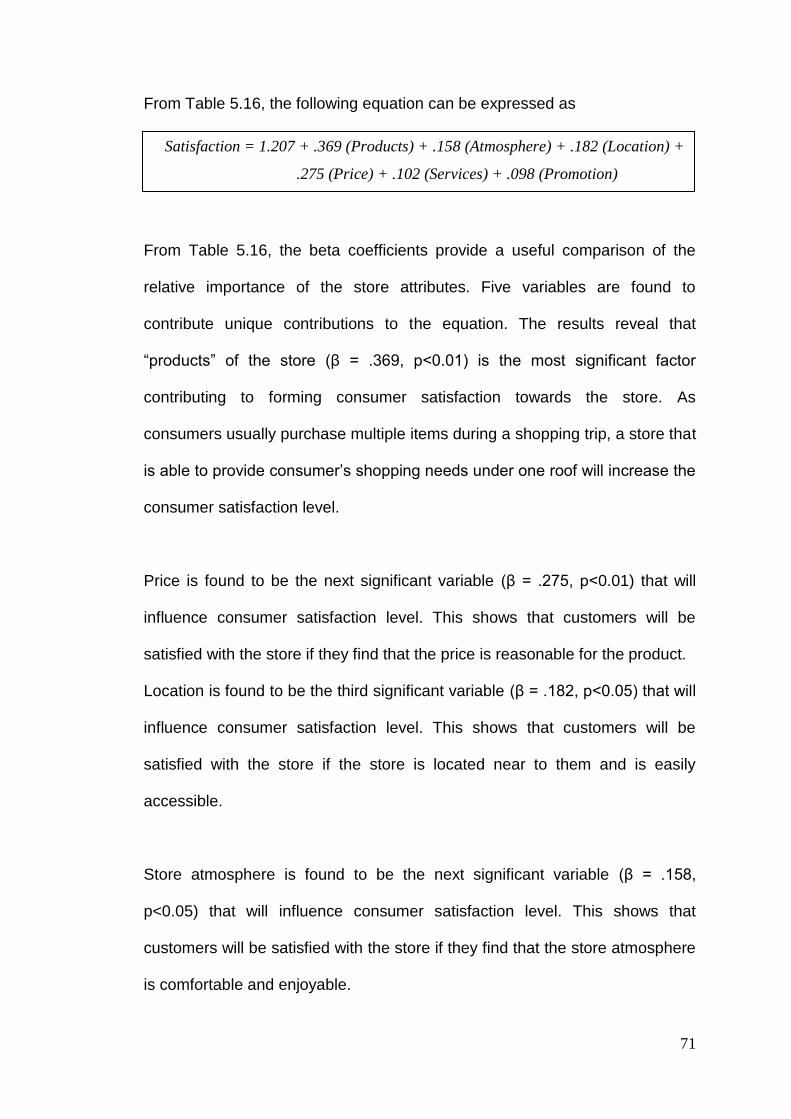
71
From Table 5.16, the following equation can be expressed as
From Table 5.16, the beta coefficients provide a useful comparison of the
relative importance of the store attributes. Five variables are found to
contribute unique contributions to the equation. The results reveal that
―products‖ of the store (β = .369, p<0.01) is the most significant factor
contributing to forming consumer satisfaction towards the store. As
consumers usually purchase multiple items during a shopping trip, a store that
is able to provide consumer‘s shopping needs under one roof will increase the
consumer satisfaction level.
Price is found to be the next significant variable (β = .275, p<0.01) that will
influence consumer satisfaction level. This shows that customers will be
satisfied with the store if they find that the price is reasonable for the product.
Location is found to be the third significant variable (β = .182, p<0.05) that will
influence consumer satisfaction level. This shows that customers will be
satisfied with the store if the store is located near to them and is easily
accessible.
Store atmosphere is found to be the next significant variable (β = .158,
p<0.05) that will influence consumer satisfaction level. This shows that
customers will be satisfied with the store if they find that the store atmosphere
is comfortable and enjoyable.
Satisfaction = 1.207 + .369 (Products) + .158 (Atmosphere) + .182 (Location) +
.275 (Price) + .102 (Services) + .098 (Promotion)
72
Service is the fifth most important variables (β = .102, p<0.05) that will
influence consumer satisfaction level. This shows that the service provided by
the store is very important in influencing customer satisfaction.
As a conclusion from this finding, it was found that products, price, location,
store atmosphere and services will contribute to form customer satisfaction
towards the store. Thus, it is important for the retailers to use all five of the
variables to increase customers‘ satisfaction level.
5.7 Consumer Preference Structure
As discussed earlier, there are a variety of reasons why consumers visit a
grocery store. As suggested by previous researchers, store attributes such as
product, price, location, and services will influence their retail format choice
(Seiders and Tigert, 2000; Kim and Jin, 2001; Carpenter and Moore, 2006). In
this study, respondents that indicated a particular channel as their most
preferred channel were classified as the primary shoppers of that channel.
This approach was adopted from the study of Seiders and Tigert (2000),
where they define primary shopper as those people who shop most often in a
particular grocery store. Table 5.17 shows the attributes that the primary
shoppers perceive as important in determining their preference of the format
choice.
The top three store attributes among primary shoppers of hypermarkets
(n=193) are product, price and promotion. The result is not surprising as this
retail format is well known for its huge merchandise selection and is able to
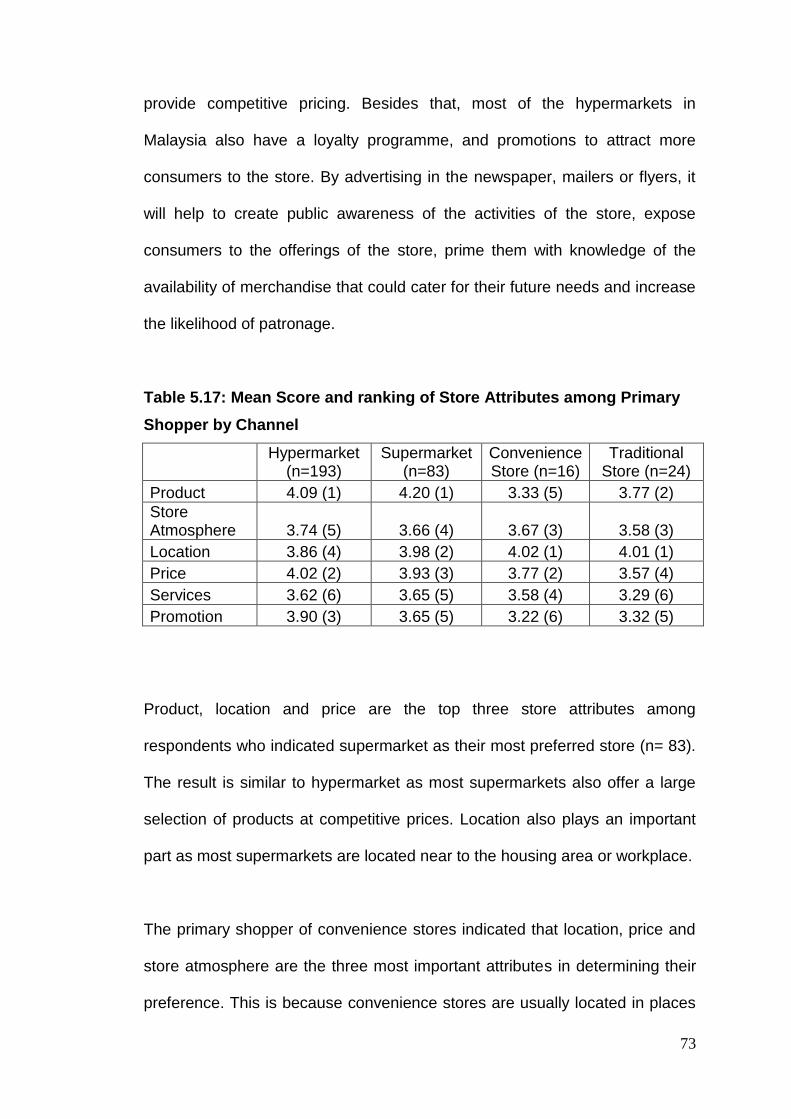
73
provide competitive pricing. Besides that, most of the hypermarkets in
Malaysia also have a loyalty programme, and promotions to attract more
consumers to the store. By advertising in the newspaper, mailers or flyers, it
will help to create public awareness of the activities of the store, expose
consumers to the offerings of the store, prime them with knowledge of the
availability of merchandise that could cater for their future needs and increase
the likelihood of patronage.
Table 5.17: Mean Score and ranking of Store Attributes among Primary
Shopper by Channel
Hypermarket
(n=193) Supermarket
(n=83) Convenience Store (n=16)
Traditional Store (n=24)
Product 4.09 (1) 4.20 (1) 3.33 (5) 3.77 (2)
Store Atmosphere 3.74 (5) 3.66 (4) 3.67 (3) 3.58 (3)
Location 3.86 (4) 3.98 (2) 4.02 (1) 4.01 (1)
Price 4.02 (2) 3.93 (3) 3.77 (2) 3.57 (4)
Services 3.62 (6) 3.65 (5) 3.58 (4) 3.29 (6)
Promotion 3.90 (3) 3.65 (5) 3.22 (6) 3.32 (5)
Product, location and price are the top three store attributes among
respondents who indicated supermarket as their most preferred store (n= 83).
The result is similar to hypermarket as most supermarkets also offer a large
selection of products at competitive prices. Location also plays an important
part as most supermarkets are located near to the housing area or workplace.
The primary shopper of convenience stores indicated that location, price and
store atmosphere are the three most important attributes in determining their
preference. This is because convenience stores are usually located in places
74
that are convenient and easily accessible. However, it is surprising to find that
convenience store shoppers indicate that price is one of the most important
factors, as most of the convenience stores tend to price products higher. This
might be due to the competition becoming more intense, with more
newcomers such as KK-Mart, Carrefour Express and 99 Speedmarts. Some
of the retailers started to position themselves at a lower price.
Those shoppers who mentioned that traditional stores are their most preferred
format indicated that location, product and store atmosphere will influence
their store choice. Price, service and promotion are ranked lowest by the
shoppers because traditional stores do not tend to compete on price and
conduct fewer promotions compared to hypermarkets and supermarkets.
These retailers tend to offer a reasonable product range for shoppers in the
neighbourhood area. Thus, in order for the traditional retailers to compete with
the modern retailers, it is important for them to use pricing, services, and
promotion as the tools to attract more consumers to the store.
Regardless of which retail channel, the most common attributes that
consumers perceive as important are product, location and price. This
indicates that it is important for the retailers to include the three attributes in
their marketing plan. Thus, it is not surprising to find that more and more
retailers are displaying a wider variety of products, or using ―everyday low
price‖ strategy to attract consumers to the store.
75
5.8 Conclusion
Based on the results, six factors regarding store attributes, which include
products, promotion, store atmosphere, price, services and location, were
found to influence consumers‘ behaviour, such as customer satisfaction and
loyal patronage behaviour. Moreover, it was found that customer satisfaction
will have an impact on customer loyalty towards the store.
The research found that the consumers shopped in more than one format,
and the reasons for shopping in each format varies from one to another. From
the research, it can be concluded that hypermarkets are the most preferred
format choice among Malaysian consumers.
Chapter 6 will cover the summary and recommendations of this study.
76
CHAPTER 6: CONCLUSION AND RECOMMENDATIONS
The final chapter will provide the conclusion for this research. First, an
overview of the study will be provided. Thereafter, the summary of the major
findings, marketing implications, limitations of the study, and suggestion for
further research are presented. Finally, the chapter ends with the concluding
remarks of the study.
6.1 Overview of the study
The study attempts to identify consumer behaviour in the grocery industry in
Malaysia. The emergence of new retail formats in the last few decades has
affected the way consumers shop as they now have more choices to decide
on. Thus, it is important for the retailers to understand the factors that will
affect consumers‘ behaviour.
Specifically, the study examined grocery retailing in Malaysia, evaluated
consumers‘ grocery shopping habits, and the impact of store attributes on
consumer behaviour was also investigated. In addition, the study
endeavoured to examine the relationship between store attributes, customer
satisfaction and store loyalty.
The data for the study was collected through a six page self-administered
questionnaire. The sample consisted of 316 respondents living in the Klang
Valley area. In general, respondents in this survey are dominated by female
(54.7 percent); aged between 21 to 30 years (48.1 percent); Malay (43.4
percent); and single (52.8 percent). The education level attained by the
77
respondents is fairly high, with almost 82.3 percent having diploma and above
education level. In terms of occupation, the majority of the respondents are
executives (38.9 percent). More than 74 percent of the respondents have a
monthly income above RM2,000.
6.2 Summary of the research results
The study found that on average Malaysian shoppers shop two to three times
per month for groceries. In terms of the time spent during a store visit, the
study found that the majority of the shoppers spend at least 30 minutes in the
store per visit. When the pattern of monthly expenditure was examined, the
findings show that Malaysian consumers spend quite a significant proportion
of their monthly expenditure on groceries. About 50 percent of the
respondents indicated that they spend around RM101 to RM300 on groceries
every month.
In relation to the frequency of shopping at each type of different retail format,
the study found that Malaysians do not just depend on one single store for
their groceries. This confirms the finding of most researchers where shoppers
tend to shop in more than one retail format for grocery products. However,
hypermarkets were found to be the most preferred format among the
respondents. This was followed by supermarkets, traditional stores and
convenience stores. The study also found that some of the respondents do
not shop in supermarkets, traditional stores, or convenience stores.
78
The study also investigated the factors that influence the behaviour of the
consumers towards the grocery store. The results show that products, price,
promotion, services, location and store atmosphere are the attributes that will
affect the customer satisfaction level and will be able to attract the consumers
to visit the store.
The study also provides a useful comparison of the relative importance of
store attributes. It was found that products, price and store atmosphere are
the three most important factors in determining customer loyalty. On the other
hand, all factors except promotion were found to play important roles in
determining customers‘ satisfaction level.
In terms of testing the relationship of satisfaction and loyalty, the study found
that re-patronage intention will increase when the customer satisfaction level
increases. Thus, it can be said that satisfaction is a necessary step in loyalty
formulation.
The study found that store attributes play an important role in influencing
consumer‘s preference for the four retail formats. It was found that consumers
tend to shop at different retail formats for diverse reasons. For example,
shoppers who prefer hypermarkets indicate that product and price are the two
most important attributes. For those respondents who prefer supermarkets,
they mentioned that product and location are the top two store attributes that
will affect their preference. On the other hand, convenience store shoppers
placed location and price as the two most important attributes in forming their
79
preference towards the store. Shoppers who prefer traditional stores indicated
that location, and product will influence their store choice preference.
In conclusion, the results show that all hypotheses are supported. The results
show that products, price, promotion, services, location and store atmosphere
are the attributes that affect customer satisfaction level and will attract
consumers to visit the store. It was also found that satisfied customers tend to
become loyal customers. Thus, there is a linkage between store attributes,
customer satisfaction and store loyalty.
6.3 Marketing Implications
The study suggests that grocery retailers can benefit from understanding the
consumers, and factors that influence their behaviour. The results of this
study have several important implications. First, the study attempted to
analyze grocery channels in Malaysian. It was found that hypermarkets are
the most popular and preferred channel. This suggests that hypermarkets
have a competitive advantage in the industry, and, thus, encourages investors
to invest in this channel by opening more outlets in Malaysia.
Second, the study also found that store attributes will influence consumer‘s
behaviour, in terms of their satisfaction and re-patronage intention. Six
attributes (price, promotion, location, product, services, and store
atmosphere) were found to have an impact on consumers‘ behaviour.
However, consumers weigh the attributes differently. Some of the attributes
are perceived as more important than others. Overall, products and price are

80
the most important attributes that will contribute to forming customer
satisfaction and loyalty behaviour. Perhaps the retailers could capitalize on
this desire to offer a better merchandise assortment at competitive prices. But
small grocery retailers will not be able to compete with large or chain retailers
in terms of pricing and product assortment. Thus, it is important for the small
retailers to emphasize other attributes in order to survive in this competitive
market.
Third, the consumer preference structure suggests that there is a relationship
between the retail format and store attributes. The importance of attributes
perceived by consumers differs across retail formats. The attributes of the
store will help consumers to differentiate the store format. For example, the
study suggests that consumers shop in hypermarkets because of the wide
selection of merchandise and competitive pricing. On the other hand,
traditional grocery stores were selected by the primary shopper due to the
convenient location, which is usually within the neighbourhood area. Thus, the
retail store image should be based upon the priorities of the store‘s target
market. They must be able to differentiate clearly from others, in order to
attract the intended target market segment.
Therefore, careful consideration of attributes to build up the store image and
attract consumers is an imperative task for retailers. It is important for them to
understand why their business is affected and how they can maintain
consumer loyalty.
81
6.4 Limitations of the study
The study faces some limitations, which are explained below:
i. This study was limited to consumers in the Klang Valley area only,
which may not be truly representative of the total market. This is
because, as mentioned earlier, traditional grocery stores are losing
their market share to the new emergents in large cities, but is still
strong in rural areas. Thus, consumers in the Klang Valley might have
a preference towards the new retail format compared to the traditional
grocery stores. The results might be different if other states or smaller
towns were included in this study.
ii. The study only focused on six factors (products, price, promotion,
services), to examine the impact of store attributes on customers
behaviours. There are still many other factors that can be taken into
consideration, such as consumer‘s attitude towards the store.
iii. The findings of this research are interpreted within a sample size of
300, which is considered small. A larger sample might produce
different results and different implications. A larger and diverse sample
is able to produce more generalized results.
Despite the above shortcomings, the findings of the research could provide
insights into the impact of store attributes towards consumer‘s re-patronage
intention.
82
6.5 Suggestion for Further Research
There are many areas on which further research can be conducted to gain a
better understanding of consumer behaviour in the grocery market in
Malaysia. First, as this study is limited in location and sample size,
subsequent research should consider a larger and more diverse sample
drawn from every part of the country. This is because a geographically and
demographically diverse sample is important for the purpose of clear
generalizability.
Second, the impact of consumer demographics was not studied here. Many
previous studies have found that consumer demographics play an important
role in affecting consumer behaviour. It was found that consumer
demographics will affect their format choice and also perception of the
important of attributes. Thus, it would be useful to examine the relationship of
consumer demographics and store attributes or format choice. This will help
identify the profile of consumers who frequent specific formats and examine
store attributes as the driver of their format choice.
Lastly, it is also important to examine store loyalty from a different or broader
perspective. Although store attributes play an important role in affecting
consumer‘s behaviour, it is not the only key to store loyalty. Other factors such
as consumer‘s attitude towards the store, shopper‘s characteristics or
motivation may also become one of the important factors that influence
consumer behaviour.

83
6.6 Concluding Remarks
Malaysia has experienced dramatic changes in the retailing industry in recent
decades, with the emergence of new retail formats such as hypermarkets,
supermarkets and convenience stores. As a result, it has affected the way
consumers shop as they have more choices to choose from. Thus, it is
important for the grocery retailers in Malaysia to understand the factors that
influence consumers‘ behaviour. The findings obtained from this study will be
able to help grocery retailers in designing their marketing strategy to tackle
the fierce competition in the present retail channels in the grocery industry.
84
BIBLIOGRAPHY
Alba, J.W., Mela, C.F., Shimp, T.A. and Urbany, J.E. (1999), ―The Effect of Discount Frequency and Depth on Consumer Price Judgments‖, Journal of Consumer Research, Vol. 26, No. 2, pp.99-114.
Armsrtong, G., Kotler, P. and Silva, G. (2005), Marketing: An Introduction, An Asian Perspective, Prentice Hall. Backstrom, K. and Johansson, U. (2006), ―Creating and Consuming Experiences in Retail Store Environments: Comparing Retailer and Consumer Perspectives‖, Journal of Retailing and Consumer Services, 13, 417-430.
Bell, D.R. and Lattin, J.M. (1998), ―Shopping Behavior and Consumer Preference for Store Price Format: Why ‗Large Basket‘ Shopper Prefer EDLP‖, Marketing Science, Vol. 17, No. 1 pp.66-88.
Bitner, M.J. (1992), ―Servicescapes: The Impact of Physical Surroundings on Customers and Employees‖, Journal of Marketing, Vol. 56, pp.57-71. Burt, S. and Sparks, L. ―Understanding Retail Grocery Store Format Change in Great Britain: The Continental European Dimension‖, Retailing: Theories and Practice, Vol. 7, 1994, pp.139-142.
Carpenter, J.M. (2008), ―Demographics and Patronage Motives of Supercenter Shopper in the United States‖, International Journal of Retail & Distribution Management, Vol. 31, No. 1, pp. 5-16. Carpenter, J.M. and Moore, M. (2005), ―Consumer Preferences for Retail Formats: Implications for Tenant Mix Strategies‖, Journal of Shopping Center Research, Vol. 12, No. 1, pp.1-17.
Carpenter, J.M. and Moore, M. (2006), ―Consumer Demographics, Store Attributes and Retail Format Choice in the US Grocery Market‖, International Journal of Retail & Distribution Management, Vol. 34 No.6, pp. 434-452. Cavana, R.Y., Delahaye, B.L. and Sekaran, U. (2001), ―Applied Business Research: Qualitative and Quantitative Methods‖, John Wiley & Sons Australia, Ltd.
Chaudhuri, A. and Hoibrook, M.B. (2001), ―The Chain of Effects from Brand Trust and Brand Affect to Brand Performance: The Role of Brand Loyalty‖, Journal of Marketing, Vol. 65, pp. 81-93. Chevalier, M. (1975). ―Increase in Sales Due to In-Store Display‖, Journal of Marketing Research, Vol. 12, 426-431. Clarkson, R.M., Clarke-Hill, C., and Robinson, T. (1996), ―UK Supermarket Location Assessment‖, International Journal of Retail & Distribution Management, Vol. 24, No. 6, pp. 22-33.
85
Davies, G. and Rands, T. (1992), ―The Strategic Use of Space by Retailers: A Perspective from Operations Management‖, International Journal of Logistics Management, Vol. 3 No. 2, pp. 63-76.
Doreen, C.L.T. and Benjamin, L.B.T (2003), ―Linking Consumer Perception to Preference of Retail Stores: An Empirical Assessment of the Multi-Attributes of Store Image‖, Journal of Retailing and Consumer Services 10, pp.193-200. Engel, J.F., Blackwell, R.D. and Miniard P.W. (1993), Consumer Behavior, 7th ed., Harcourt Brace Jovanovich College Publishers, New York, NY.
Euromonitor (2008), Retailing.
Farhangmehr, M., Marques, S., and Silva,J. (2000), ― Consumer and Retailer Perceptions of Hypermarkets and Traditional Retail Stores in Portugal‖, Journal of Retailing and Consumer Services 7, pp. 197-206. Fox, E.J., Montgomery, A.L. and Lodish, L.M (2004), ―Consumer Shopping and Spending Across Retail Formats‖, Journal of Business, Vol. 77 No. 2, pp. S25-S60.
Goldman, A. and Hino, H. (2005), ―Supermarket vs. Traditional Retail Stores: Diagnosing the Barriers to Supermarket‘s Market Share Growth in an Ethnic Minority Community‖, Journal of Retailing and Consumer Services 12, pp. 273-284.
Grace, D. and Cass, A. (2005), ―An Examination of the Antecedents of Repatronage Intention across Different Retail Store Formats‖, Journal of Retailing and Consumer Service 12, pp. 227-243. Guy, M.C. (1980), ―Retail Location and Retail Planning in Britain‖, University of Wales‖ Institute of Science and Technology. Hansen, R.A. and Deutcher, T. (1977/1978), ―An Empirical Investigation of Attributes Importance in Retail Store Selection‖, Journal of Retailing, Vol. 53, pp. 58-72. Hoch, S.J, Bradlow, E.T, Wansink, B. (1999), ―The Variety of an Assortment‖, Marketing Science, Vol. 18, pp. 527–46.
Jin, B. and Kim, J.O (2003), ―A Typology of Korean Discount Shoppers: Shopping Motives, Store Attributes, and Outcomes‖, International Journal of Service Industry Management, Vol. 14, No.4, pp. 396-419. Kahn B.E, Lehmann D.R. (1991), ―Modelling Choice among Assortments‖, Journal of Retailing, Vol. 67, pp.274–99.
Kim, J.O. and Jin, B. (2001), ―Korean Consumers‘ Patronage of Discount Stores: Domestics vs. Multinational Discount Store Shoppers‘ Profiles‖, Journal of Consumer Marketing, Vol. 18. No 3, pp. 236- 255.
86
Knox, S.D., and Denison, T.J. (2000), ―Store Loyalty: Its Impact on Retail Revenue: An Empirical Study of Purchasing Behavior in the UK‖, Journal of Retailing and Consumer Services 7, pp.33-45. Kolodinsky, J. and Cranwell, M. (2000), ―The Poor Pay More? Now They Don‘t Even Have a Store to Choose From: Bringing a Supermarket Back to the City‖, Consumer Interest Annual, Vol. 26. Kotler, P. (1973-1974), ―Atmospherics as a Marketing Tool‖, Journal of Retailing, Vol. 49, No. 4, pp. 48-64. Kotler, P. and Keller, K.L (2006), ―Marketing Management‖, 12 edition, Pearson Prentice Hall. Koo, D.M. (2003), ―Inter-relationship among Store Images, Store Satisfaction, and Store Loyalty among Korea Discount Retail Patrons‖, Asia Pacific Journal of Marketing and Logistics, Vol. 15, No. 4, pp. 42-71. KPMG (2006), ―Grocery Retailing in Asia Pacific‖, Hong Kong Kumar, V. and Leone, R.P. (1998), ―Measuring the Effect of Retail Store Promotions on Brand and Store Substitution‖, Journal of Marketing Research, Vol. 25, pp.178-185.
Lamb, Charles W., Hair, Joseph F. and McDaniel, Carl, (2004), Marketing, 7th edition, Thomson South-Westwern. Lim, Y.K, Badarulzaman, N., Ahmad, A.G. (2003), ―Retail Activity in Malaysia: From Shophouse to Hypermarket‖, Paper presented at the Pacific Rim Real Estate Society 9th Annual Conference, 20-22 January 2003, University of Queensland and Queensland University of Technology, Brisbane, Australia. Lichtenstein, D.R., Ridway, N.M. and Netemeyer, R.G. (1993), ‗Price Perceptions and Consumer Shopping Behavior: A Field Study‖, Journal of Marketing Research, Vol. 30, No.2, pp. 234-245. Lindquist, J.D. (1974-1975), ―Meaning of Image – A Survey of Empirical and Hypothetical Evidence‖, Journal of Retailing, Vol. 50, winter, pp.51-61. Malaysia (2003) Mid-term Review of the Eight Malaysia Plan 2001-2005. Kuala Lumpur: Government Printers. Martineau, P. (1958), ―The Personality of the Retail Store‖, Harvard Business Review 36, pp.47-55. Martinez, E. and Montaner, T. (2006), ―The Effect of Consumer‘s Psychographic Variables Upon Deal-Proneness‖, ―Journal of Retailing and Consumer Services 13, pp.157-168.
87
Miller, Kenneth E, and and Layton, R.A. (2000) ―Fundamentals of Marketing‖ 4th Edition, McGraw Hill. Monroe, K.B., and Lee, A.V. (1999), ―Remembering versus Knowing: Issues in Buyers‘ Processing of Price Information‘, Journal of Academy of Marketing Science, Vol. 27, No. 2, pp. 207-225.
Moore, M. and Carpenter, J.M. (2008), ―An Examination of Consumer Price Cue Usage in US Discount Formats‖, International Journal of Retail & Distribution Management, Vol. 36 No.5, pp 345-359. Morganosky, M.A. (1997), ―Format Change in US Grocery Retailing‖, International Journal of Retail & Distribution Management, Vol. 25, No. 6, pp. 211-218. Moschis, G.P. (2003), ―Marketing to Older Adults: An Update Overview of Present Knowledge and Practice‖, Journal of Consumer Marketing, Vol. 20, No. 6, pp. 516-525. Nguyen, T.T.M, Nguyen, T.D. and Barrett, N.J. (2007), ―Hedonic Shopping Motivations, Supermarket Attributes, and Shopper Loyalty in Transitional Markets: Evidence from Vietnam‖, Asia Pacific Journal of Marketing, Vol. 19, No. 3, pp. 227-239. Oliver, R.L. (1999), ―Whence Consumer Loyalty‖, Journal of Marketing, Vol. 63, pp.33-44.
Osman, M.Z. (2001), ―A Conceptual Model of Retail Image Influences on Loyalty Patronage Behavior‖, The International Review of Retail, Distribution and Consumer Research, Vol.3, No.2, pp. 133-148
Ortinau, D. and Robert, A. (1989), ―Importance-Image Performance Analysis: A Technique to Aids Retailers in Developing Store Positioning Strategies‖, Marketing: Positioning for the 1990s, Southern Marketing Association, November, pp.108-113.
Rhee, H. and Bell, D.R. (2002), ―The Inter-Store Mobility of Supermarket Shopper‖, Journal of Retailing, Vol. 50, pp. 225-237. Raghubir, P., Inman, J. and Grande, H. (2004), ―The Three Faces of Consumer Promotions‖, California Management Review, Vol. 46, No. 4, pp.23-42 Ruiz, M.P.M, and Descales, A.M. (2008), ―Retail Price Promotion Influences for Product Variety in Grocery Stores: Evidence from Spain‖, International Journal of Retail & Distribution Management, Vol. 36, No. 6, pp.494-517.
Seiders, K. and Tigert, D.J. (2000), ―The Impact of Supercenters on Traditional Food Retailers in Four Markets‖, International Journal of Retail & Distribution Management, Vol. 28, No. 4/5, pp.181-193.
88
Singh, V.P., Hansen, K.T., and Blattberg R.C. (2004), ―Impact of Wal-Mart Supercenter Entry on Consumer Purchase Behavior: An Empirical Investigation‖. Sivakumar, K. (2003), ―Price-tier Competition: Distinguishing Between Intertier Competition and Intratier Competition‖, Journal of Business Research, Vol. 56, No.12, pp.947-959. Swan, J.E. and Trawick, I.F. (1981), ―Disconfirmation of Expectation and Satisfaction with a Retail Service‖, Journal of Retailing, Vol. 57, No. 3, pp. 49-67 Tabachnick, B.G., and Fidell, L.S. (1996), ―Using Multivariate Statistic‖, 3rd Edition, New York: Harper Collins Turley, L.W. and Miliman, R.E. (2000), ―Atmospheric Effects on Shopping Behavior: A Review of the Experimental Evidence‖, Journal of Business Research, Vol. 49, No. 2, pp. 193-211. Westbrook, R.A. (1981), ―Sources of Consumer Satisfaction with Retail Outlets‖, Journal of Retailing, Vol. 57, No. 3, pp. 68-85 Winsted, K.F. (1997). ―The Service Experience in Two Cultures: A Behavioral Perspective‖, Journal of Retailing, Vol. 73, No. 3, pp. 337-360. Wisniewski, M. (2001), ―Using SERVQUAL to Assess Customer Satisfaction with Public Sector Services‖, Managing Service Quality, Vol. 11, No.6, pp.380-388. Wood, S. and Browne, S. (2007), ―Convenience Store Location Planning and Forecasting – A Practical Research Agenda‖, International Journal of Retail & Distribution Management, Vol. 35, No.4, pp. 233-255. Woodside, A.G. and Trappey, R.J. (1992), ―Finding out Why Customers Shop at Your Store and Buy Your Brand: Automatic Cognitive Processing Model of Primary Choice‖, Journal of Advertising Research, Vol. 32, pp.59-78.
89
APPENDIX 1 QUESTIONNAIRE
UNIVERSITI MALAYA
FACULTY OF BUSINESS & ACCOUNTANCY
MASTER OF BUSINESS ADMINISTRATION
Research Title: The Impact of Store Attributes on Consumer Shopping
Behaviour: A study in the Grocery Industry
Dear Sir/Madam,
I am conducting a study on consumer grocery shopping behavior in Malaysia. This
reserach is conducted as a partial requirement for the completion of the Master of
Business Administration, University of Malaya.
I would appreciate if you could spend a few minutes (not more than 10 minutes) of
your time to answer the questions in the following pages. All information will be used
for academic purpose only and will be kept strictly private and confidential.
Your kind cooperation and participation in this survey is valued and highly
appreciated.
This research is conducted under the supervision of Dr. Yusniza Kamarulzaman.
Should you have any enquiries, please do not hesitate to contact me at 012-2081048
or email me at [email protected].
Sincerely, Supervisor,
Lee Wei Ting Dr. Yusniza Kamarulzaman
Master of Business Administration (MBA) Tel: 03- 7967 3915
University of Malaya Email :[email protected]
Level 2, Block C
City Campus Complex
Jalan Tun Ismail
50480 Kuala Lumpur
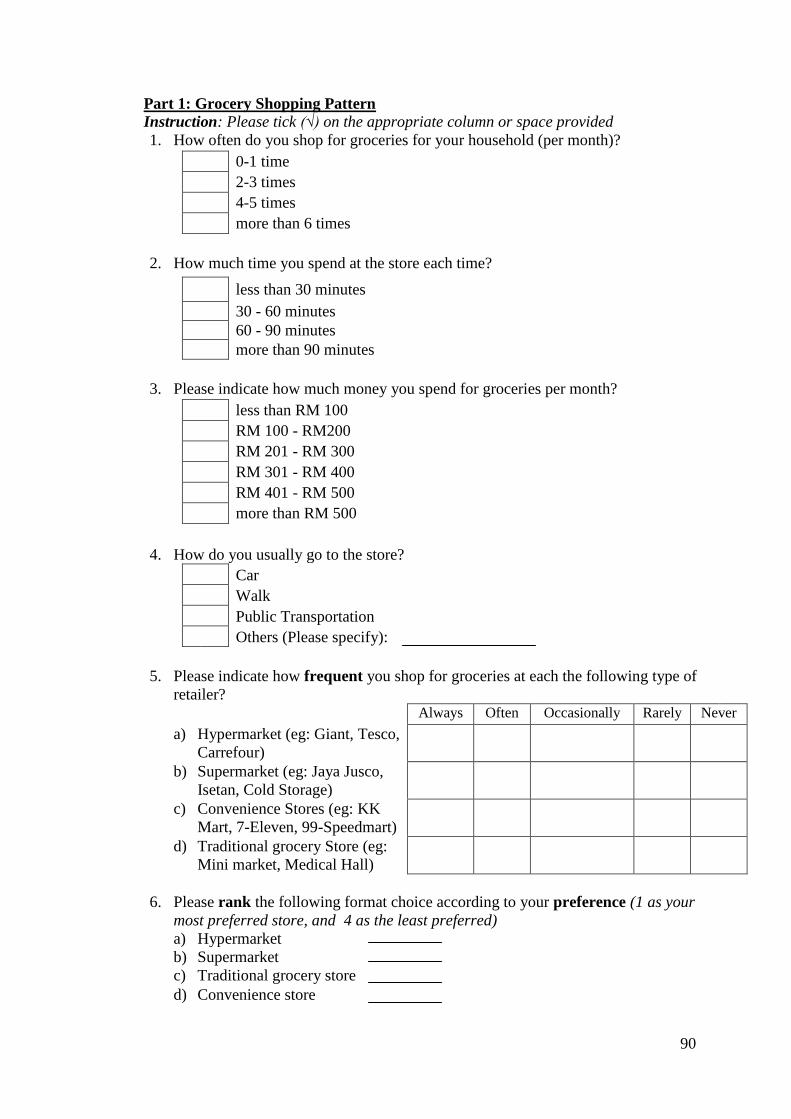
90
Part 1: Grocery Shopping Pattern
Instruction: Please tick (√) on the appropriate column or space provided
1. How often do you shop for groceries for your household (per month)?
0-1 time
2-3 times
4-5 times
more than 6 times
2. How much time you spend at the store each time?
less than 30 minutes
30 - 60 minutes
60 - 90 minutes
more than 90 minutes
3. Please indicate how much money you spend for groceries per month?
less than RM 100
RM 100 - RM200
RM 201 - RM 300
RM 301 - RM 400
RM 401 - RM 500
more than RM 500
4. How do you usually go to the store?
Car
Walk
Public Transportation
Others (Please specify):
5. Please indicate how frequent you shop for groceries at each the following type of
retailer?
Always Often Occasionally Rarely Never
a) Hypermarket (eg: Giant, Tesco,
Carrefour)
b) Supermarket (eg: Jaya Jusco,
Isetan, Cold Storage)
c) Convenience Stores (eg: KK
Mart, 7-Eleven, 99-Speedmart)
d) Traditional grocery Store (eg:
Mini market, Medical Hall)
6. Please rank the following format choice according to your preference (1 as your
most preferred store, and 4 as the least preferred)
a) Hypermarket
b) Supermarket
c) Traditional grocery store
d) Convenience store
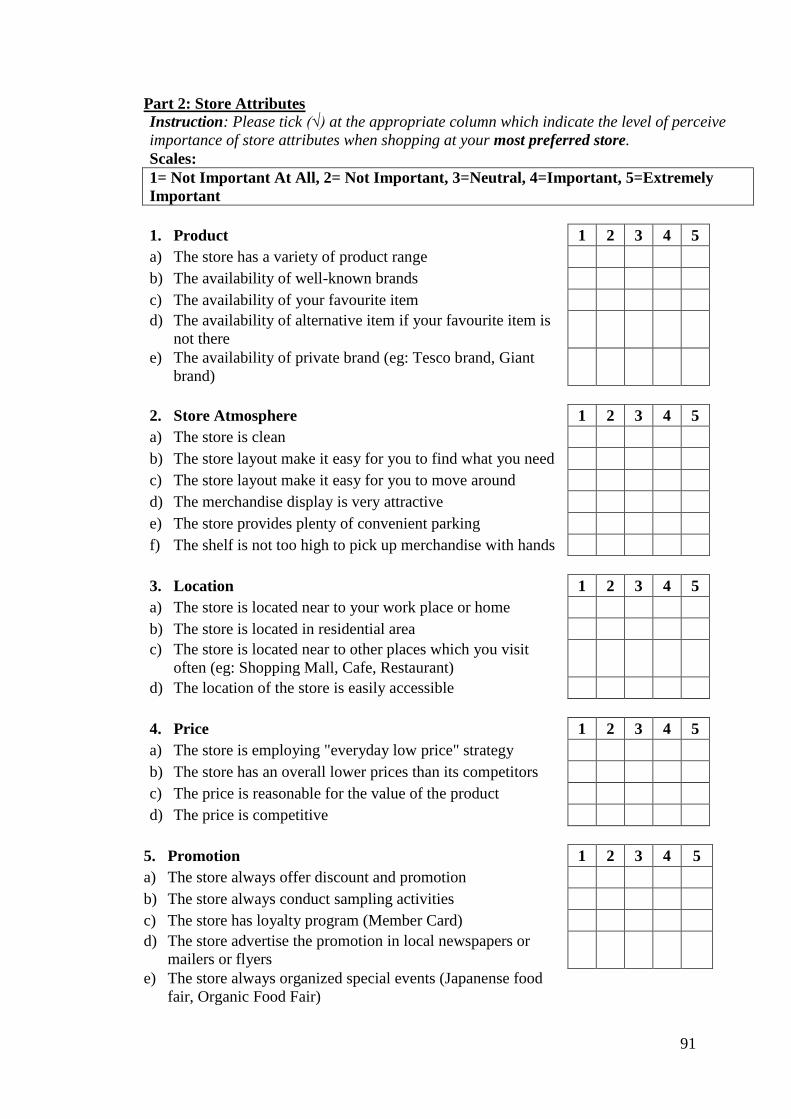
91
Part 2: Store Attributes
Instruction: Please tick (√) at the appropriate column which indicate the level of perceive
importance of store attributes when shopping at your most preferred store.
Scales:
1= Not Important At All, 2= Not Important, 3=Neutral, 4=Important, 5=Extremely
Important
1. Product 1 2 3 4 5
a) The store has a variety of product range
b) The availability of well-known brands
c) The availability of your favourite item
d) The availability of alternative item if your favourite item is
not there
e) The availability of private brand (eg: Tesco brand, Giant
brand)
2. Store Atmosphere 1 2 3 4 5
a) The store is clean
b) The store layout make it easy for you to find what you need
c) The store layout make it easy for you to move around
d) The merchandise display is very attractive
e) The store provides plenty of convenient parking
f) The shelf is not too high to pick up merchandise with hands
3. Location 1 2 3 4 5
a) The store is located near to your work place or home
b) The store is located in residential area
c) The store is located near to other places which you visit
often (eg: Shopping Mall, Cafe, Restaurant)
d) The location of the store is easily accessible
4. Price 1 2 3 4 5
a) The store is employing "everyday low price" strategy
b) The store has an overall lower prices than its competitors
c) The price is reasonable for the value of the product
d) The price is competitive
5. Promotion 1 2 3 4 5
a) The store always offer discount and promotion
b) The store always conduct sampling activities
c) The store has loyalty program (Member Card)
d) The store advertise the promotion in local newspapers or
mailers or flyers
e) The store always organized special events (Japanense food
fair, Organic Food Fair)

92
6. Services 1 2 3 4 5
a) The employees are helpful
b) The employees provide prompt services
c) The employees are courteous
d) The store insists on error-free sales transactions and
records
e) The store accept most major credit cards
f) The store has operation hours convenient to you
g) The store has many cashier counters to shorten the
queue
Part 3: Satisfaction
Instruction: Please tick (√) at the appropriate column which most closely matches
your feeling after visiting the store
Scales:
1= Strongly Disagree, 2= Disagree, 3=Neutral, 4=Agree, 5=Strongly Agree
1 2 3 4 5
1. The store meet my expectation
2. The store does a good job of satisfying my needs
3. I believe that using this store is a very satisfying experience
4. I am satisfied with my decision to shop at this store
5. I made a wise judgement to shop at this store
6. I made the right decision when I decided to shop at this
store
Part 4: Repatronage Intention
Instruction: Please tick (√) at the appropriate column which most closely matches
your intention after visiting the store
Scales:
1= Strongly Disagree, 2= Disagree, 3=Neutral, 4=Agree, 5=Strongly Agree
1 2 3 4 5
1. I plan to maintain my shopping at this store
2. I will frequently shop at this store in the future
3. I will very likely to shop at this store in the future
4. Shopping in this store is my first choice or priority
5. I intend to shop at this store again in the future
Scales:
1= Not Important At All, 2= Not Important, 3=Neutral, 4=Important, 5=Extremely
Important
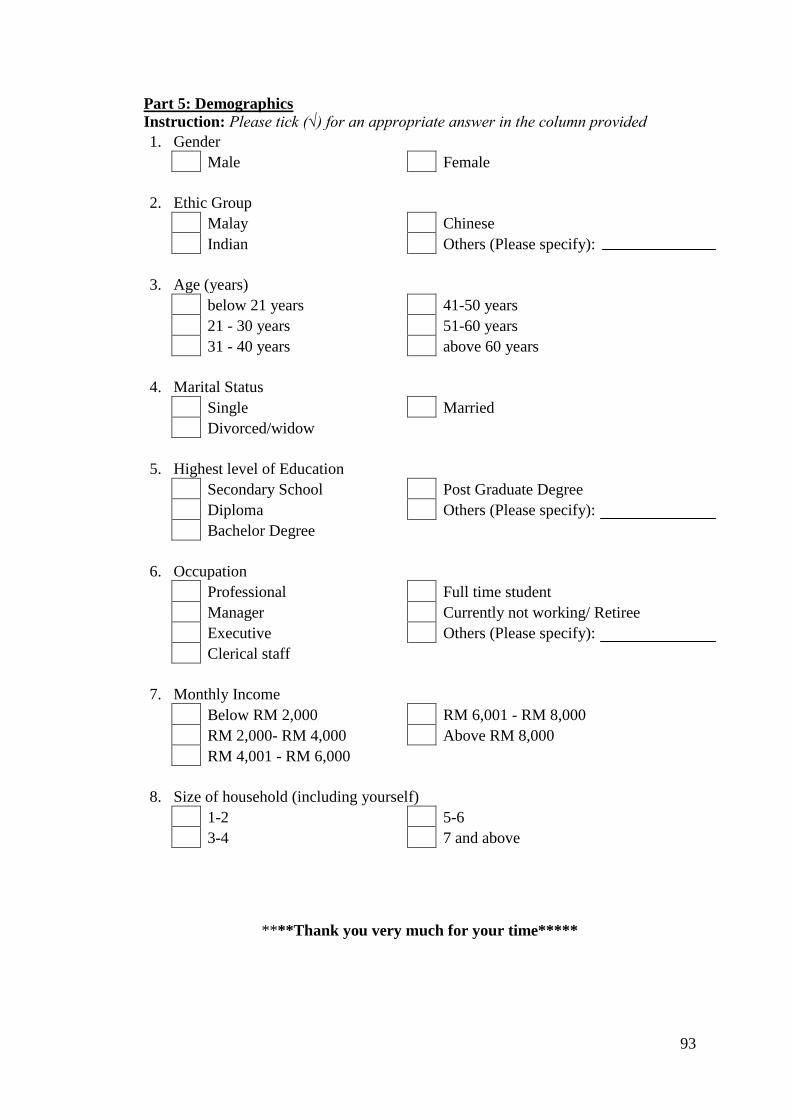
93
Part 5: Demographics
Instruction: Please tick (√) for an appropriate answer in the column provided
1. Gender
Male Female
2. Ethic Group
Malay Chinese
Indian Others (Please specify):
3. Age (years)
below 21 years 41-50 years
21 - 30 years 51-60 years
31 - 40 years above 60 years
4. Marital Status
Single Married
Divorced/widow
5. Highest level of Education
Secondary School Post Graduate Degree
Diploma Others (Please specify):
Bachelor Degree
6. Occupation
Professional Full time student
Manager Currently not working/ Retiree
Executive Others (Please specify):
Clerical staff
7. Monthly Income
Below RM 2,000 RM 6,001 - RM 8,000
RM 2,000- RM 4,000 Above RM 8,000
RM 4,001 - RM 6,000
8. Size of household (including yourself)
1-2 5-6
3-4 7 and above
****Thank you very much for your time*****

94
APPENDIX II SPSS OUTPUT Frequency of Respondent Gender
Frequency Percent Valid
Percent Cumulative
Percent
Valid Male 143 45.3 45.3 45.3 Female 173 54.7 54.7 100.0 Total 316 100.0 100.0
Ethic Group
Frequency Percent Valid
Percent Cumulative
Percent
Valid Malay 137 43.4 43.4 43.4 Indian 51 16.1 16.1 59.5 Chinese 122 38.6 38.6 98.1 Others 6 1.9 1.9 100.0 Total 316 100.0 100.0
Age
Frequency Percent Valid
Percent Cumulative
Percent
Valid Below 21 years 14 4.4 4.4 4.4 21-30 years 152 48.1 48.1 52.5 31-40 years 96 30.4 30.4 82.9 41-50 years 34 10.8 10.8 93.7 51-60 years 13 4.1 4.1 97.8 Above 60 years 7 2.2 2.2 100.0 Total 316 100.0 100.0
Education Level
Frequency Percent Valid
Percent Cumulative
Percent
Valid Secondary School 53 16.8 16.8 16.8 Diploma 51 16.1 16.1 32.9 Bachelor Degree 156 49.4 49.4 82.3 Post Graduate
Degree 51 16.1 16.1 98.4
Others 5 1.6 1.6 100.0 Total 316 100.0 100.0
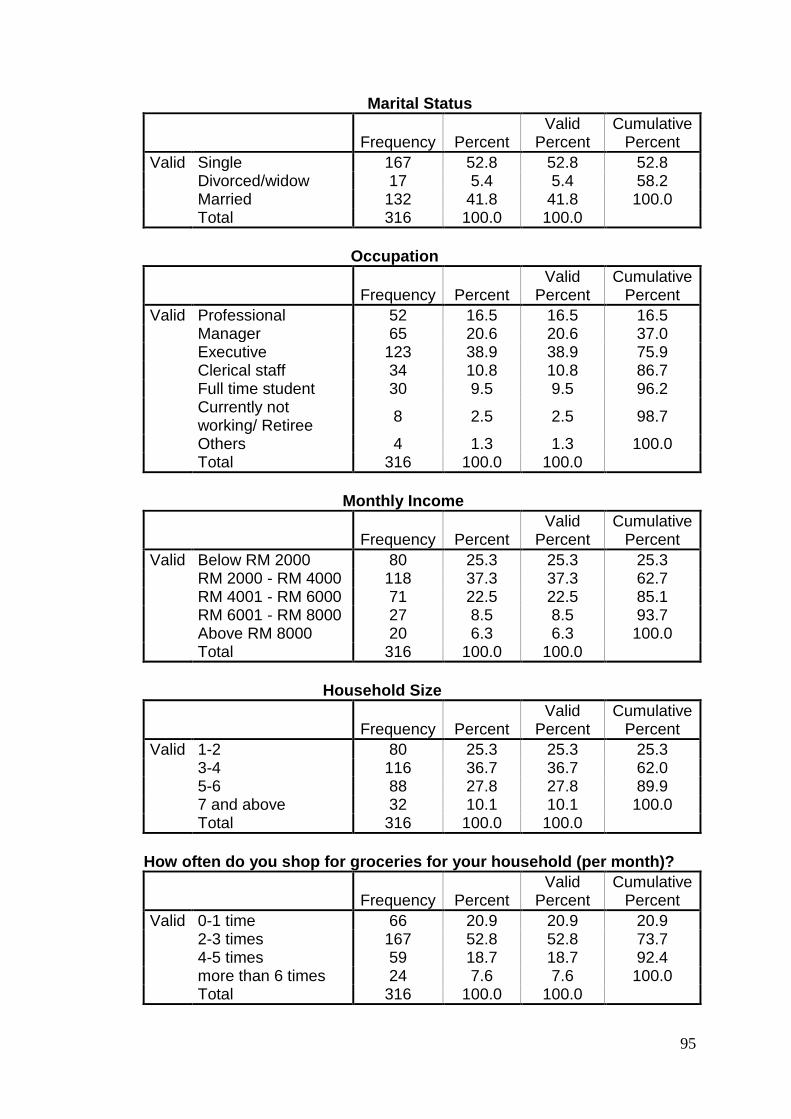
95
Marital Status
Frequency Percent Valid
Percent Cumulative
Percent
Valid Single 167 52.8 52.8 52.8 Divorced/widow 17 5.4 5.4 58.2 Married 132 41.8 41.8 100.0 Total 316 100.0 100.0
Occupation
Frequency Percent Valid
Percent Cumulative
Percent
Valid Professional 52 16.5 16.5 16.5 Manager 65 20.6 20.6 37.0 Executive 123 38.9 38.9 75.9 Clerical staff 34 10.8 10.8 86.7 Full time student 30 9.5 9.5 96.2 Currently not
working/ Retiree 8 2.5 2.5 98.7
Others 4 1.3 1.3 100.0 Total 316 100.0 100.0
Monthly Income
Frequency Percent Valid
Percent Cumulative
Percent
Valid Below RM 2000 80 25.3 25.3 25.3 RM 2000 - RM 4000 118 37.3 37.3 62.7 RM 4001 - RM 6000 71 22.5 22.5 85.1 RM 6001 - RM 8000 27 8.5 8.5 93.7 Above RM 8000 20 6.3 6.3 100.0 Total 316 100.0 100.0
Household Size
Frequency Percent Valid
Percent Cumulative
Percent
Valid 1-2 80 25.3 25.3 25.3 3-4 116 36.7 36.7 62.0 5-6 88 27.8 27.8 89.9 7 and above 32 10.1 10.1 100.0 Total 316 100.0 100.0
How often do you shop for groceries for your household (per month)?
Frequency Percent Valid
Percent Cumulative
Percent
Valid 0-1 time 66 20.9 20.9 20.9 2-3 times 167 52.8 52.8 73.7 4-5 times 59 18.7 18.7 92.4 more than 6 times 24 7.6 7.6 100.0 Total 316 100.0 100.0
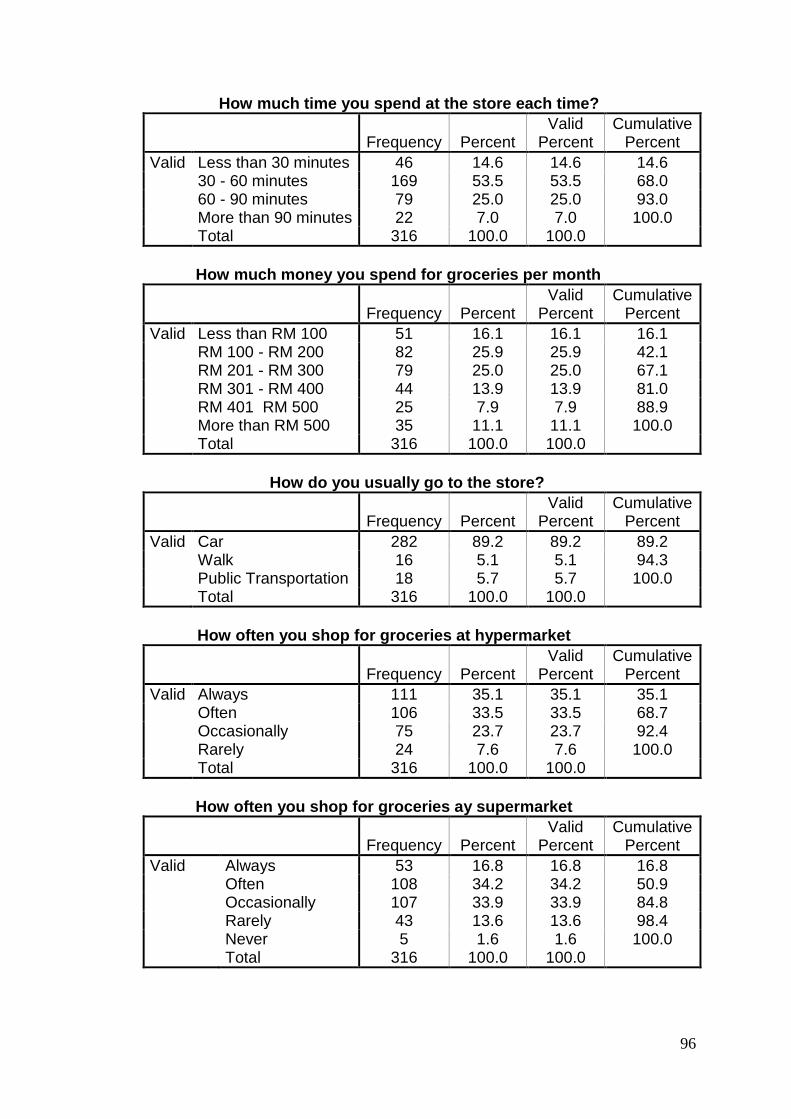
96
How much time you spend at the store each time?
Frequency Percent Valid
Percent Cumulative
Percent
Valid Less than 30 minutes 46 14.6 14.6 14.6 30 - 60 minutes 169 53.5 53.5 68.0 60 - 90 minutes 79 25.0 25.0 93.0 More than 90 minutes 22 7.0 7.0 100.0 Total 316 100.0 100.0
How much money you spend for groceries per month
Frequency Percent Valid
Percent Cumulative
Percent
Valid Less than RM 100 51 16.1 16.1 16.1 RM 100 - RM 200 82 25.9 25.9 42.1 RM 201 - RM 300 79 25.0 25.0 67.1 RM 301 - RM 400 44 13.9 13.9 81.0 RM 401 RM 500 25 7.9 7.9 88.9 More than RM 500 35 11.1 11.1 100.0 Total 316 100.0 100.0
How do you usually go to the store?
Frequency Percent Valid
Percent Cumulative
Percent
Valid Car 282 89.2 89.2 89.2 Walk 16 5.1 5.1 94.3 Public Transportation 18 5.7 5.7 100.0 Total 316 100.0 100.0
How often you shop for groceries at hypermarket
Frequency Percent Valid
Percent Cumulative
Percent
Valid Always 111 35.1 35.1 35.1 Often 106 33.5 33.5 68.7 Occasionally 75 23.7 23.7 92.4 Rarely 24 7.6 7.6 100.0 Total 316 100.0 100.0
How often you shop for groceries ay supermarket
Frequency Percent Valid
Percent Cumulative
Percent
Valid Always 53 16.8 16.8 16.8 Often 108 34.2 34.2 50.9 Occasionally 107 33.9 33.9 84.8 Rarely 43 13.6 13.6 98.4 Never 5 1.6 1.6 100.0 Total 316 100.0 100.0
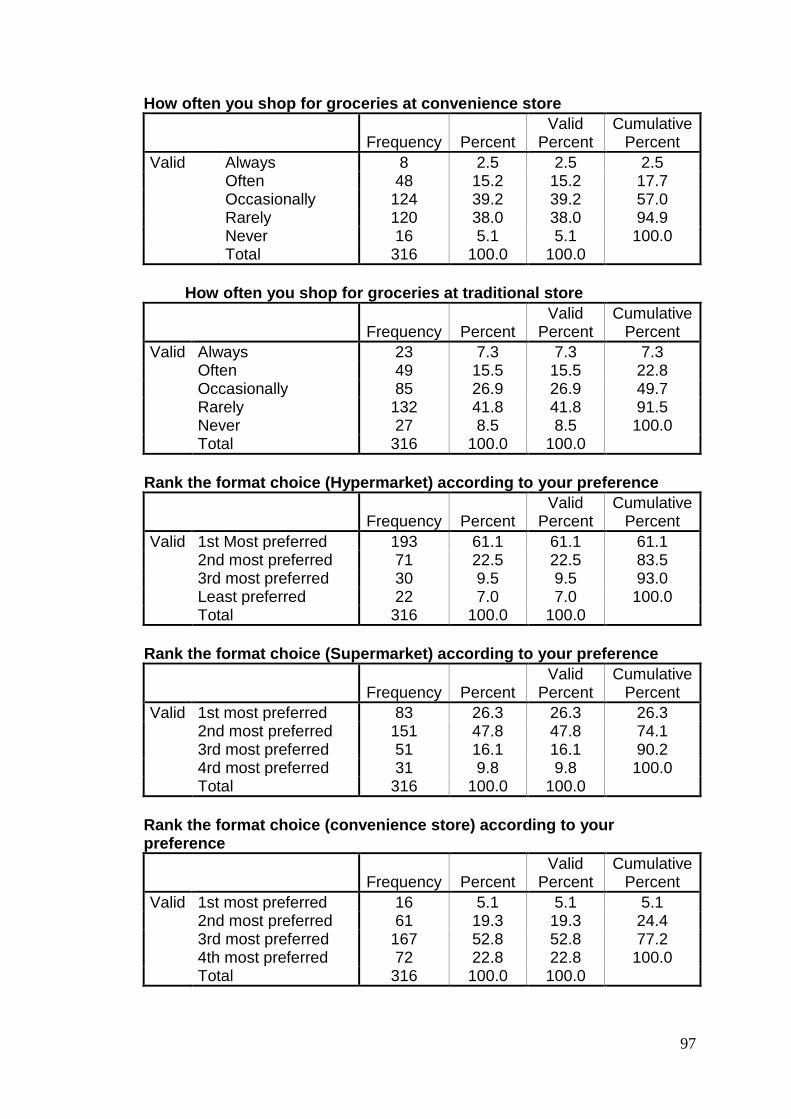
97
How often you shop for groceries at convenience store
Frequency Percent Valid
Percent Cumulative
Percent
Valid Always 8 2.5 2.5 2.5 Often 48 15.2 15.2 17.7 Occasionally 124 39.2 39.2 57.0 Rarely 120 38.0 38.0 94.9 Never 16 5.1 5.1 100.0 Total 316 100.0 100.0
How often you shop for groceries at traditional store
Frequency Percent Valid
Percent Cumulative
Percent
Valid Always 23 7.3 7.3 7.3 Often 49 15.5 15.5 22.8 Occasionally 85 26.9 26.9 49.7 Rarely 132 41.8 41.8 91.5 Never 27 8.5 8.5 100.0 Total 316 100.0 100.0
Rank the format choice (Hypermarket) according to your preference
Frequency Percent Valid
Percent Cumulative
Percent
Valid 1st Most preferred 193 61.1 61.1 61.1 2nd most preferred 71 22.5 22.5 83.5 3rd most preferred 30 9.5 9.5 93.0 Least preferred 22 7.0 7.0 100.0 Total 316 100.0 100.0
Rank the format choice (Supermarket) according to your preference
Frequency Percent Valid
Percent Cumulative
Percent
Valid 1st most preferred 83 26.3 26.3 26.3 2nd most preferred 151 47.8 47.8 74.1 3rd most preferred 51 16.1 16.1 90.2 4rd most preferred 31 9.8 9.8 100.0 Total 316 100.0 100.0
Rank the format choice (convenience store) according to your preference
Frequency Percent Valid
Percent Cumulative
Percent
Valid 1st most preferred 16 5.1 5.1 5.1 2nd most preferred 61 19.3 19.3 24.4 3rd most preferred 167 52.8 52.8 77.2 4th most preferred 72 22.8 22.8 100.0 Total 316 100.0 100.0
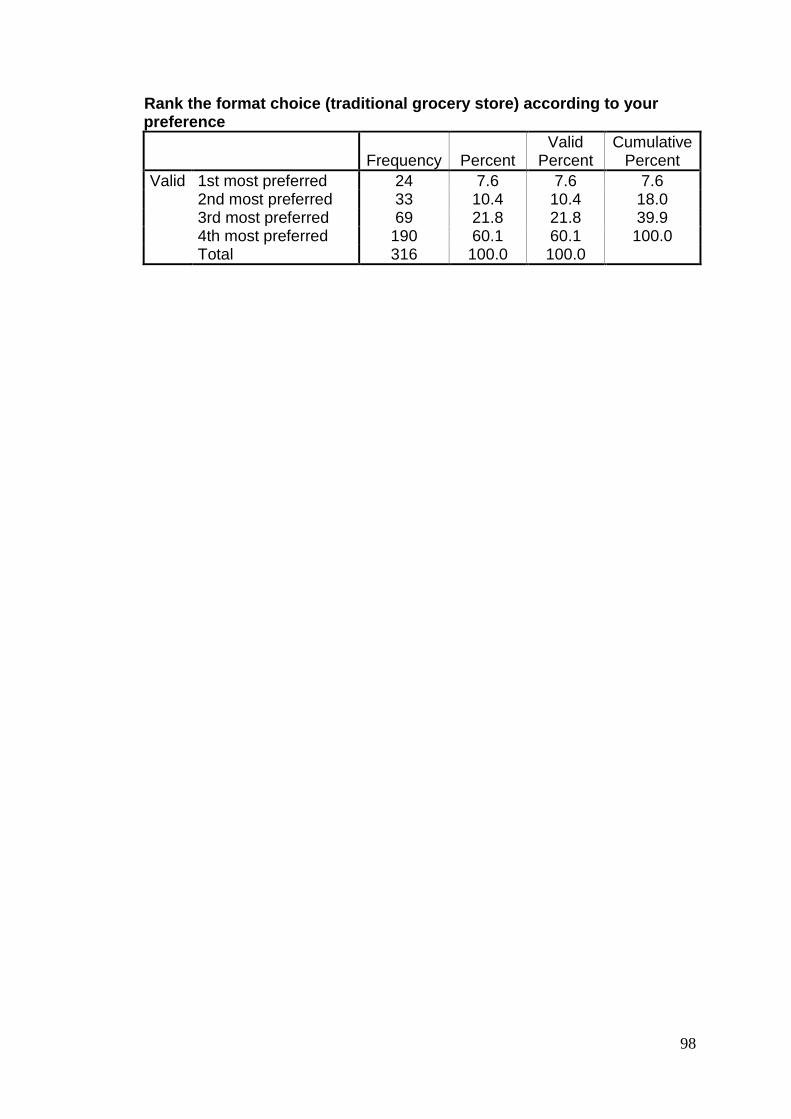
98
Rank the format choice (traditional grocery store) according to your preference
Frequency Percent Valid
Percent Cumulative
Percent
Valid 1st most preferred 24 7.6 7.6 7.6 2nd most preferred 33 10.4 10.4 18.0 3rd most preferred 69 21.8 21.8 39.9 4th most preferred 190 60.1 60.1 100.0 Total 316 100.0 100.0
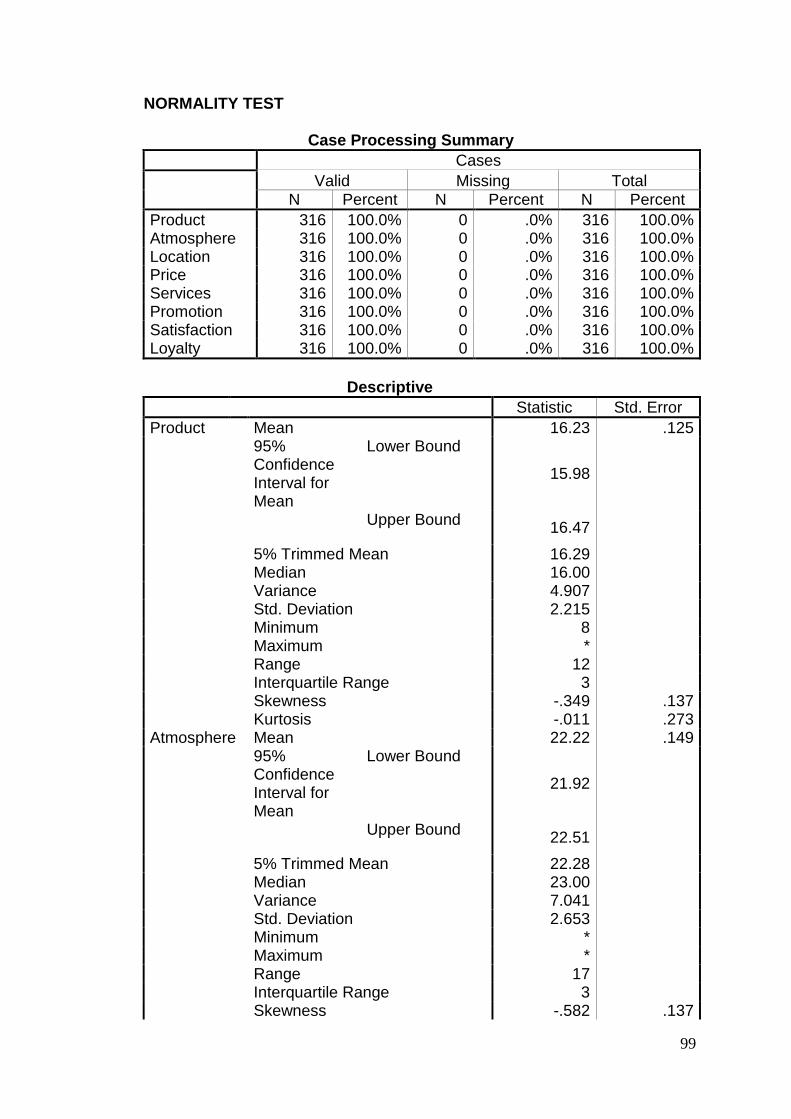
99
NORMALITY TEST Case Processing Summary
Cases
Valid Missing Total N Percent N Percent N Percent
Product 316 100.0% 0 .0% 316 100.0% Atmosphere 316 100.0% 0 .0% 316 100.0% Location 316 100.0% 0 .0% 316 100.0% Price 316 100.0% 0 .0% 316 100.0% Services 316 100.0% 0 .0% 316 100.0% Promotion 316 100.0% 0 .0% 316 100.0% Satisfaction 316 100.0% 0 .0% 316 100.0% Loyalty 316 100.0% 0 .0% 316 100.0%
Descriptive
Statistic Std. Error
Product Mean 16.23 .125 95%
Confidence Interval for Mean
Lower Bound
15.98
Upper Bound 16.47
5% Trimmed Mean 16.29 Median 16.00 Variance 4.907 Std. Deviation 2.215 Minimum 8 Maximum * Range 12 Interquartile Range 3 Skewness -.349 .137 Kurtosis -.011 .273 Atmosphere Mean 22.22 .149 95%
Confidence Interval for Mean
Lower Bound
21.92
Upper Bound 22.51
5% Trimmed Mean 22.28 Median 23.00 Variance 7.041 Std. Deviation 2.653 Minimum * Maximum * Range 17 Interquartile Range 3 Skewness -.582 .137
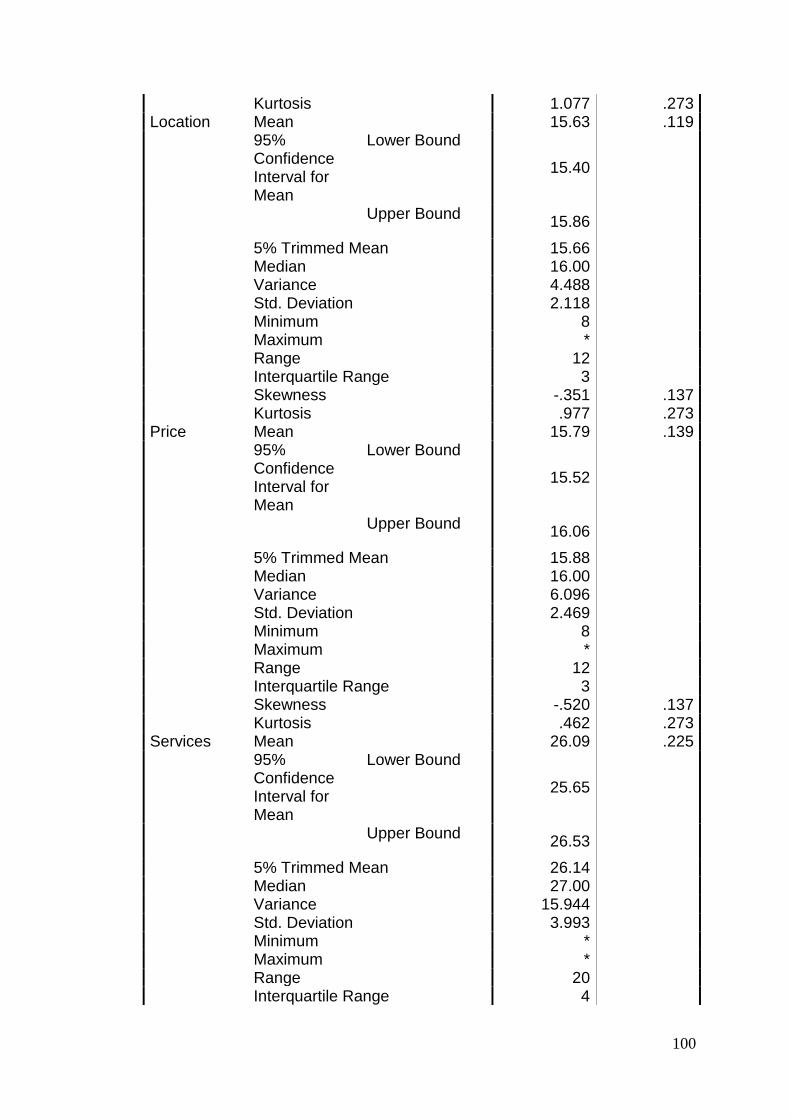
100
Kurtosis 1.077 .273 Location Mean 15.63 .119 95%
Confidence Interval for Mean
Lower Bound
15.40
Upper Bound 15.86
5% Trimmed Mean 15.66 Median 16.00 Variance 4.488 Std. Deviation 2.118 Minimum 8 Maximum * Range 12 Interquartile Range 3 Skewness -.351 .137 Kurtosis .977 .273 Price Mean 15.79 .139 95%
Confidence Interval for Mean
Lower Bound
15.52
Upper Bound 16.06
5% Trimmed Mean 15.88 Median 16.00 Variance 6.096 Std. Deviation 2.469 Minimum 8 Maximum * Range 12 Interquartile Range 3 Skewness -.520 .137 Kurtosis .462 .273 Services Mean 26.09 .225 95%
Confidence Interval for Mean
Lower Bound
25.65
Upper Bound 26.53
5% Trimmed Mean 26.14 Median 27.00 Variance 15.944 Std. Deviation 3.993 Minimum * Maximum * Range 20 Interquartile Range 4

101
Skewness -.292 .137 Kurtosis .086 .273 Promotion Mean 18.78 .174 95%
Confidence Interval for Mean
Lower Bound
18.44
Upper Bound 19.12
5% Trimmed Mean 18.88 Median 19.00 Variance 9.581 Std. Deviation 3.095 Minimum * Maximum * Range 15 Interquartile Range 4 Skewness -.438 .137 Kurtosis .379 .273 Satisfaction Mean 22.43 .196 95%
Confidence Interval for Mean
Lower Bound
22.04
Upper Bound 22.81
5% Trimmed Mean 22.52 Median 23.00 Variance 12.150 Std. Deviation 3.486 Minimum * Maximum * Range 17 Interquartile Range 5 Skewness -.353 .137 Kurtosis -.030 .273 Loyalty Mean 18.35 .171 95%
Confidence Interval for Mean
Lower Bound
18.01
Upper Bound 18.68
5% Trimmed Mean 18.41 Median 19.00 Variance 9.218 Std. Deviation 3.036 Minimum * Maximum * Range 15
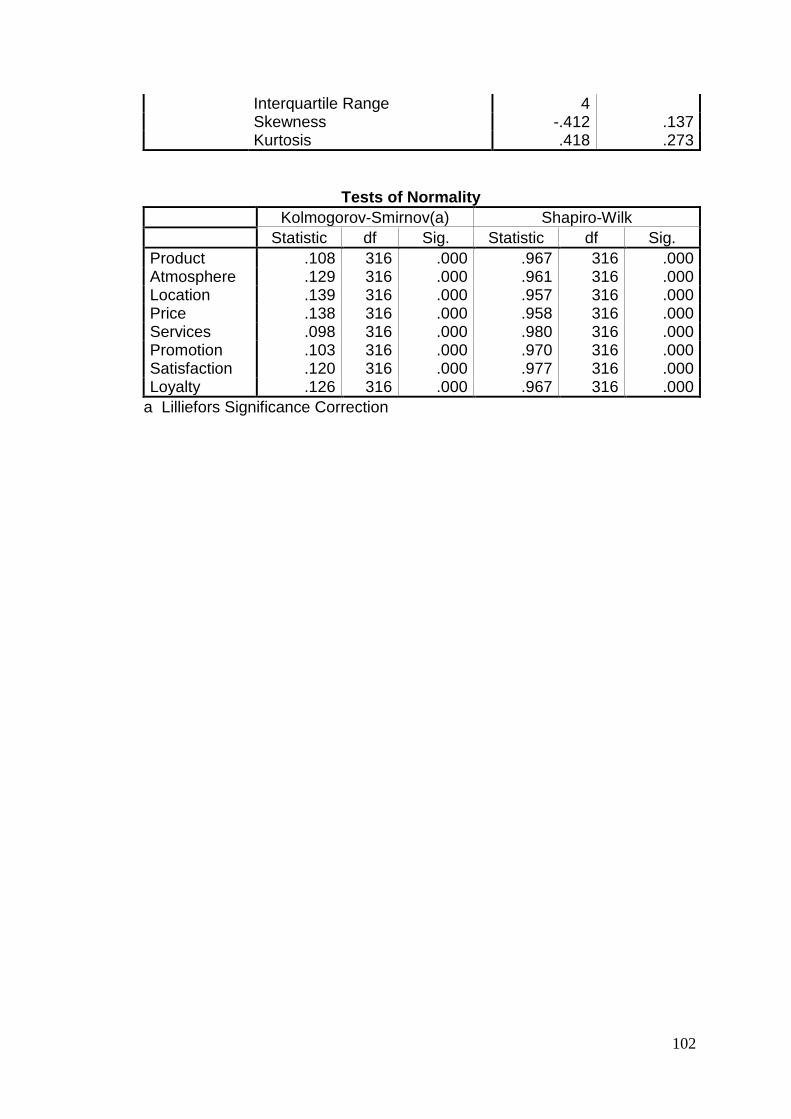
102
Interquartile Range 4 Skewness -.412 .137 Kurtosis .418 .273
Tests of Normality
Kolmogorov-Smirnov(a) Shapiro-Wilk
Statistic df Sig. Statistic df Sig.
Product .108 316 .000 .967 316 .000 Atmosphere .129 316 .000 .961 316 .000 Location .139 316 .000 .957 316 .000 Price .138 316 .000 .958 316 .000 Services .098 316 .000 .980 316 .000 Promotion .103 316 .000 .970 316 .000 Satisfaction .120 316 .000 .977 316 .000 Loyalty .126 316 .000 .967 316 .000
a Lilliefors Significance Correction
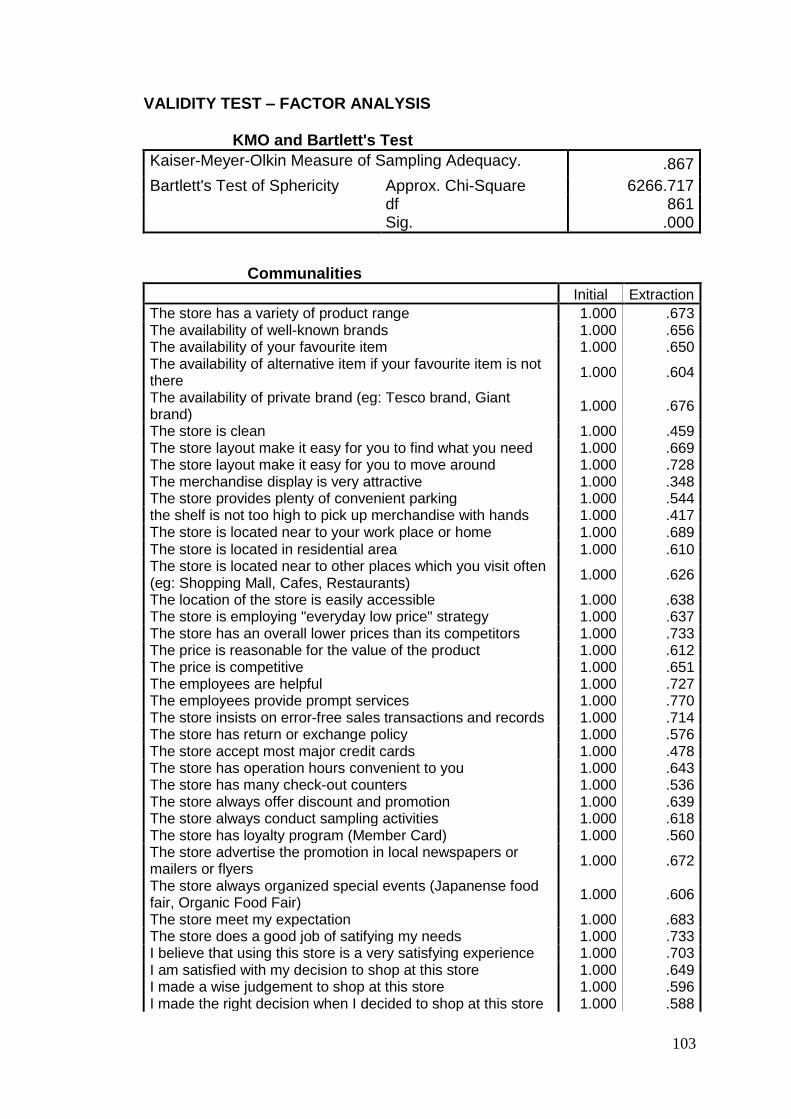
103
VALIDITY TEST – FACTOR ANALYSIS KMO and Bartlett's Test
Kaiser-Meyer-Olkin Measure of Sampling Adequacy. .867
Bartlett's Test of Sphericity Approx. Chi-Square 6266.717 df 861 Sig. .000
Communalities
Initial Extraction The store has a variety of product range 1.000 .673 The availability of well-known brands 1.000 .656 The availability of your favourite item 1.000 .650 The availability of alternative item if your favourite item is not there
1.000 .604
The availability of private brand (eg: Tesco brand, Giant brand)
1.000 .676
The store is clean 1.000 .459 The store layout make it easy for you to find what you need 1.000 .669 The store layout make it easy for you to move around 1.000 .728 The merchandise display is very attractive 1.000 .348 The store provides plenty of convenient parking 1.000 .544 the shelf is not too high to pick up merchandise with hands 1.000 .417 The store is located near to your work place or home 1.000 .689 The store is located in residential area 1.000 .610 The store is located near to other places which you visit often (eg: Shopping Mall, Cafes, Restaurants)
1.000 .626
The location of the store is easily accessible 1.000 .638 The store is employing "everyday low price" strategy 1.000 .637 The store has an overall lower prices than its competitors 1.000 .733 The price is reasonable for the value of the product 1.000 .612 The price is competitive 1.000 .651 The employees are helpful 1.000 .727 The employees provide prompt services 1.000 .770 The store insists on error-free sales transactions and records 1.000 .714 The store has return or exchange policy 1.000 .576 The store accept most major credit cards 1.000 .478 The store has operation hours convenient to you 1.000 .643 The store has many check-out counters 1.000 .536 The store always offer discount and promotion 1.000 .639 The store always conduct sampling activities 1.000 .618 The store has loyalty program (Member Card) 1.000 .560 The store advertise the promotion in local newspapers or mailers or flyers
1.000 .672
The store always organized special events (Japanense food fair, Organic Food Fair)
1.000 .606
The store meet my expectation 1.000 .683 The store does a good job of satifying my needs 1.000 .733 I believe that using this store is a very satisfying experience 1.000 .703 I am satisfied with my decision to shop at this store 1.000 .649 I made a wise judgement to shop at this store 1.000 .596 I made the right decision when I decided to shop at this store 1.000 .588
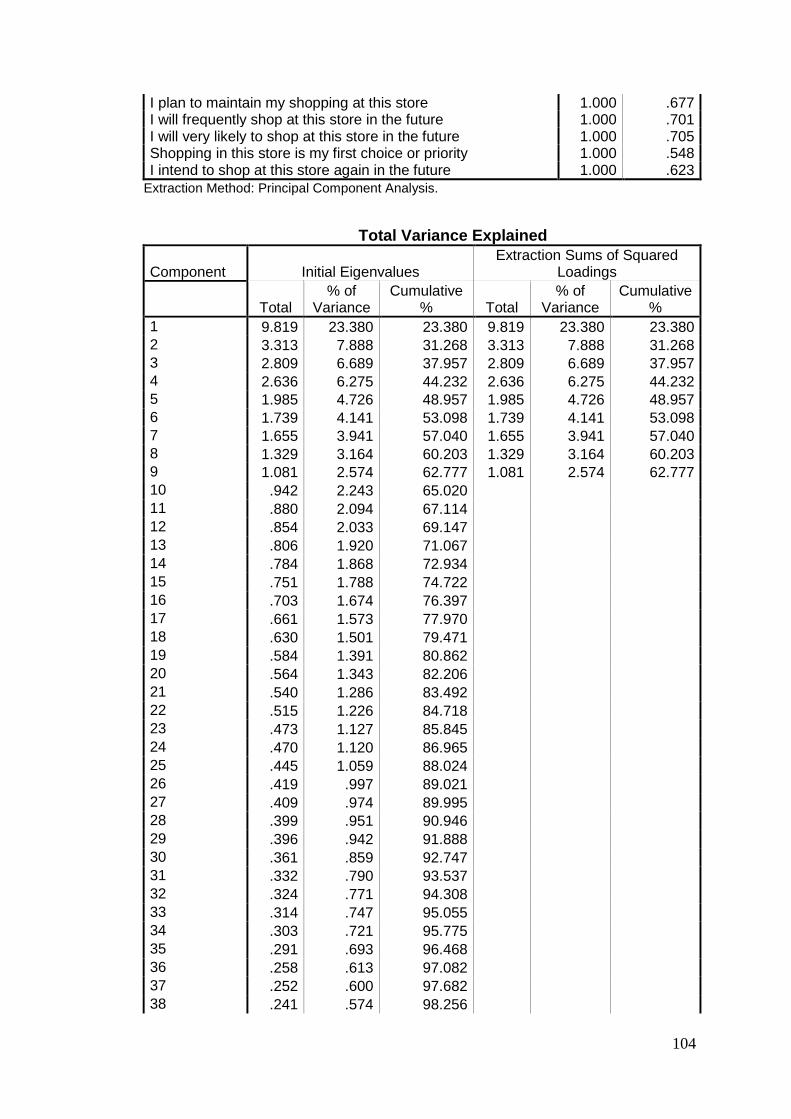
104
I plan to maintain my shopping at this store 1.000 .677 I will frequently shop at this store in the future 1.000 .701 I will very likely to shop at this store in the future 1.000 .705 Shopping in this store is my first choice or priority 1.000 .548 I intend to shop at this store again in the future 1.000 .623
Extraction Method: Principal Component Analysis.
Total Variance Explained
Component Initial Eigenvalues Extraction Sums of Squared
Loadings
Total % of
Variance Cumulative
% Total % of
Variance Cumulative
%
1 9.819 23.380 23.380 9.819 23.380 23.380 2 3.313 7.888 31.268 3.313 7.888 31.268 3 2.809 6.689 37.957 2.809 6.689 37.957 4 2.636 6.275 44.232 2.636 6.275 44.232 5 1.985 4.726 48.957 1.985 4.726 48.957 6 1.739 4.141 53.098 1.739 4.141 53.098 7 1.655 3.941 57.040 1.655 3.941 57.040 8 1.329 3.164 60.203 1.329 3.164 60.203 9 1.081 2.574 62.777 1.081 2.574 62.777 10 .942 2.243 65.020 11 .880 2.094 67.114 12 .854 2.033 69.147 13 .806 1.920 71.067 14 .784 1.868 72.934 15 .751 1.788 74.722 16 .703 1.674 76.397 17 .661 1.573 77.970 18 .630 1.501 79.471 19 .584 1.391 80.862 20 .564 1.343 82.206 21 .540 1.286 83.492 22 .515 1.226 84.718 23 .473 1.127 85.845 24 .470 1.120 86.965 25 .445 1.059 88.024 26 .419 .997 89.021 27 .409 .974 89.995 28 .399 .951 90.946 29 .396 .942 91.888 30 .361 .859 92.747 31 .332 .790 93.537 32 .324 .771 94.308 33 .314 .747 95.055 34 .303 .721 95.775 35 .291 .693 96.468 36 .258 .613 97.082 37 .252 .600 97.682 38 .241 .574 98.256

105
39 .221 .525 98.781 40 .197 .470 99.251 41 .171 .408 99.659 42 .143 .341 100.000
Extraction Method: Principal Component Analysis.
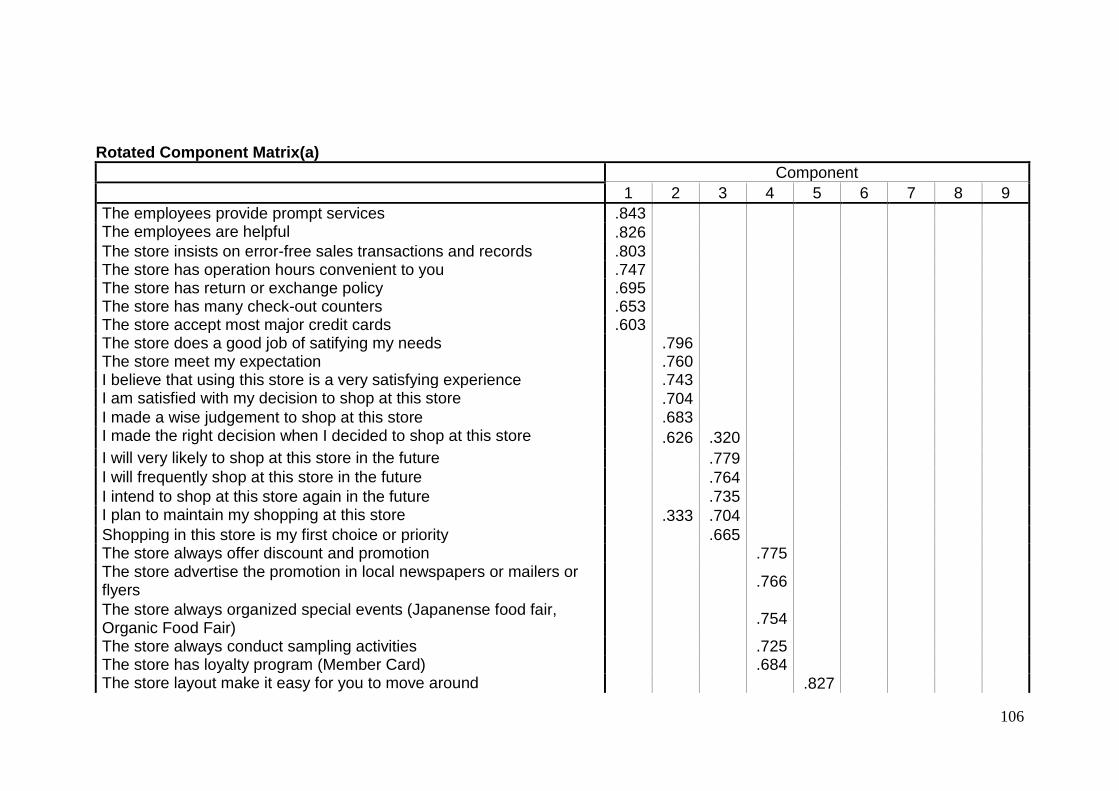
106
Rotated Component Matrix(a)
Component
1 2 3 4 5 6 7 8 9
The employees provide prompt services .843 The employees are helpful .826
The store insists on error-free sales transactions and records .803 The store has operation hours convenient to you .747 The store has return or exchange policy .695 The store has many check-out counters .653 The store accept most major credit cards .603 The store does a good job of satifying my needs .796 The store meet my expectation .760 I believe that using this store is a very satisfying experience .743 I am satisfied with my decision to shop at this store .704 I made a wise judgement to shop at this store .683 I made the right decision when I decided to shop at this store .626 .320
I will very likely to shop at this store in the future .779 I will frequently shop at this store in the future .764
I intend to shop at this store again in the future .735 I plan to maintain my shopping at this store .333 .704
Shopping in this store is my first choice or priority .665 The store always offer discount and promotion .775 The store advertise the promotion in local newspapers or mailers or flyers
.766
The store always organized special events (Japanense food fair, Organic Food Fair)
.754
The store always conduct sampling activities .725 The store has loyalty program (Member Card) .684 The store layout make it easy for you to move around .827
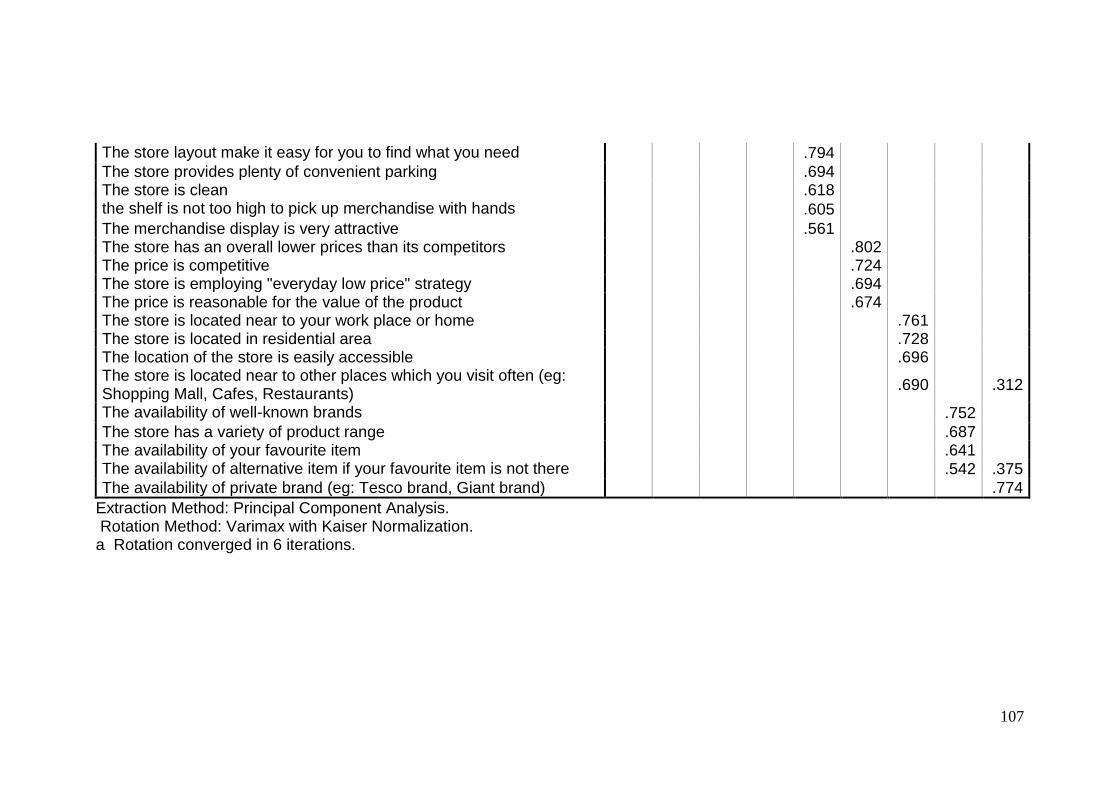
107
The store layout make it easy for you to find what you need .794
The store provides plenty of convenient parking .694 The store is clean .618 the shelf is not too high to pick up merchandise with hands .605
The merchandise display is very attractive .561 The store has an overall lower prices than its competitors .802 The price is competitive .724 The store is employing "everyday low price" strategy .694 The price is reasonable for the value of the product .674 The store is located near to your work place or home .761 The store is located in residential area .728 The location of the store is easily accessible .696 The store is located near to other places which you visit often (eg: Shopping Mall, Cafes, Restaurants)
.690 .312
The availability of well-known brands .752
The store has a variety of product range .687 The availability of your favourite item .641 The availability of alternative item if your favourite item is not there .542 .375
The availability of private brand (eg: Tesco brand, Giant brand) .774
Extraction Method: Principal Component Analysis. Rotation Method: Varimax with Kaiser Normalization. a Rotation converged in 6 iterations.
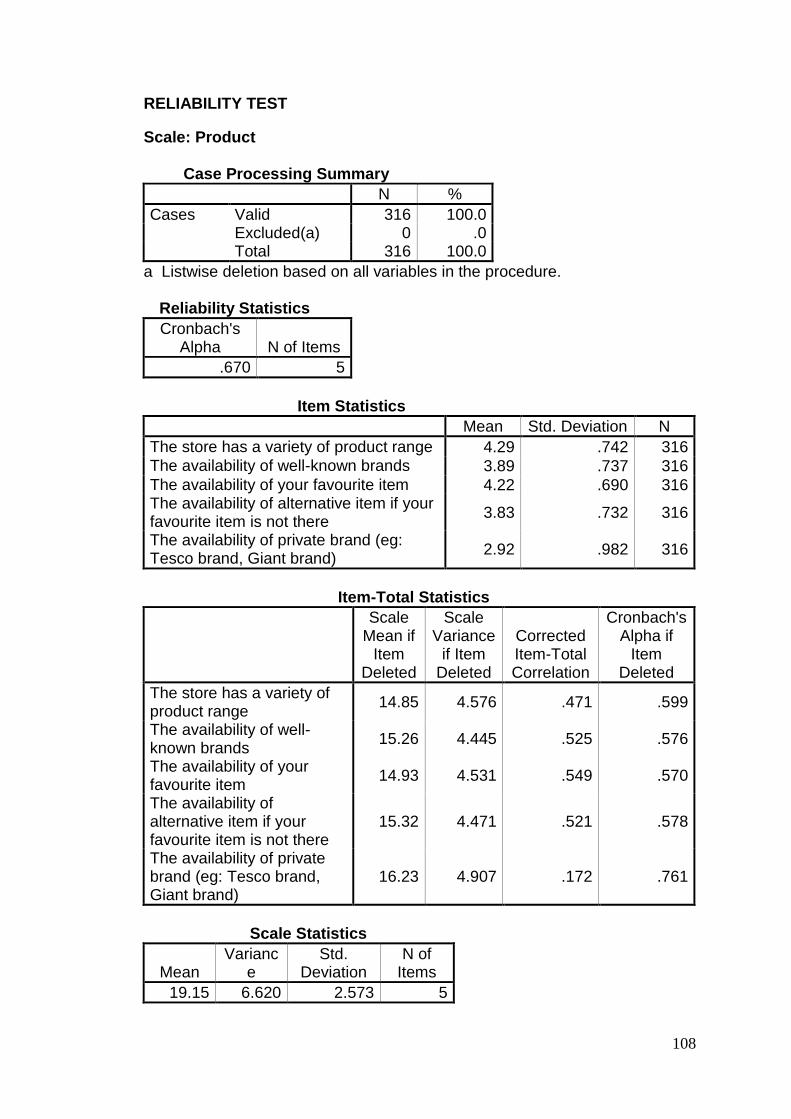
108
RELIABILITY TEST
Scale: Product Case Processing Summary
N %
Cases Valid 316 100.0 Excluded(a) 0 .0 Total 316 100.0
a Listwise deletion based on all variables in the procedure. Reliability Statistics
Cronbach's Alpha N of Items
.670 5
Item Statistics
Mean Std. Deviation N
The store has a variety of product range 4.29 .742 316 The availability of well-known brands 3.89 .737 316
The availability of your favourite item 4.22 .690 316 The availability of alternative item if your favourite item is not there
3.83 .732 316
The availability of private brand (eg: Tesco brand, Giant brand)
2.92 .982 316
Item-Total Statistics
Scale Mean if
Item Deleted
Scale Variance
if Item Deleted
Corrected Item-Total Correlation
Cronbach's Alpha if
Item Deleted
The store has a variety of product range
14.85 4.576 .471 .599
The availability of well-known brands
15.26 4.445 .525 .576
The availability of your favourite item
14.93 4.531 .549 .570
The availability of alternative item if your favourite item is not there
15.32 4.471 .521 .578
The availability of private brand (eg: Tesco brand, Giant brand)
16.23 4.907 .172 .761
Scale Statistics
Mean Varianc
e Std.
Deviation N of
Items
19.15 6.620 2.573 5
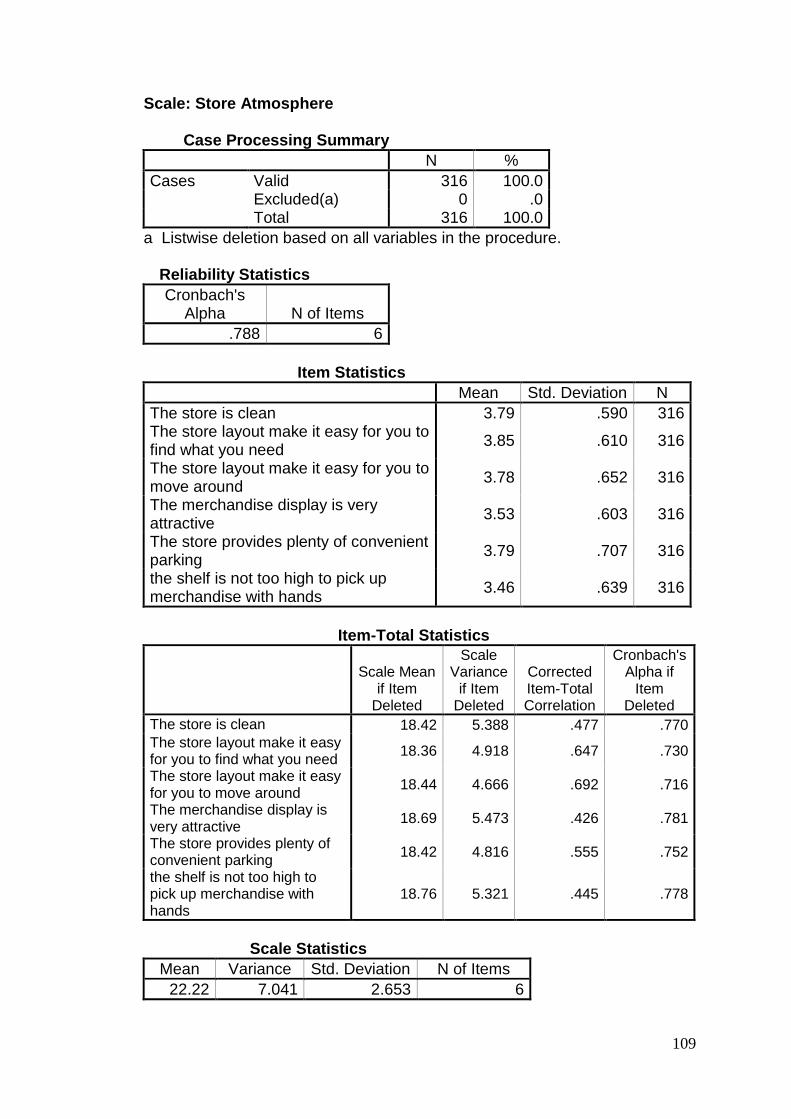
109
Scale: Store Atmosphere Case Processing Summary
N %
Cases Valid 316 100.0 Excluded(a) 0 .0 Total 316 100.0
a Listwise deletion based on all variables in the procedure. Reliability Statistics
Cronbach's Alpha N of Items
.788 6
Item Statistics
Mean Std. Deviation N
The store is clean 3.79 .590 316 The store layout make it easy for you to find what you need
3.85 .610 316
The store layout make it easy for you to move around
3.78 .652 316
The merchandise display is very attractive
3.53 .603 316
The store provides plenty of convenient parking
3.79 .707 316
the shelf is not too high to pick up merchandise with hands
3.46 .639 316
Item-Total Statistics
Scale Mean if Item
Deleted
Scale Variance
if Item Deleted
Corrected Item-Total Correlation
Cronbach's Alpha if
Item Deleted
The store is clean 18.42 5.388 .477 .770 The store layout make it easy for you to find what you need
18.36 4.918 .647 .730
The store layout make it easy for you to move around
18.44 4.666 .692 .716
The merchandise display is very attractive
18.69 5.473 .426 .781
The store provides plenty of convenient parking
18.42 4.816 .555 .752
the shelf is not too high to pick up merchandise with hands
18.76 5.321 .445 .778
Scale Statistics
Mean Variance Std. Deviation N of Items
22.22 7.041 2.653 6

110
Scale: Location Case Processing Summary
N %
Cases Valid 316 100.0 Excluded(a) 0 .0 Total 316 100.0
a Listwise deletion based on all variables in the procedure. Reliability Statistics
Cronbach's Alpha N of Items
.749 4
Item Statistics
Mean Std. Deviation N
The store is located near to your work place or home
4.09 .698 316
The store is located in residential area 3.73 .727 316 The store is located near to other places which you visit often (eg: Shopping Mall, Cafes, Restaurants)
3.71 .669 316
The location of the store is easily accessible 4.10 .710 316
Item-Total Statistics
Scale Mean if
Item Deleted
Scale Variance
if Item Deleted
Corrected Item-Total Correlation
Cronbach's Alpha if
Item Deleted
The store is located near to your work place or home
11.54 2.624 .609 .654
The store is located in residential area
11.90 2.641 .558 .683
The store is located near to other places which you visit often (eg: Shopping Mall, Cafes, Restaurants)
11.92 3.015 .442 .744
The location of the store is easily accessible
11.53 2.663 .570 .676
Scale Statistics
Mean Variance Std.
Deviation N of Items
15.63 4.488 2.118 4
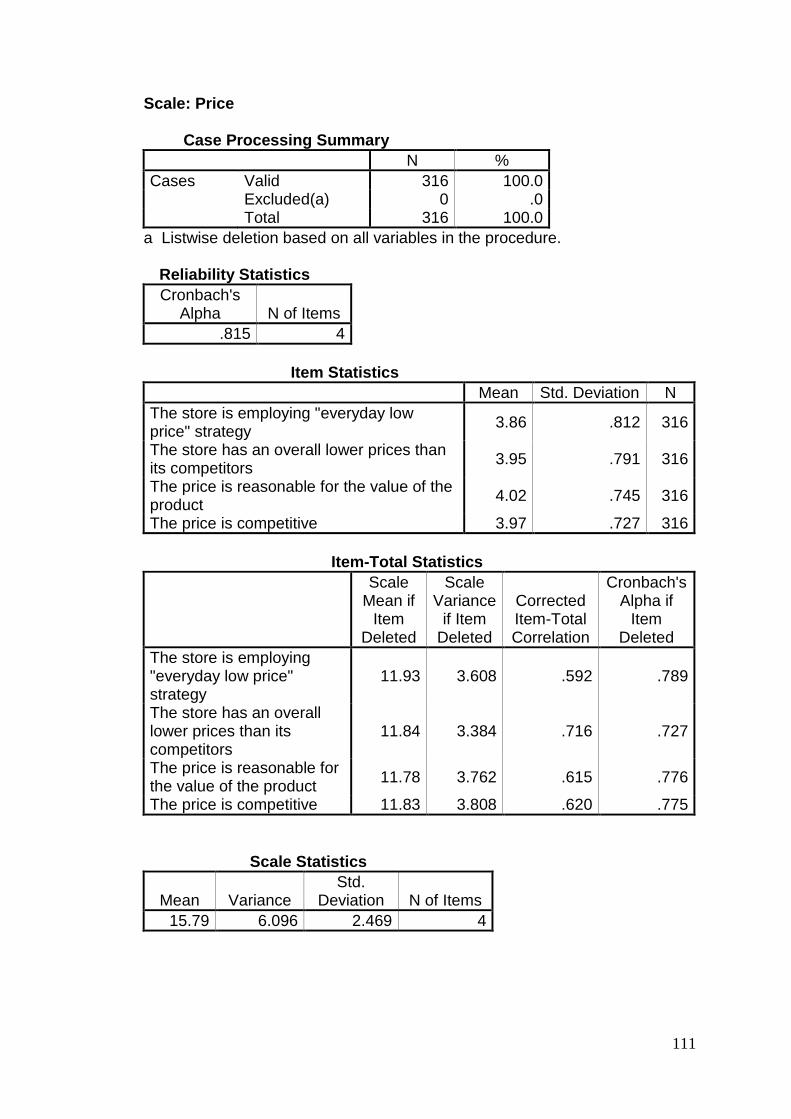
111
Scale: Price Case Processing Summary
N %
Cases Valid 316 100.0 Excluded(a) 0 .0 Total 316 100.0
a Listwise deletion based on all variables in the procedure. Reliability Statistics
Cronbach's Alpha N of Items
.815 4
Item Statistics
Mean Std. Deviation N
The store is employing "everyday low price" strategy
3.86 .812 316
The store has an overall lower prices than its competitors
3.95 .791 316
The price is reasonable for the value of the product
4.02 .745 316
The price is competitive 3.97 .727 316
Item-Total Statistics
Scale Mean if
Item Deleted
Scale Variance
if Item Deleted
Corrected Item-Total Correlation
Cronbach's Alpha if
Item Deleted
The store is employing "everyday low price" strategy
11.93 3.608 .592 .789
The store has an overall lower prices than its competitors
11.84 3.384 .716 .727
The price is reasonable for the value of the product
11.78 3.762 .615 .776
The price is competitive 11.83 3.808 .620 .775
Scale Statistics
Mean Variance Std.
Deviation N of Items
15.79 6.096 2.469 4
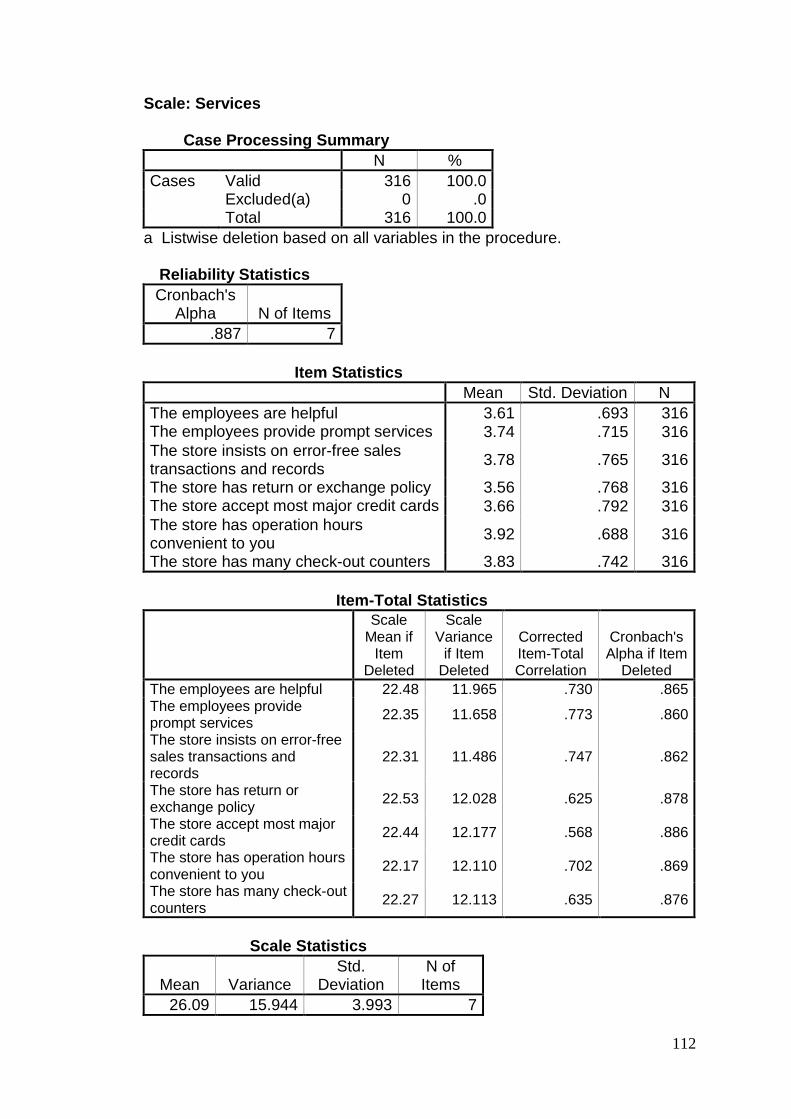
112
Scale: Services Case Processing Summary
N %
Cases Valid 316 100.0 Excluded(a) 0 .0 Total 316 100.0
a Listwise deletion based on all variables in the procedure. Reliability Statistics
Cronbach's Alpha N of Items
.887 7
Item Statistics
Mean Std. Deviation N
The employees are helpful 3.61 .693 316 The employees provide prompt services 3.74 .715 316
The store insists on error-free sales transactions and records
3.78 .765 316
The store has return or exchange policy 3.56 .768 316 The store accept most major credit cards 3.66 .792 316 The store has operation hours convenient to you
3.92 .688 316
The store has many check-out counters 3.83 .742 316
Item-Total Statistics
Scale Mean if
Item Deleted
Scale Variance
if Item Deleted
Corrected Item-Total Correlation
Cronbach's Alpha if Item
Deleted
The employees are helpful 22.48 11.965 .730 .865 The employees provide prompt services
22.35 11.658 .773 .860
The store insists on error-free sales transactions and records
22.31 11.486 .747 .862
The store has return or exchange policy
22.53 12.028 .625 .878
The store accept most major credit cards
22.44 12.177 .568 .886
The store has operation hours convenient to you
22.17 12.110 .702 .869
The store has many check-out counters
22.27 12.113 .635 .876
Scale Statistics
Mean Variance Std.
Deviation N of
Items
26.09 15.944 3.993 7
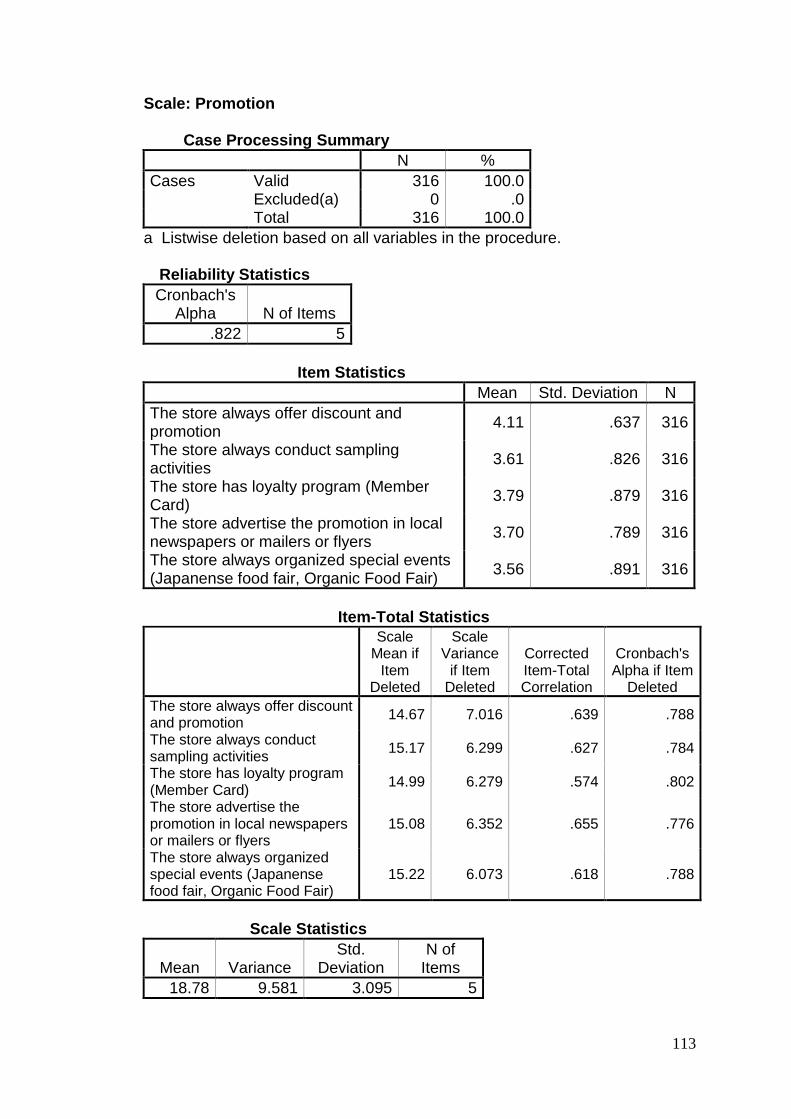
113
Scale: Promotion Case Processing Summary
N %
Cases Valid 316 100.0 Excluded(a) 0 .0 Total 316 100.0
a Listwise deletion based on all variables in the procedure. Reliability Statistics
Cronbach's Alpha N of Items
.822 5
Item Statistics
Mean Std. Deviation N
The store always offer discount and promotion
4.11 .637 316
The store always conduct sampling activities
3.61 .826 316
The store has loyalty program (Member Card)
3.79 .879 316
The store advertise the promotion in local newspapers or mailers or flyers
3.70 .789 316
The store always organized special events (Japanense food fair, Organic Food Fair)
3.56 .891 316
Item-Total Statistics
Scale Mean if
Item Deleted
Scale Variance
if Item Deleted
Corrected Item-Total Correlation
Cronbach's Alpha if Item
Deleted
The store always offer discount and promotion
14.67 7.016 .639 .788
The store always conduct sampling activities
15.17 6.299 .627 .784
The store has loyalty program (Member Card)
14.99 6.279 .574 .802
The store advertise the promotion in local newspapers or mailers or flyers
15.08 6.352 .655 .776
The store always organized special events (Japanense food fair, Organic Food Fair)
15.22 6.073 .618 .788
Scale Statistics
Mean Variance Std.
Deviation N of
Items
18.78 9.581 3.095 5
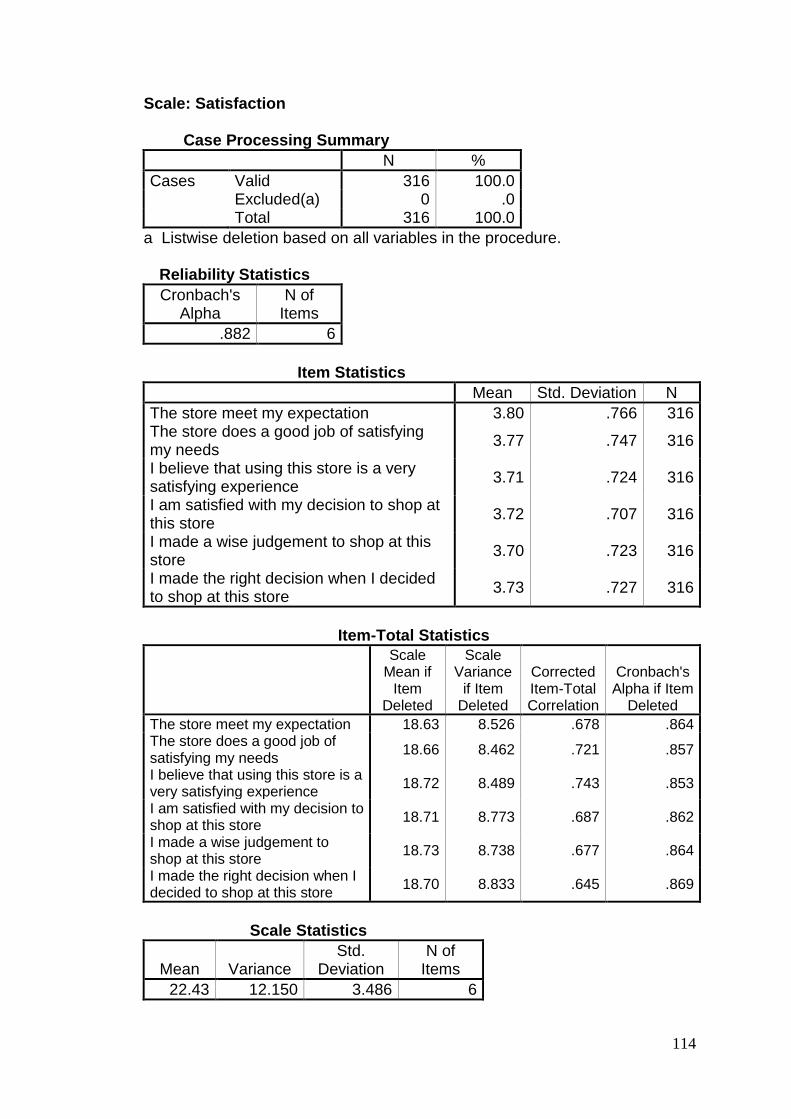
114
Scale: Satisfaction Case Processing Summary
N %
Cases Valid 316 100.0 Excluded(a) 0 .0 Total 316 100.0
a Listwise deletion based on all variables in the procedure. Reliability Statistics
Cronbach's Alpha
N of Items
.882 6
Item Statistics
Mean Std. Deviation N
The store meet my expectation 3.80 .766 316 The store does a good job of satisfying my needs
3.77 .747 316
I believe that using this store is a very satisfying experience
3.71 .724 316
I am satisfied with my decision to shop at this store
3.72 .707 316
I made a wise judgement to shop at this store
3.70 .723 316
I made the right decision when I decided to shop at this store
3.73 .727 316
Item-Total Statistics
Scale Mean if
Item Deleted
Scale Variance
if Item Deleted
Corrected Item-Total Correlation
Cronbach's Alpha if Item
Deleted
The store meet my expectation 18.63 8.526 .678 .864 The store does a good job of satisfying my needs
18.66 8.462 .721 .857
I believe that using this store is a very satisfying experience
18.72 8.489 .743 .853
I am satisfied with my decision to shop at this store
18.71 8.773 .687 .862
I made a wise judgement to shop at this store
18.73 8.738 .677 .864
I made the right decision when I decided to shop at this store
18.70 8.833 .645 .869
Scale Statistics
Mean Variance Std.
Deviation N of
Items
22.43 12.150 3.486 6
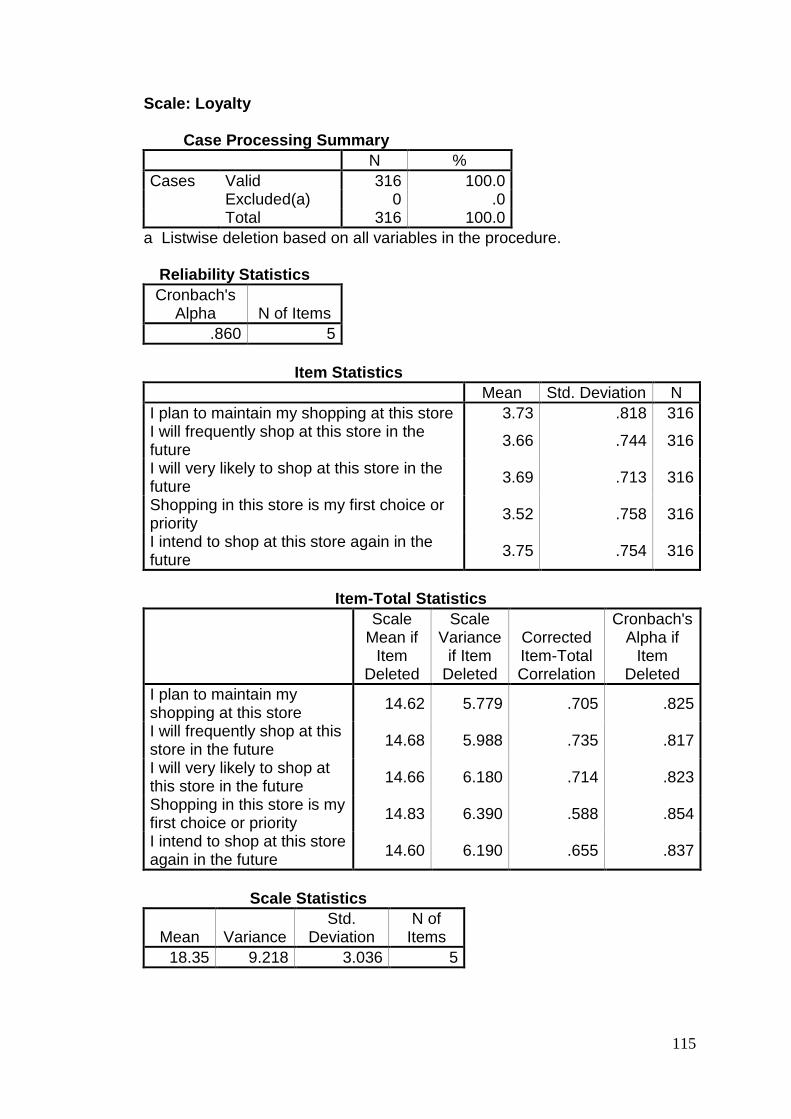
115
Scale: Loyalty Case Processing Summary
N %
Cases Valid 316 100.0 Excluded(a) 0 .0 Total 316 100.0
a Listwise deletion based on all variables in the procedure. Reliability Statistics
Cronbach's Alpha N of Items
.860 5
Item Statistics
Mean Std. Deviation N
I plan to maintain my shopping at this store 3.73 .818 316 I will frequently shop at this store in the future
3.66 .744 316
I will very likely to shop at this store in the future
3.69 .713 316
Shopping in this store is my first choice or priority
3.52 .758 316
I intend to shop at this store again in the future
3.75 .754 316
Item-Total Statistics
Scale Mean if
Item Deleted
Scale Variance
if Item Deleted
Corrected Item-Total Correlation
Cronbach's Alpha if
Item Deleted
I plan to maintain my shopping at this store
14.62 5.779 .705 .825
I will frequently shop at this store in the future
14.68 5.988 .735 .817
I will very likely to shop at this store in the future
14.66 6.180 .714 .823
Shopping in this store is my first choice or priority
14.83 6.390 .588 .854
I intend to shop at this store again in the future
14.60 6.190 .655 .837
Scale Statistics
Mean Variance Std.
Deviation N of
Items
18.35 9.218 3.036 5
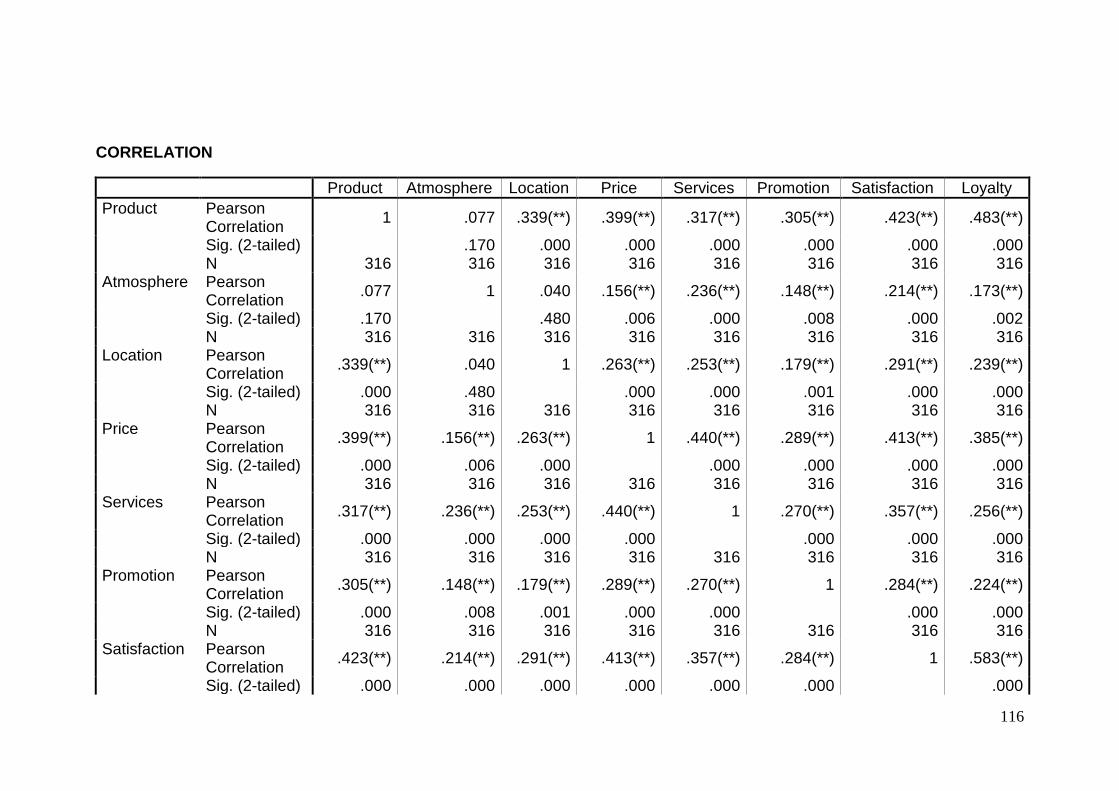
116
CORRELATION
Product Atmosphere Location Price Services Promotion Satisfaction Loyalty
Product Pearson Correlation
1 .077 .339(**) .399(**) .317(**) .305(**) .423(**) .483(**)
Sig. (2-tailed) .170 .000 .000 .000 .000 .000 .000 N 316 316 316 316 316 316 316 316 Atmosphere Pearson
Correlation .077 1 .040 .156(**) .236(**) .148(**) .214(**) .173(**)
Sig. (2-tailed) .170 .480 .006 .000 .008 .000 .002 N 316 316 316 316 316 316 316 316 Location Pearson
Correlation .339(**) .040 1 .263(**) .253(**) .179(**) .291(**) .239(**)
Sig. (2-tailed) .000 .480 .000 .000 .001 .000 .000 N 316 316 316 316 316 316 316 316 Price Pearson
Correlation .399(**) .156(**) .263(**) 1 .440(**) .289(**) .413(**) .385(**)
Sig. (2-tailed) .000 .006 .000 .000 .000 .000 .000 N 316 316 316 316 316 316 316 316 Services Pearson
Correlation .317(**) .236(**) .253(**) .440(**) 1 .270(**) .357(**) .256(**)
Sig. (2-tailed) .000 .000 .000 .000 .000 .000 .000 N 316 316 316 316 316 316 316 316 Promotion Pearson
Correlation .305(**) .148(**) .179(**) .289(**) .270(**) 1 .284(**) .224(**)
Sig. (2-tailed) .000 .008 .001 .000 .000 .000 .000 N 316 316 316 316 316 316 316 316 Satisfaction Pearson
Correlation .423(**) .214(**) .291(**) .413(**) .357(**) .284(**) 1 .583(**)
Sig. (2-tailed) .000 .000 .000 .000 .000 .000 .000
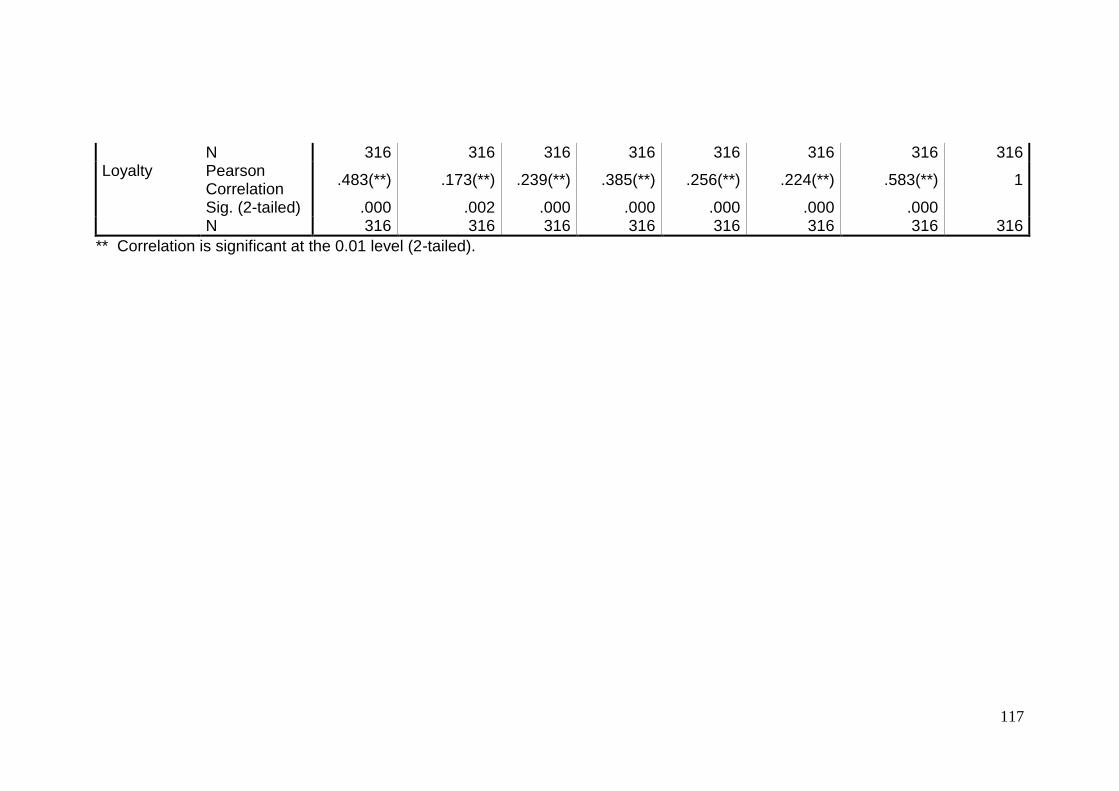
117
N 316 316 316 316 316 316 316 316 Loyalty Pearson
Correlation .483(**) .173(**) .239(**) .385(**) .256(**) .224(**) .583(**) 1
Sig. (2-tailed) .000 .002 .000 .000 .000 .000 .000 N 316 316 316 316 316 316 316 316
** Correlation is significant at the 0.01 level (2-tailed).
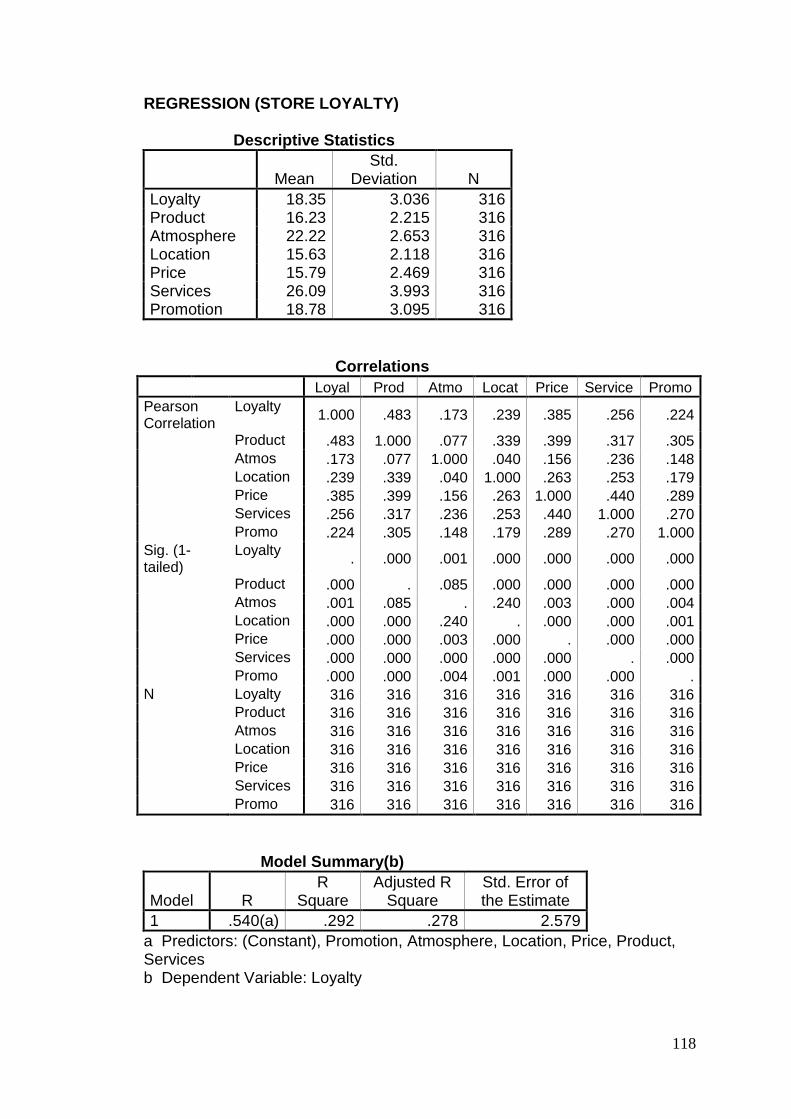
118
REGRESSION (STORE LOYALTY) Descriptive Statistics
Mean Std.
Deviation N
Loyalty 18.35 3.036 316 Product 16.23 2.215 316 Atmosphere 22.22 2.653 316 Location 15.63 2.118 316 Price 15.79 2.469 316 Services 26.09 3.993 316 Promotion 18.78 3.095 316
Correlations
Loyal Prod Atmo Locat Price Service Promo
Pearson Correlation
Loyalty 1.000 .483 .173 .239 .385 .256 .224
Product .483 1.000 .077 .339 .399 .317 .305 Atmos .173 .077 1.000 .040 .156 .236 .148 Location .239 .339 .040 1.000 .263 .253 .179 Price .385 .399 .156 .263 1.000 .440 .289 Services .256 .317 .236 .253 .440 1.000 .270 Promo .224 .305 .148 .179 .289 .270 1.000 Sig. (1-tailed)
Loyalty . .000 .001 .000 .000 .000 .000
Product .000 . .085 .000 .000 .000 .000 Atmos .001 .085 . .240 .003 .000 .004 Location .000 .000 .240 . .000 .000 .001 Price .000 .000 .003 .000 . .000 .000 Services .000 .000 .000 .000 .000 . .000 Promo .000 .000 .004 .001 .000 .000 . N Loyalty 316 316 316 316 316 316 316 Product 316 316 316 316 316 316 316
Atmos 316 316 316 316 316 316 316
Location 316 316 316 316 316 316 316
Price 316 316 316 316 316 316 316
Services 316 316 316 316 316 316 316
Promo 316 316 316 316 316 316 316
Model Summary(b)
Model R R
Square Adjusted R
Square Std. Error of the Estimate
1 .540(a) .292 .278 2.579
a Predictors: (Constant), Promotion, Atmosphere, Location, Price, Product, Services b Dependent Variable: Loyalty
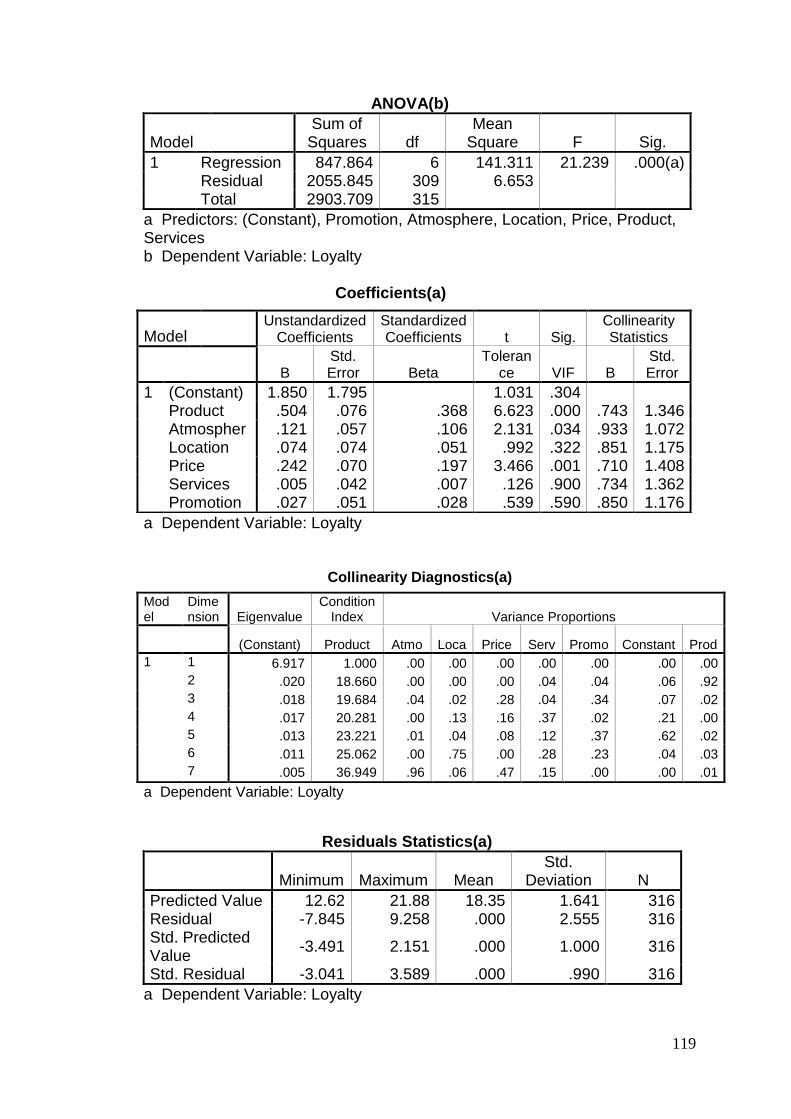
119
ANOVA(b)
Model Sum of Squares df
Mean Square F Sig.
1 Regression 847.864 6 141.311 21.239 .000(a) Residual 2055.845 309 6.653 Total 2903.709 315
a Predictors: (Constant), Promotion, Atmosphere, Location, Price, Product, Services b Dependent Variable: Loyalty
Coefficients(a)
a Dependent Variable: Loyalty
Collinearity Diagnostics(a)
a Dependent Variable: Loyalty
Residuals Statistics(a)
Minimum Maximum Mean Std.
Deviation N
Predicted Value 12.62 21.88 18.35 1.641 316 Residual -7.845 9.258 .000 2.555 316 Std. Predicted Value
-3.491 2.151 .000 1.000 316
Std. Residual -3.041 3.589 .000 .990 316
a Dependent Variable: Loyalty
Model Unstandardized
Coefficients Standardized Coefficients t Sig.
Collinearity Statistics
B Std. Error Beta
Tolerance VIF B
Std. Error
1 (Constant) 1.850 1.795 1.031 .304 Product .504 .076 .368 6.623 .000 .743 1.346 Atmospher .121 .057 .106 2.131 .034 .933 1.072 Location .074 .074 .051 .992 .322 .851 1.175 Price .242 .070 .197 3.466 .001 .710 1.408 Services .005 .042 .007 .126 .900 .734 1.362 Promotion .027 .051 .028 .539 .590 .850 1.176
Model
Dimension Eigenvalue
Condition Index Variance Proportions
(Constant) Product Atmo Loca Price Serv Promo Constant Prod
1 1 6.917 1.000 .00 .00 .00 .00 .00 .00 .00
2 .020 18.660 .00 .00 .00 .04 .04 .06 .92
3 .018 19.684 .04 .02 .28 .04 .34 .07 .02
4 .017 20.281 .00 .13 .16 .37 .02 .21 .00
5 .013 23.221 .01 .04 .08 .12 .37 .62 .02
6 .011 25.062 .00 .75 .00 .28 .23 .04 .03
7 .005 36.949 .96 .06 .47 .15 .00 .00 .01

120
REGRESSION (CUSTOMER SATISFACTION)
Correlations
Satisf Prod Atmo Locat Price Serv Promo Pearson Satisfaction 1.000 .423 .214 .291 .413 .357 .284 Correlation Product
.423 1.00
0 .077 .339 .399 .317 .305
Atmosphere .214 .077
1.000
.040 .156 .236 .148
Location .291 .339 .040 1.000 .263 .253 .179 Price .413 .399 .156 .263 1.000 .440 .289 Services .357 .317 .236 .253 .440 1.000 .270
Promotion .284 .305 .148 .179 .289 .270 1.000 Sig. (1-tailed)
Satisfaction . .000 .000 .000 .000 .000 .000
Product .000 . .085 .000 .000 .000 .000
Atmosphere .000 .085 . .240 .003 .000 .004
Location .000 .000 .240 . .000 .000 .001
Price .000 .000 .003 .000 . .000 .000
Services .000 .000 .000 .000 .000 . .000
Promotion .000 .000 .004 .001 .000 .000 . N Satisfaction 316 316 316 316 316 316 316 Product 316 316 316 316 316 316 316 Atmosphere 316 316 316 316 316 316 316 Location 316 316 316 316 316 316 316 Price 316 316 316 316 316 316 316 Services 316 316 316 316 316 316 316 Promotion 316 316 316 316 316 316 316
Descriptive Statistics
Mean Std. Deviation N
Satisfaction 22.43 3.486 316 Product 16.23 2.215 316 Atmosphere 22.22 2.653 316 Location 15.63 2.118 316 Price 15.79 2.469 316 Services 26.09 3.993 316 Promotion 18.78 3.095 316
Model Summary(b)
Model R R
Square Adjusted R
Square Std. Error of the
Estimate
1 .552(a) .305 .291 2.935
a Predictors: (Constant), Promotion, Atmosphere, Location, Price, Product, Services b Dependent Variable: Satisfaction
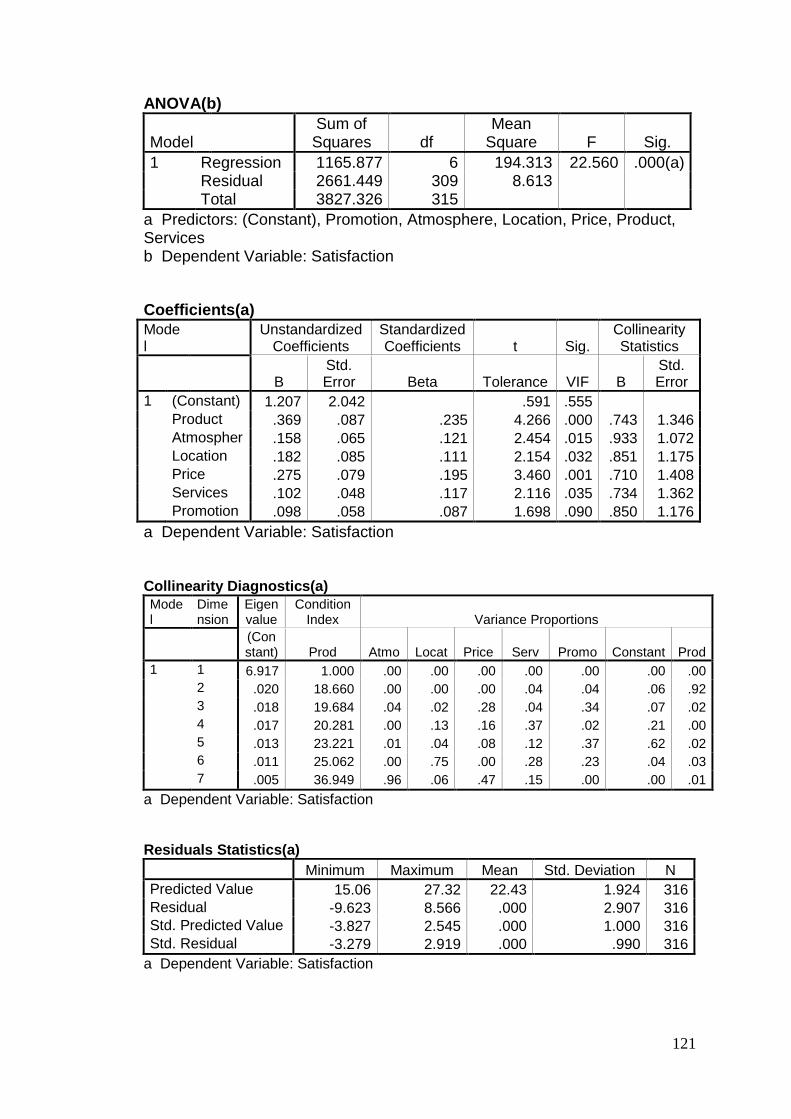
121
ANOVA(b)
Model Sum of Squares df
Mean Square F Sig.
1 Regression 1165.877 6 194.313 22.560 .000(a) Residual 2661.449 309 8.613 Total 3827.326 315
a Predictors: (Constant), Promotion, Atmosphere, Location, Price, Product, Services b Dependent Variable: Satisfaction
Coefficients(a)
Model
Unstandardized Coefficients
Standardized Coefficients t Sig.
Collinearity Statistics
B Std. Error Beta Tolerance VIF B
Std. Error
1 (Constant) 1.207 2.042 .591 .555 Product .369 .087 .235 4.266 .000 .743 1.346 Atmospher .158 .065 .121 2.454 .015 .933 1.072 Location .182 .085 .111 2.154 .032 .851 1.175 Price .275 .079 .195 3.460 .001 .710 1.408 Services .102 .048 .117 2.116 .035 .734 1.362 Promotion .098 .058 .087 1.698 .090 .850 1.176
a Dependent Variable: Satisfaction Collinearity Diagnostics(a)
Model
Dimension
Eigenvalue
Condition Index Variance Proportions
(Constant) Prod Atmo Locat Price Serv Promo Constant Prod
1 1 6.917 1.000 .00 .00 .00 .00 .00 .00 .00
2 .020 18.660 .00 .00 .00 .04 .04 .06 .92
3 .018 19.684 .04 .02 .28 .04 .34 .07 .02
4 .017 20.281 .00 .13 .16 .37 .02 .21 .00
5 .013 23.221 .01 .04 .08 .12 .37 .62 .02
6 .011 25.062 .00 .75 .00 .28 .23 .04 .03
7 .005 36.949 .96 .06 .47 .15 .00 .00 .01
a Dependent Variable: Satisfaction Residuals Statistics(a)
Minimum Maximum Mean Std. Deviation N
Predicted Value 15.06 27.32 22.43 1.924 316 Residual -9.623 8.566 .000 2.907 316 Std. Predicted Value -3.827 2.545 .000 1.000 316 Std. Residual -3.279 2.919 .000 .990 316
a Dependent Variable: Satisfaction
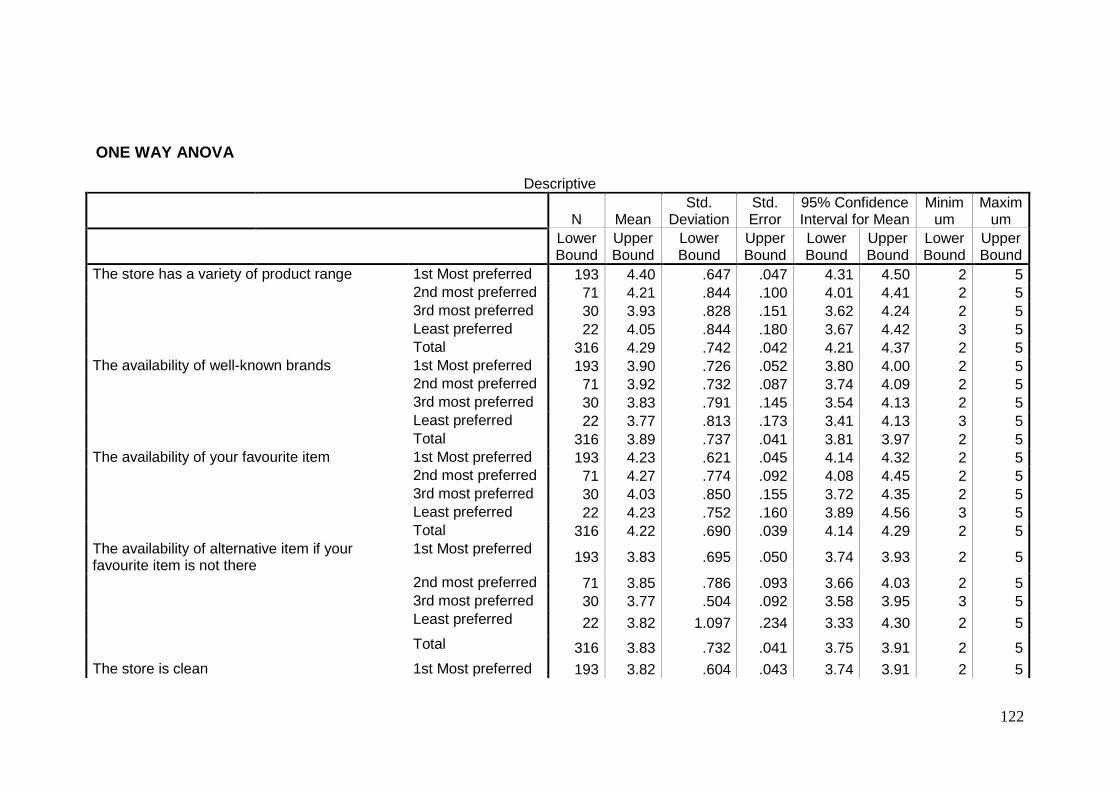
122
ONE WAY ANOVA
Descriptive
N Mean Std.
Deviation Std. Error
95% Confidence Interval for Mean
Minimum
Maximum
Lower Bound
Upper Bound
Lower Bound
Upper Bound
Lower Bound
Upper Bound
Lower Bound
Upper Bound
The store has a variety of product range 1st Most preferred 193 4.40 .647 .047 4.31 4.50 2 5 2nd most preferred 71 4.21 .844 .100 4.01 4.41 2 5
3rd most preferred 30 3.93 .828 .151 3.62 4.24 2 5
Least preferred 22 4.05 .844 .180 3.67 4.42 3 5 Total 316 4.29 .742 .042 4.21 4.37 2 5 The availability of well-known brands 1st Most preferred 193 3.90 .726 .052 3.80 4.00 2 5 2nd most preferred 71 3.92 .732 .087 3.74 4.09 2 5 3rd most preferred 30 3.83 .791 .145 3.54 4.13 2 5 Least preferred 22 3.77 .813 .173 3.41 4.13 3 5 Total 316 3.89 .737 .041 3.81 3.97 2 5 The availability of your favourite item 1st Most preferred 193 4.23 .621 .045 4.14 4.32 2 5 2nd most preferred 71 4.27 .774 .092 4.08 4.45 2 5 3rd most preferred 30 4.03 .850 .155 3.72 4.35 2 5 Least preferred 22 4.23 .752 .160 3.89 4.56 3 5 Total 316 4.22 .690 .039 4.14 4.29 2 5 The availability of alternative item if your favourite item is not there
1st Most preferred 193 3.83 .695 .050 3.74 3.93 2 5
2nd most preferred 71 3.85 .786 .093 3.66 4.03 2 5
3rd most preferred 30 3.77 .504 .092 3.58 3.95 3 5
Least preferred 22 3.82 1.097 .234 3.33 4.30 2 5
Total 316 3.83 .732 .041 3.75 3.91 2 5
The store is clean 1st Most preferred 193 3.82 .604 .043 3.74 3.91 2 5
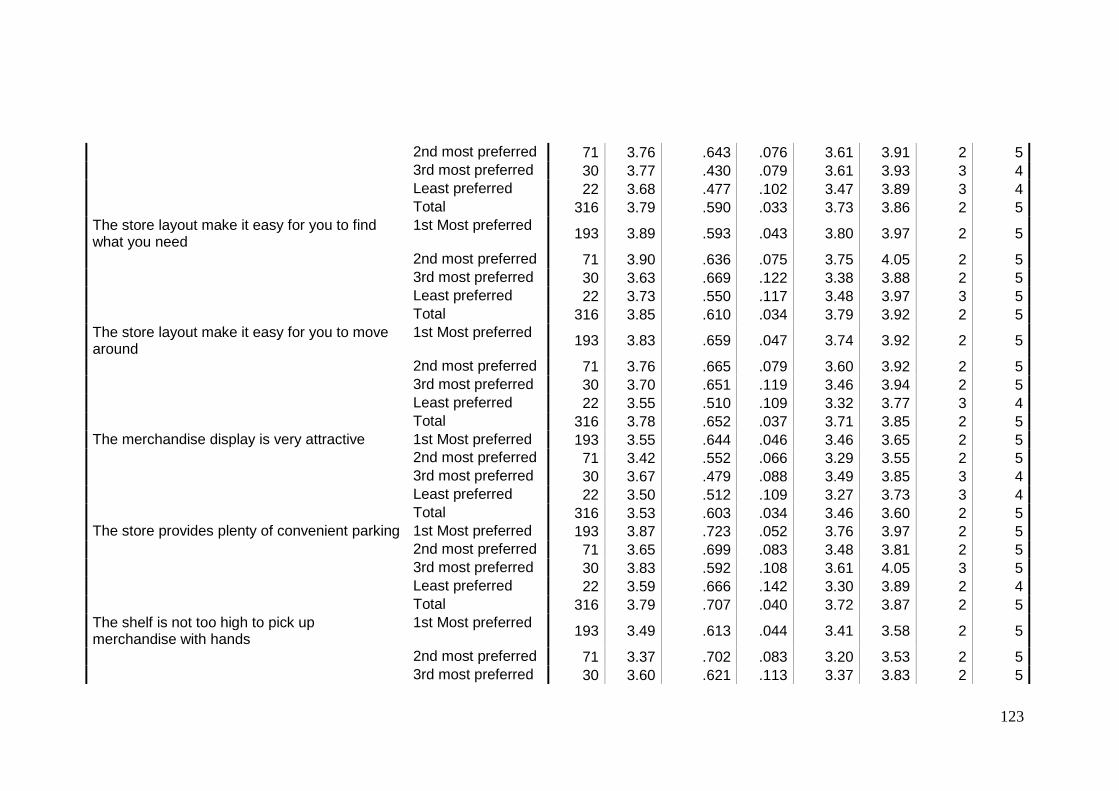
123
2nd most preferred 71 3.76 .643 .076 3.61 3.91 2 5 3rd most preferred 30 3.77 .430 .079 3.61 3.93 3 4 Least preferred 22 3.68 .477 .102 3.47 3.89 3 4 Total 316 3.79 .590 .033 3.73 3.86 2 5 The store layout make it easy for you to find what you need
1st Most preferred 193 3.89 .593 .043 3.80 3.97 2 5
2nd most preferred 71 3.90 .636 .075 3.75 4.05 2 5 3rd most preferred 30 3.63 .669 .122 3.38 3.88 2 5 Least preferred 22 3.73 .550 .117 3.48 3.97 3 5 Total 316 3.85 .610 .034 3.79 3.92 2 5 The store layout make it easy for you to move around
1st Most preferred 193 3.83 .659 .047 3.74 3.92 2 5
2nd most preferred 71 3.76 .665 .079 3.60 3.92 2 5
3rd most preferred 30 3.70 .651 .119 3.46 3.94 2 5
Least preferred 22 3.55 .510 .109 3.32 3.77 3 4
Total 316 3.78 .652 .037 3.71 3.85 2 5 The merchandise display is very attractive 1st Most preferred 193 3.55 .644 .046 3.46 3.65 2 5 2nd most preferred 71 3.42 .552 .066 3.29 3.55 2 5 3rd most preferred 30 3.67 .479 .088 3.49 3.85 3 4 Least preferred 22 3.50 .512 .109 3.27 3.73 3 4 Total 316 3.53 .603 .034 3.46 3.60 2 5 The store provides plenty of convenient parking 1st Most preferred 193 3.87 .723 .052 3.76 3.97 2 5 2nd most preferred 71 3.65 .699 .083 3.48 3.81 2 5 3rd most preferred 30 3.83 .592 .108 3.61 4.05 3 5 Least preferred 22 3.59 .666 .142 3.30 3.89 2 4 Total 316 3.79 .707 .040 3.72 3.87 2 5 The shelf is not too high to pick up merchandise with hands
1st Most preferred 193 3.49 .613 .044 3.41 3.58 2 5
2nd most preferred 71 3.37 .702 .083 3.20 3.53 2 5 3rd most preferred 30 3.60 .621 .113 3.37 3.83 2 5
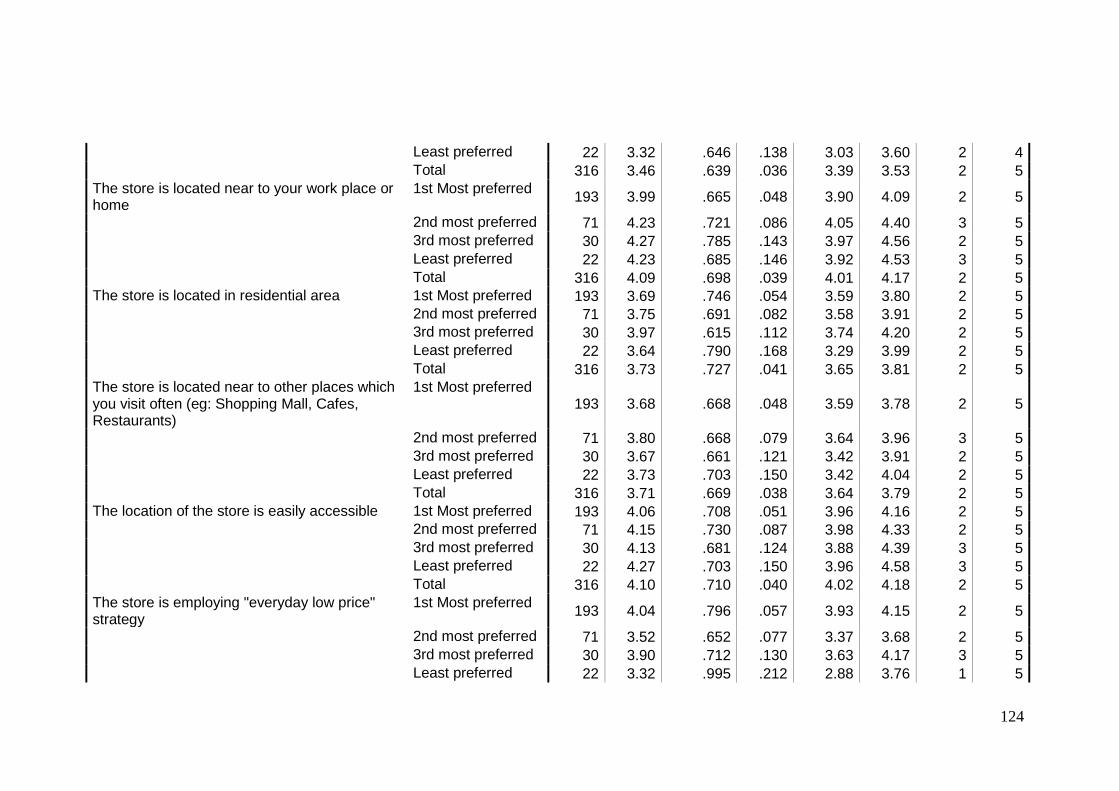
124
Least preferred 22 3.32 .646 .138 3.03 3.60 2 4 Total 316 3.46 .639 .036 3.39 3.53 2 5 The store is located near to your work place or home
1st Most preferred 193 3.99 .665 .048 3.90 4.09 2 5
2nd most preferred 71 4.23 .721 .086 4.05 4.40 3 5 3rd most preferred 30 4.27 .785 .143 3.97 4.56 2 5
Least preferred 22 4.23 .685 .146 3.92 4.53 3 5 Total 316 4.09 .698 .039 4.01 4.17 2 5 The store is located in residential area 1st Most preferred 193 3.69 .746 .054 3.59 3.80 2 5 2nd most preferred 71 3.75 .691 .082 3.58 3.91 2 5 3rd most preferred 30 3.97 .615 .112 3.74 4.20 2 5 Least preferred 22 3.64 .790 .168 3.29 3.99 2 5 Total 316 3.73 .727 .041 3.65 3.81 2 5 The store is located near to other places which you visit often (eg: Shopping Mall, Cafes, Restaurants)
1st Most preferred 193 3.68 .668 .048 3.59 3.78 2 5
2nd most preferred 71 3.80 .668 .079 3.64 3.96 3 5
3rd most preferred 30 3.67 .661 .121 3.42 3.91 2 5
Least preferred 22 3.73 .703 .150 3.42 4.04 2 5
Total 316 3.71 .669 .038 3.64 3.79 2 5 The location of the store is easily accessible 1st Most preferred 193 4.06 .708 .051 3.96 4.16 2 5 2nd most preferred 71 4.15 .730 .087 3.98 4.33 2 5 3rd most preferred 30 4.13 .681 .124 3.88 4.39 3 5 Least preferred 22 4.27 .703 .150 3.96 4.58 3 5 Total 316 4.10 .710 .040 4.02 4.18 2 5 The store is employing "everyday low price" strategy
1st Most preferred 193 4.04 .796 .057 3.93 4.15 2 5
2nd most preferred 71 3.52 .652 .077 3.37 3.68 2 5 3rd most preferred 30 3.90 .712 .130 3.63 4.17 3 5 Least preferred 22 3.32 .995 .212 2.88 3.76 1 5

125
Total 316 3.86 .812 .046 3.77 3.95 1 5 The store has an overall lower prices than its competitors
1st Most preferred 193 4.04 .773 .056 3.93 4.15 2 5
2nd most preferred 71 3.79 .754 .090 3.61 3.97 3 5 3rd most preferred 30 4.10 .759 .139 3.82 4.38 3 5 Least preferred 22 3.50 .913 .195 3.10 3.90 2 5
Total 316 3.95 .791 .045 3.86 4.04 2 5 The price is reasonable for the value of the product
1st Most preferred 193 4.05 .709 .051 3.95 4.15 2 5
2nd most preferred 71 4.08 .712 .085 3.92 4.25 2 5
3rd most preferred 30 4.07 .583 .106 3.85 4.28 3 5
Least preferred 22 3.45 1.101 .235 2.97 3.94 1 5
Total 316 4.02 .745 .042 3.93 4.10 1 5 The price is competitive 1st Most preferred 193 3.95 .734 .053 3.84 4.05 1 5 2nd most preferred 71 4.01 .621 .074 3.87 4.16 3 5 3rd most preferred 30 4.20 .664 .121 3.95 4.45 3 5 Least preferred 22 3.64 .953 .203 3.21 4.06 2 5 Total 316 3.97 .727 .041 3.88 4.05 1 5 The employees are helpful 1st Most preferred 193 3.68 .670 .048 3.58 3.77 2 5 2nd most preferred 71 3.58 .710 .084 3.41 3.75 2 5 3rd most preferred 30 3.60 .621 .113 3.37 3.83 2 5 Least preferred 22 3.14 .774 .165 2.79 3.48 2 4 Total 316 3.61 .693 .039 3.53 3.69 2 5 The employees provide prompt services 1st Most preferred 193 3.79 .699 .050 3.69 3.89 2 5 2nd most preferred 71 3.75 .731 .087 3.57 3.92 2 5 3rd most preferred 30 3.70 .651 .119 3.46 3.94 2 5
Least preferred 22 3.27 .767 .164 2.93 3.61 2 5
Total 316 3.74 .715 .040 3.66 3.82 2 5 The store insists on error-free sales transactions and records
1st Most preferred 193 3.84 .761 .055 3.74 3.95 2 5
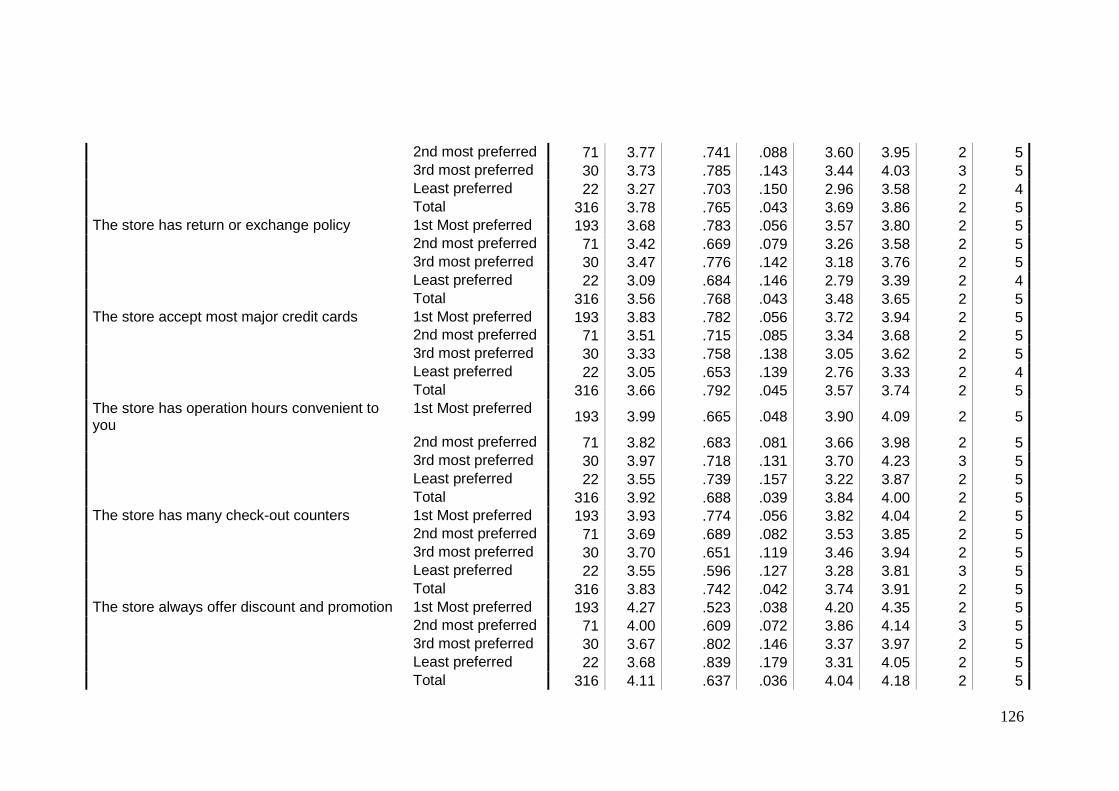
126
2nd most preferred 71 3.77 .741 .088 3.60 3.95 2 5 3rd most preferred 30 3.73 .785 .143 3.44 4.03 3 5 Least preferred 22 3.27 .703 .150 2.96 3.58 2 4 Total 316 3.78 .765 .043 3.69 3.86 2 5 The store has return or exchange policy 1st Most preferred 193 3.68 .783 .056 3.57 3.80 2 5 2nd most preferred 71 3.42 .669 .079 3.26 3.58 2 5
3rd most preferred 30 3.47 .776 .142 3.18 3.76 2 5
Least preferred 22 3.09 .684 .146 2.79 3.39 2 4
Total 316 3.56 .768 .043 3.48 3.65 2 5 The store accept most major credit cards 1st Most preferred 193 3.83 .782 .056 3.72 3.94 2 5 2nd most preferred 71 3.51 .715 .085 3.34 3.68 2 5 3rd most preferred 30 3.33 .758 .138 3.05 3.62 2 5 Least preferred 22 3.05 .653 .139 2.76 3.33 2 4 Total 316 3.66 .792 .045 3.57 3.74 2 5 The store has operation hours convenient to you
1st Most preferred 193 3.99 .665 .048 3.90 4.09 2 5
2nd most preferred 71 3.82 .683 .081 3.66 3.98 2 5 3rd most preferred 30 3.97 .718 .131 3.70 4.23 3 5 Least preferred 22 3.55 .739 .157 3.22 3.87 2 5 Total 316 3.92 .688 .039 3.84 4.00 2 5 The store has many check-out counters 1st Most preferred 193 3.93 .774 .056 3.82 4.04 2 5 2nd most preferred 71 3.69 .689 .082 3.53 3.85 2 5 3rd most preferred 30 3.70 .651 .119 3.46 3.94 2 5 Least preferred 22 3.55 .596 .127 3.28 3.81 3 5 Total 316 3.83 .742 .042 3.74 3.91 2 5 The store always offer discount and promotion 1st Most preferred 193 4.27 .523 .038 4.20 4.35 2 5 2nd most preferred 71 4.00 .609 .072 3.86 4.14 3 5
3rd most preferred 30 3.67 .802 .146 3.37 3.97 2 5
Least preferred 22 3.68 .839 .179 3.31 4.05 2 5
Total 316 4.11 .637 .036 4.04 4.18 2 5

127
The store always conduct sampling activities 1st Most preferred 193 3.75 .700 .050 3.65 3.85 2 5 2nd most preferred 71 3.37 .914 .108 3.15 3.58 1 5 3rd most preferred 30 3.57 1.006 .184 3.19 3.94 2 5 Least preferred 22 3.27 1.032 .220 2.82 3.73 2 5 Total 316 3.61 .826 .046 3.52 3.71 1 5 The store has loyalty program (Member Card) 1st Most preferred 193 3.95 .709 .051 3.85 4.05 2 5 2nd most preferred 71 3.68 .922 .109 3.46 3.89 1 5 3rd most preferred 30 3.63 1.189 .217 3.19 4.08 1 5 Least preferred 22 3.00 1.113 .237 2.51 3.49 2 5 Total 316 3.79 .879 .049 3.70 3.89 1 5 The store advertise the promotion in local newspapers or mailers or flyers
1st Most preferred 193 3.85 .684 .049 3.76 3.95 2 5
2nd most preferred 71 3.62 .834 .099 3.42 3.82 2 5 3rd most preferred 30 3.30 .915 .167 2.96 3.64 2 5 Least preferred 22 3.18 .907 .193 2.78 3.58 2 5 Total 316 3.70 .789 .044 3.62 3.79 2 5 The store always organized special events (Japanense food fair, Organic Food Fair)
1st Most preferred 193 3.68 .736 .053 3.57 3.78 2 5
2nd most preferred 71 3.55 .968 .115 3.32 3.78 2 5 3rd most preferred 30 3.03 1.273 .232 2.56 3.51 1 5 Least preferred 22 3.23 .973 .207 2.80 3.66 2 5 Total 316 3.56 .891 .050 3.46 3.66 1 5
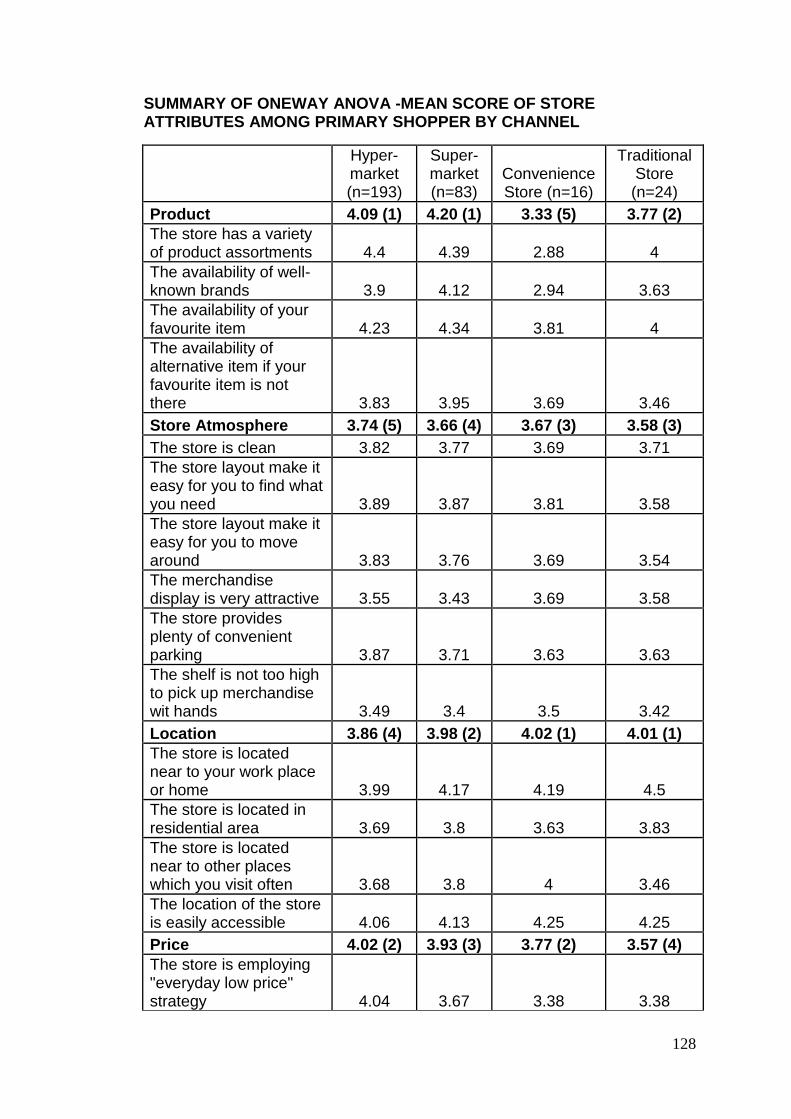
128
SUMMARY OF ONEWAY ANOVA -MEAN SCORE OF STORE ATTRIBUTES AMONG PRIMARY SHOPPER BY CHANNEL
Hyper-market (n=193)
Super-market (n=83)
Convenience Store (n=16)
Traditional Store (n=24)
Product 4.09 (1) 4.20 (1) 3.33 (5) 3.77 (2)
The store has a variety of product assortments 4.4 4.39 2.88 4
The availability of well-known brands 3.9 4.12 2.94 3.63
The availability of your favourite item 4.23 4.34 3.81 4
The availability of alternative item if your favourite item is not there 3.83 3.95 3.69 3.46
Store Atmosphere 3.74 (5) 3.66 (4) 3.67 (3) 3.58 (3)
The store is clean 3.82 3.77 3.69 3.71
The store layout make it easy for you to find what you need 3.89 3.87 3.81 3.58
The store layout make it easy for you to move around 3.83 3.76 3.69 3.54
The merchandise display is very attractive 3.55 3.43 3.69 3.58
The store provides plenty of convenient parking 3.87 3.71 3.63 3.63
The shelf is not too high to pick up merchandise wit hands 3.49 3.4 3.5 3.42
Location 3.86 (4) 3.98 (2) 4.02 (1) 4.01 (1)
The store is located near to your work place or home 3.99 4.17 4.19 4.5
The store is located in residential area 3.69 3.8 3.63 3.83
The store is located near to other places which you visit often 3.68 3.8 4 3.46
The location of the store is easily accessible 4.06 4.13 4.25 4.25
Price 4.02 (2) 3.93 (3) 3.77 (2) 3.57 (4)
The store is employing "everyday low price" strategy 4.04 3.67 3.38 3.38
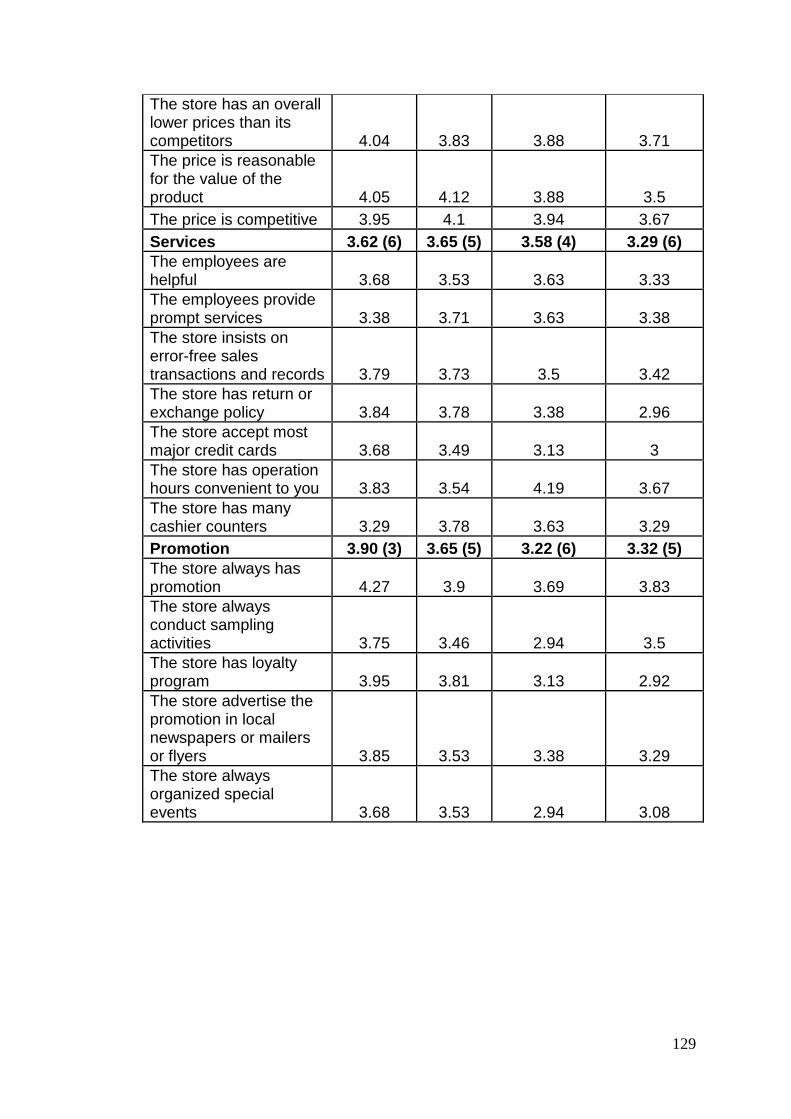
129
The store has an overall lower prices than its competitors 4.04 3.83 3.88 3.71
The price is reasonable for the value of the product 4.05 4.12 3.88 3.5
The price is competitive 3.95 4.1 3.94 3.67
Services 3.62 (6) 3.65 (5) 3.58 (4) 3.29 (6)
The employees are helpful 3.68 3.53 3.63 3.33
The employees provide prompt services 3.38 3.71 3.63 3.38
The store insists on error-free sales transactions and records 3.79 3.73 3.5 3.42
The store has return or exchange policy 3.84 3.78 3.38 2.96
The store accept most major credit cards 3.68 3.49 3.13 3
The store has operation hours convenient to you 3.83 3.54 4.19 3.67
The store has many cashier counters 3.29 3.78 3.63 3.29
Promotion 3.90 (3) 3.65 (5) 3.22 (6) 3.32 (5)
The store always has promotion 4.27 3.9 3.69 3.83
The store always conduct sampling activities 3.75 3.46 2.94 3.5
The store has loyalty program 3.95 3.81 3.13 2.92
The store advertise the promotion in local newspapers or mailers or flyers 3.85 3.53 3.38 3.29
The store always organized special events 3.68 3.53 2.94 3.08